INVITE-ONLY SCRIPT
更新済 BANK NIFTY ALGO
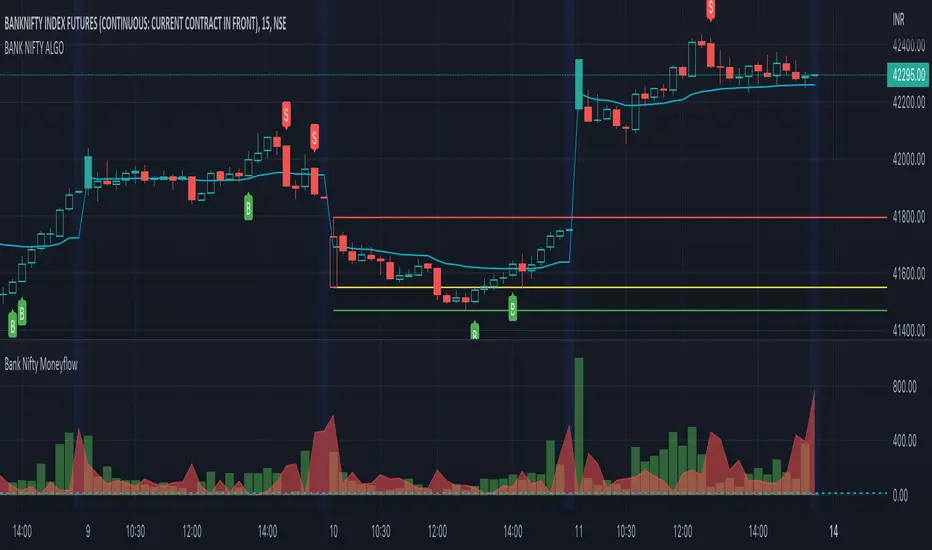
This indicator is specifically designed for trading Bank Nifty (NSE) for intraday trading & short term swing trading
Description :
This indicator is based on Price Action Theory, Volume Profiles and Moneyflow Analytics. It also incorporates important parameters of the underlying assets such as Banking stocks & key benchmark banking metrics. It shows the bias of the index at any given point of time.
USP: It reacts to change in price momentum if that is sustainable; thereby eliminating random spikes & offshoots in price. This is much more conservative way of trading & gives signal only when the trend is strongly stabilized.
How to use ?
Timeframe : Time duration for each bar (Input to given to the indicator by user)
Notations used in the indicator:
B- Signal for Buy
S- Signal for Sell
CS- Close Shorts
CL- Close Longs
BookLong- Book all Longs
BookShort- Book all Shorts
Critical Pivot is a point which is defined as the boundary of bullish & bearish sides. This is the thick line which changes color green to maroon to grey. It gives an idea of bias in the market. Green color is for Bullish bias, Maroon for Bearish bias & Grey for Neutral
Swing High: The dynamic green line at the end of the charts
Swing Low : The dynamic red line at the end of the charts
Major uses of the Indicator:
1. Understanding the direction of Bank Nifty and understands levels for entry / exits --- B & S signals
2. Understanding SL levels in order to prevent loss during unforeseen events ------------- Break of the critical pivot ( green/maroon line )
3. Understanding Trailing SL levels to hold on to the winners --------------------------------- Break of the Green/Red Line
Ideal Timeframes for this Indicator :
1.Intraday ( 5 min/15 mins )
2.Swing ( 30 mins/1 hour)
Disclaimer: This script/strategy is for educational purpose and individual use only. The author of this script/strategy will not accept any liability for loss or damage as a result of reliance on the information contained in the charts. Please be fully informed regarding the risks associated with trading the financial markets.
This is a premium indicator
If you want access to this indicator, please message us (Links/Email in description below )
リリースノート
Updated with changes in bnf constituents リリースノート
Weights updated リリースノート
Weights updated リリースノート
..リリースノート
Updated weights 招待専用スクリプト
このスクリプトは作者が承認したユーザーのみアクセス可能です。使用するにはアクセス申請をして許可を得る必要があります。通常は支払い後に承認されます。詳細は下記の作者の指示に従うか、aditya_biswasに直接お問い合わせください。
TradingViewは、作者を完全に信頼し、スクリプトの動作を理解していない限り、有料スクリプトの購入・使用を推奨しません。コミュニティスクリプトには無料のオープンソースの代替が多数あります。
作者の指示
Please send over a personal message in trading view or whatsapp for access
Coordinates :
Detailed demo/Live replay : youtube.com/channel/UC79RlSqRn85th7zgpZpz3Iw
email : quantumtradingsystem@gmail.com
Detailed demo/Live replay : youtube.com/channel/UC79RlSqRn85th7zgpZpz3Iw
email : quantumtradingsystem@gmail.com
免責事項
この情報および投稿は、TradingViewが提供または推奨する金融、投資、トレード、その他のアドバイスや推奨を意図するものではなく、それらを構成するものでもありません。詳細は利用規約をご覧ください。
招待専用スクリプト
このスクリプトは作者が承認したユーザーのみアクセス可能です。使用するにはアクセス申請をして許可を得る必要があります。通常は支払い後に承認されます。詳細は下記の作者の指示に従うか、aditya_biswasに直接お問い合わせください。
TradingViewは、作者を完全に信頼し、スクリプトの動作を理解していない限り、有料スクリプトの購入・使用を推奨しません。コミュニティスクリプトには無料のオープンソースの代替が多数あります。
作者の指示
Please send over a personal message in trading view or whatsapp for access
Coordinates :
Detailed demo/Live replay : youtube.com/channel/UC79RlSqRn85th7zgpZpz3Iw
email : quantumtradingsystem@gmail.com
Detailed demo/Live replay : youtube.com/channel/UC79RlSqRn85th7zgpZpz3Iw
email : quantumtradingsystem@gmail.com
免責事項
この情報および投稿は、TradingViewが提供または推奨する金融、投資、トレード、その他のアドバイスや推奨を意図するものではなく、それらを構成するものでもありません。詳細は利用規約をご覧ください。