OPEN-SOURCE SCRIPT
LW Structure
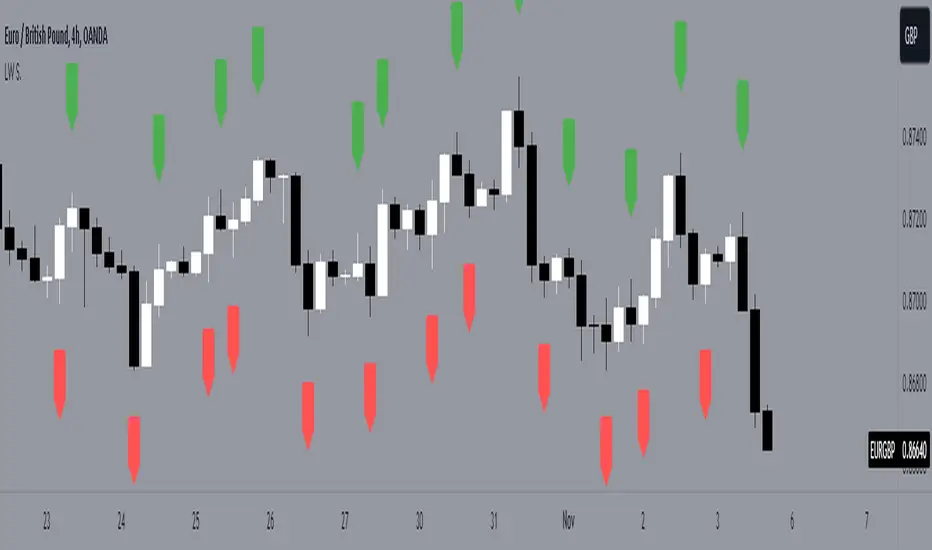
This easy and intuitive tool can be helpful to capture market trends.
This indicator marks the max and the min generated from the price with labels. The green labels are for the max peak and the red label for the min peak. This tool is inspired to the Larry Williams technique to easily catch the trend basing on the decreasing maximums and increasing mininums of the market structure.
Drawing inspiration from the Larry Williams approach, the LW Structure Indicator simplifies the process of recognizing trend patterns through the lens of market structure dynamics.
オープンソーススクリプト
TradingViewの精神に則り、このスクリプトの作者はコードをオープンソースとして公開してくれました。トレーダーが内容を確認・検証できるようにという配慮です。作者に拍手を送りましょう!無料で利用できますが、コードの再公開はハウスルールに従う必要があります。
免責事項
この情報および投稿は、TradingViewが提供または推奨する金融、投資、トレード、その他のアドバイスや推奨を意図するものではなく、それらを構成するものでもありません。詳細は利用規約をご覧ください。
オープンソーススクリプト
TradingViewの精神に則り、このスクリプトの作者はコードをオープンソースとして公開してくれました。トレーダーが内容を確認・検証できるようにという配慮です。作者に拍手を送りましょう!無料で利用できますが、コードの再公開はハウスルールに従う必要があります。
免責事項
この情報および投稿は、TradingViewが提供または推奨する金融、投資、トレード、その他のアドバイスや推奨を意図するものではなく、それらを構成するものでもありません。詳細は利用規約をご覧ください。