OPEN-SOURCE SCRIPT
3-1-3 Pattern

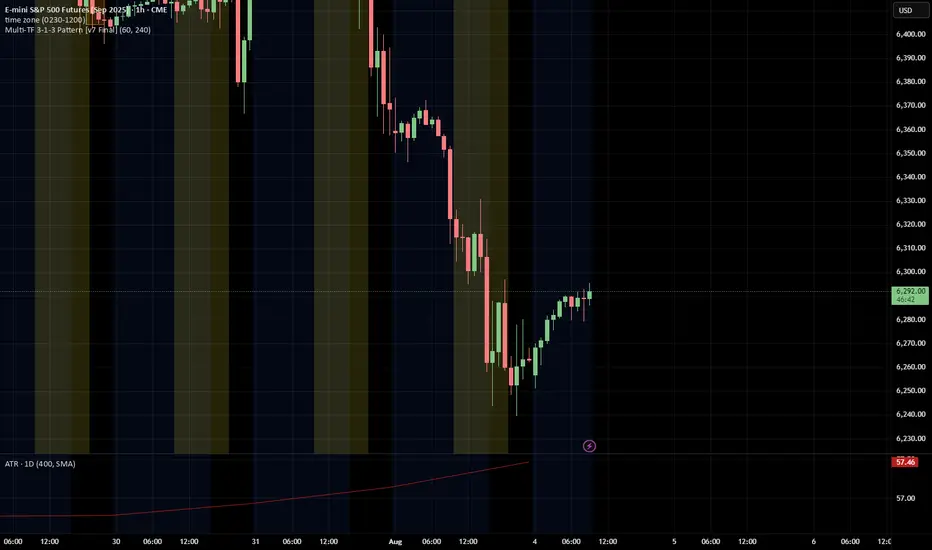
This Pine Script indicator analyzes and visualizes a specific candlestick pattern called the "3-1-3 Pattern" across multiple timeframes. Here's what it does:
Core Functionality
Pattern Detection: The script looks for a 7-bar candlestick pattern:
Bearish 3-1-3: 3 red candles + 1 green candle + 3 red candles
Bullish 3-1-3: 3 green candles + 1 red candle + 3 green candles
Visual Output
When a 3-1-3 pattern is detected, the script:
Creates a colored box around the middle bar (bar 3) of the pattern
Adds a small label showing the pattern type ("Bear 1H" or "Bull 4H", etc.)
Extends the box forward until the price breaks above the pattern's high or below its low
Pattern Management
The script actively manages the patterns by:
Tracking active patterns for each timeframe separately
Removing expired patterns when price breaks the pattern's high/low levels
Extending boxes to the current time to keep them visible
Practical Use
This indicator helps traders:
Spot reversal patterns across multiple timeframes simultaneously
See confluence when patterns align on different timeframes
Track pattern validity (boxes disappear when invalidated by price action)
Essentially, it's a multi-timeframe pattern recognition tool that automatically identifies and tracks these specific 7-bar reversal patterns on your chart.
オープンソーススクリプト
TradingViewの精神に則り、このスクリプトの作者はコードをオープンソースとして公開してくれました。トレーダーが内容を確認・検証できるようにという配慮です。作者に拍手を送りましょう!無料で利用できますが、コードの再公開はハウスルールに従う必要があります。
免責事項
この情報および投稿は、TradingViewが提供または推奨する金融、投資、トレード、その他のアドバイスや推奨を意図するものではなく、それらを構成するものでもありません。詳細は利用規約をご覧ください。
オープンソーススクリプト
TradingViewの精神に則り、このスクリプトの作者はコードをオープンソースとして公開してくれました。トレーダーが内容を確認・検証できるようにという配慮です。作者に拍手を送りましょう!無料で利用できますが、コードの再公開はハウスルールに従う必要があります。
免責事項
この情報および投稿は、TradingViewが提供または推奨する金融、投資、トレード、その他のアドバイスや推奨を意図するものではなく、それらを構成するものでもありません。詳細は利用規約をご覧ください。