OPEN-SOURCE SCRIPT
FED Rate Decisions (Cuts & Hikes)
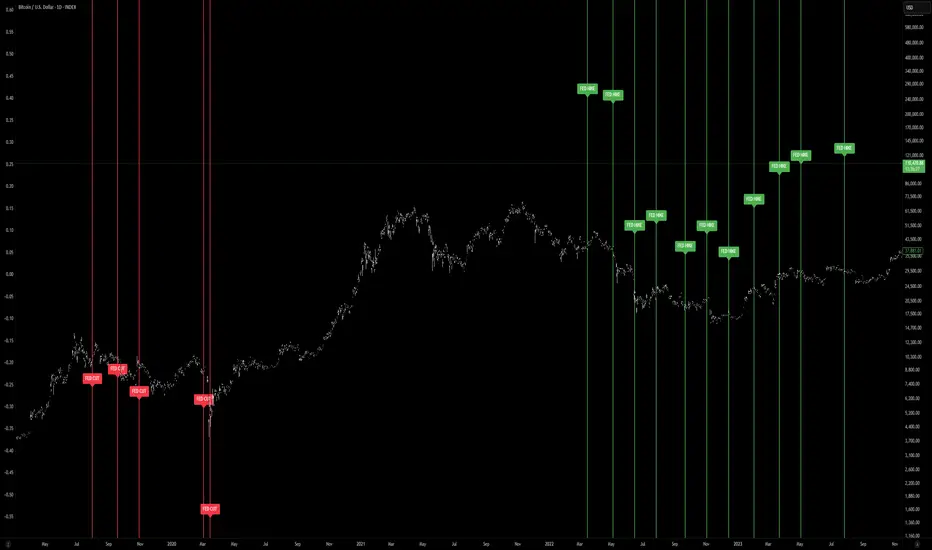
This indicator highlights key moments in U.S. monetary policy by plotting vertical lines on the chart for Federal Reserve interest rate decisions.
Features:
Rate Cuts (red): Marks dates when the Fed reduced interest rates.
Rate Hikes (green): Marks dates when the Fed increased interest rates.
Configurable view: Choose between showing all historical decisions or only those from 2019 onwards.
Labels: Each event is tagged with “FED CUT” or “FED HIKE” above or below the bar (adjustable).
Alerts: You can set TradingView alerts to be notified when the chart reaches a Fed decision day.
🔧 Inputs:
Show decisions: Switch between All or 2019+ events.
Show rate cuts / hikes: Toggle visibility separately.
Colors: Customize line and label colors.
Label position: Place labels above or below the bar.
📈 Usage:
This tool helps traders and investors visualize how Fed policy shifts align with market movements. Rate cuts often signal economic easing, while hikes suggest tightening monetary policy. By overlaying these events on price charts, you can analyze historical reactions and prepare for similar scenarios.
オープンソーススクリプト
TradingViewの精神に則り、このスクリプトの作者はコードをオープンソースとして公開してくれました。トレーダーが内容を確認・検証できるようにという配慮です。作者に拍手を送りましょう!無料で利用できますが、コードの再公開はハウスルールに従う必要があります。
免責事項
この情報および投稿は、TradingViewが提供または推奨する金融、投資、トレード、その他のアドバイスや推奨を意図するものではなく、それらを構成するものでもありません。詳細は利用規約をご覧ください。
オープンソーススクリプト
TradingViewの精神に則り、このスクリプトの作者はコードをオープンソースとして公開してくれました。トレーダーが内容を確認・検証できるようにという配慮です。作者に拍手を送りましょう!無料で利用できますが、コードの再公開はハウスルールに従う必要があります。
免責事項
この情報および投稿は、TradingViewが提供または推奨する金融、投資、トレード、その他のアドバイスや推奨を意図するものではなく、それらを構成するものでもありません。詳細は利用規約をご覧ください。