Customizable Non-Repainting HTF MACD MFI Scalper Bot StrategyThis script was originally shared by Wunderbit as a free open source script for the community to work with.
WHAT THIS SCRIPT DOES:
It is intended for use on an algorithmic bot trading platform but can be used for scalping and manual trading.
This strategy is based on the trend-following momentum indicator . It includes the Money Flow index as an additional point for entry.
HOW IT DOES IT:
It uses a combination of MACD and MFI indicators to create entry signals. Parameters for each indicator have been surfaced for user configurability.
Take profits are fixed, but stop loss uses ATR configuration to minimize losses and close profitably.
HOW IS MY VERSION ORIGINAL:
I started trying to deploy this script myself in my algorithmic trading but ran into some issues which I have tried to address in this version.
Delayed Signals : The script has been refactored to use a time frame drop down. The higher time frame can be run on a faster chart (recommended on one minute chart for fastest signal confirmation and relay to algotrading platform.)
Repainting Issues : All indicators have been recoded to use the security function that checks to see if the current calculation is in realtime, if it is, then it uses the previous bar for calculation. If you are still experiencing repainting issues based on intended (or non intended use), please provide a report with screenshot and explanation so I can try to address.
Filtering : I have added to additional filters an ABOVE EMA Filter and a BELOW RSI Filter (both can be turned on and off)
Customizable Long and Close Messages : This allows someone to use the script for algorithmic trading without having to alter code. It also means you can use one indicator for all of your different alterts required for your bots.
HOW TO USE IT:
It is intended to be used in the 5-30 minute time frames, but you might be able to get a good configuration for higher time frames. I welcome feedback from other users on what they have found.
Find a pair with high volatility (example KUCOIN:ETH3LUSDT ) - I have found it works particularly well with 3L and 3S tokens for crypto. although it the limitation is that confrigurations I have found to work typically have low R/R ratio, but very high win rate and profit factor.
Ideally set one minute chart for bots, but you can use other charts for manual trading. The signal will be delayed by one bar but I have found configurations that still test well.
Select a time frame in configuration for your indicator calculations.
Select the strategy config for time frame. I like to use 5 and 15 minutes for scalping scenarios, but I am interested in hearing back from other community memebers.
Optimize your indicator without filters (trendFilter and RSI Filter)
Use the TrendFilter and RSI Filter to further refine your signals for entry. You will get less entries but you can increase your win ratio.
I will add screenshots and possibly a video provided that it passes community standards.
Limitations: this works rather well for short term, and does some good forward testing but back testing large data sets is a problem when switching from very small time frame to large time frame. For instance, finding a configuration that works on a one minute chart but then changing to a 1 hour chart means you lose some of your intra bar calclulations. There are some new features in pine script which might be able to address, this, but I have not had a chance to work on that issue.
Algorithmictrading

hamster-bot PDD Pump and Dump DetectorPump and Dump detector by hamster-bot
strategy author: foresterufa
Pump and Dump detector (PDD)
This is a trend strategy, with a unique mechanism of multi-stage re-entry into a position (Take Profit-Entry) when a significant trend develops, based on our HiDeep indicator.
Positions are opened by the HiDeep indicator signal with trend direction filtering and volatility filtering. Positions are closed by a HiDeep indicator signal or a change in the trend direction.
The position can be accompanied by a unique Stoploss trailing MA.

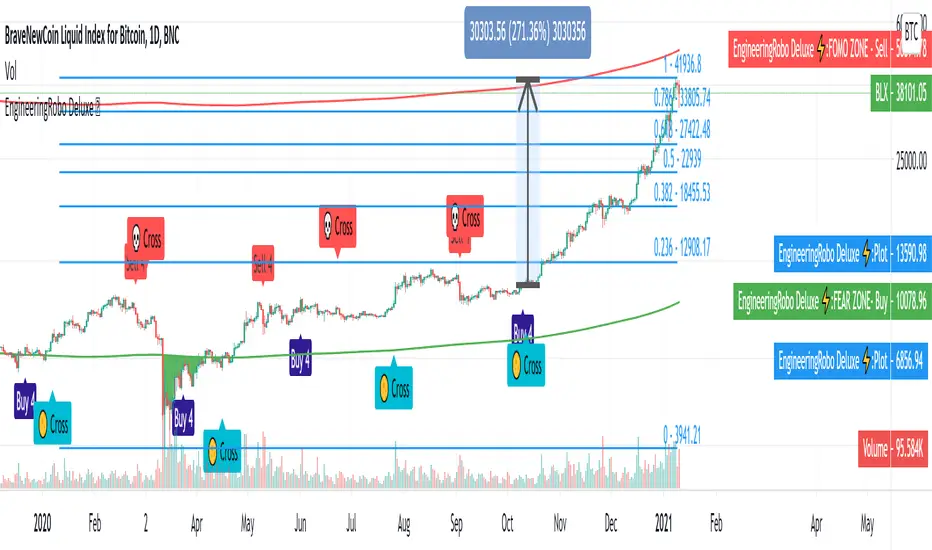
EngineeringRobo DeluxeToday we are releasing the EngineeringRobo Deluxe!
New advanced trading tools for traders and investors. The new Robo 4 is extremely powerful !
It works perfectly with other existing strategies as an add-on feature. EngineeringRobo Deluxe has seen major improvements in accuracy of levels, speed and intelligence to detect the best possible trade setups.
This script is equipped with
🔵 EngineeringRobo 4
It offers strategic trading entry and exit points, so you can preserve capital before markets tumble, and take full advantage as they start to rebound. At a glance, market timing indicators tell investors whether market conditions are right or whether it’s safer on the sideline.
Truly unique tool for technical analysis for the financial market as it includes calculation of specific metrics like SAR + MACD + Price Movement.
You no longer have to worry about spending hours in front of the computer looking for a trade.You can use the indicator on every assets available on your broker.
🔵 Change Candle Color
You can change the colors depending on buy 4 and sell 4 signals. It helps traders a lot to see the direction clearly.
🔵 BB Signals :
This strategy uses the MACD indicator together with the Bollinger Bands to sell when the price is above the upper Bollinger Band (and to buy when this value is below the lower band). This simple strategy only triggers when both the MACD and the Bollinger Band indicators are at the same time in a overbought or oversold condition.
Removed Upper & Lower bands & SMA20 from the charts.
To see bands, You can activate the Bollinger Bands on EngineeringRobo - not the Deluxe version.
If you are buying it with BB BUY, No need to wait for BB Sell to sell it. Vice versa.
They are not the opposite to each other. Get your profit at your target level and move on.
🔵 Ultimate MA crossover signals :
As a general guideline,the idea behind trading crossovers is that a short-term moving average above a long-term moving average is an indicator of upward momentum in a stock & crypto , and the opposite is true about a short-term average trading below a long-term average.
For this guideline to be of use, the moving average should have provided insights into trends and trend changes in the past.
Are the settings of SMA 50 & SMA 200 really the best for Golden Cross and Death Cross?
Have you ever tested ROI for MA cross strategies?
Do you think MA 20 and MA 50 are the best pair for traders?
Do you know that Exponential Moving Average ( EMA ) beats the Simple Moving Average ( SMA ) ?
In order to answer these questions we applied some brute mathematical force and tested 1830 different MA combination to find out the best pair through 50 years of data across stock / forex and 5 years of data across crypto markets . We have done the hard work and you get the benefits .
P.S. The oldest date is 1872 on SPCFD:SPX chart on tradingview . Almost 150 years of backtesting is possible from 1872 to 2020!
🔵 Cloud Signals :
This is a strategy made from ichimoku cloud , together with MACD . Changed Ichimoku cloud formula. Based on that we have a long or a short entry.
it is an effective strategy when paired with a trailing stop loss. Removed standard line ( Kijun Sen ), turning line ( Tenkan Sen ), lagging line ( Chikou Span ) and senkou lines, added buy & sell signals. Traders can use EngineeringRobo's cloud to see the clouds on the chart.
This method doesn't work in sideways markets, only in volatile trending markets.
🔵 EMA TrendLines & Custom Moving Average :
Moving averages help traders isolate the trend in a security or market, or the lack of one, and can also signal when a trend may be reversing. Two of the most common types are simple and exponential. We will look at the differences between these two moving averages, helping traders determine which one to use. Simple moving averages and the more complex exponential moving averages help visualize the trend by smoothing out price movements.
Each trader must decide which MA is better for his or her particular strategy. Many shorter-term traders use EMAs because they want to be alerted as soon as the price is moving the other way. Longer-term traders tend to rely on SMAs since these investors aren't rushing to act and prefer to be less actively engaged in their trades.
🟠50 And 200 Day Moving Average Rules
Trend reversal (downtrend to uptrend) - MA 50 crossover MA 200 from below.
Trend reversal (uptrend to downtrend) - MA 50 crossover MA 200 from above.
Weekly open –close above MA 20 ( bullish trend )
Weekly open –close below MA 50 ( Bearish trend )
Super Bullish : The candle is above MA 20 ( Daily )
Bullish : MA 50 Above MA 100 ( Daily )
Bearish : MA 50 below MA 100 ( Daily )
🔵 Fear & Greed Index
This strategy uses two unique EMA indicators in the formula.
1. Use the indicator to identify when investors are greedy.
2. Use the indicator to identify potential bottom levels
For best testing example:
Open BLX Chart, pick 1D time frame, open only FEAR & Greed Index
🟢Green Area : Ready to buy a lot of cryptocurrencies
🔴Red Area : Ready to sell a lot of cryptocurrencies
Price crosses above red line = Entering overbought zone
Price crosses below red line = Exiting overbought zone
Price crosses below green line = Entering oversold zone
Price crosses above green line = Exiting oversold zone
🔵 Automated Trend Channel Lines
It’s 2020 and you are still drawing lines?
The automated trend lines helps you find the best trend lines and you can stop re-drawing over and over. You don't need to flip back and forth between different timeframes. You can let your robo advisor do the work for you.
🔵 Dynamic Support and Resistance Levels
On the most fundamental level, support and resistance are simple concepts. The price finds a level that it’s unable to break through, with this level acting as a barrier of some sort. In the case of support, price finds a “floor,” while in the case of resistance, it finds a “ceiling.”
Basically, you could think of support as a zone of demand and resistance as a zone of supply.
While more traditionally, support and resistance are indicated as lines, the real-world cases are usually not as precise. Bear in mind; the markets aren’t driven by some physical law that prevents them from breaching a specific level. This is why it may be more beneficial to think of support and resistance as areas. You can think of these areas as ranges on a price chart that will likely drive increased activity from traders.
🔵 Automated Fibonacci Retracements
Automatic Fibonacci let you replace subjective manual analysis with objective automated analysis so you always get the best Fibonacci levels, this can really improve the quality of your trading decisions.
Fibonacci retracements are often used to identify the end of a correction or a counter-trend bounce. Corrections and counter-trend bounces often retrace a portion of the prior move. While short 23.6% retracements do occur, the 38.2-61.8% zone covers the most possibilities (with 50% in the middle). This zone may seem big, but it is just a reversal alert zone. One of the best ways to use the Fibonacci retracement tool is to spot potential support and resistance levels and see if they line up with Fibonacci retracement levels.
Even though Fibonacci levels are extremely popular among technical traders, one should not rely solely on Fibonacci retracement and extension levels in trading. Fibonacci tools return the best results when combined with other technical tools, such as trendlines , chart patterns, candlestick patterns, channels or technical indicators.
If you are following any EngineeringRobo Deluxe signals, you should always wait for the candle close before buying or selling.
The signal can come and go anytime during the live candle. ALL indicators do that, that is not considered repainting.
Repainting is when a signal appears, the candle is closed, and when you refresh the chart it disappeared. It is logical that until the candle is closed the signal is not decided yet, hence the alert setup as Once per bar Close.
Deluxe never repaints! Yes, you heard it right: you will never have to worry about signal changing after the candle is closed.
*** Added alarm system alerts for all signals.
________________________________________________________________________ Timeframes _____________________________________________________________________
Our recommendations to get the best results:
Swing Trading Crypto : Use 1D Time Frame Candles
Swing Trading Stocks : Use 1W Time Frame Candles
Swing Trading Commodities : Use 1W Time Frame Candles
Day Trading Crypto : Use 3H Time Frame Candles
Day Trading Stocks : Use 1D Time Frame Candles
Day Trading Commodities : Use 1D Time Frame Candles
Not recommended any other time frames.
What Is Risk-Reward Ratio RRR?
Your risk-reward ratio is how much you risk per trade, relative to how much you expect to make (reward).
When trading with Robo , you should always aim for a bigger reward compared to your risk per trade.
A good rule is only to risk 1% per trade for day traders and 5% per trade for swing trader . Robo follows strong risk management rules on the algorithm .
One of the biggest advantages of algo trading is removing human emotion from the financial markets,humans trading are susceptible to emotions that lead to irrational decisions. Robo doesn't have to think or feel good to make a trade. If conditions are met, it enters.When the trade goes the wrong way or hits a profit target, It exits. It doesn't get angry at the market or feel invincible after making a few good trades.
EngineeringRobo gives you all the tools and information you need for day-to-day trading and investing, while also keeping a great buy and sell signals! No excuse to lose in any financial market anymore! Try now!
How can you add the algorithm into your chart?
1. Login to TradingView.com
2. From the homepage, click on ‘Chart’ in the top navigation bar
3. Select “Indicators” on the top-center-middle panel
4. In the indicator library, type "EngineeringRobo Deluxe "
5. Use the website link below to obtain access to this indicator
The indicator will be added to your chart after It is approved.
Relativity BEARS FOREX 50X 4H AlgorithmHello, this script is the correction of my old script related to Forex. (Bear market)
Old script :
4H was chosen as the time frame.
Thus, larger pips are at our disposal and we benefit more from the hedge effect of the leverage.
Commissions per trade have been removed to get more realistic commissions.
Because every wrong trade deletes all the 1% position size.
(with leverage effect)
Use the links below to obtain access to this indicator :

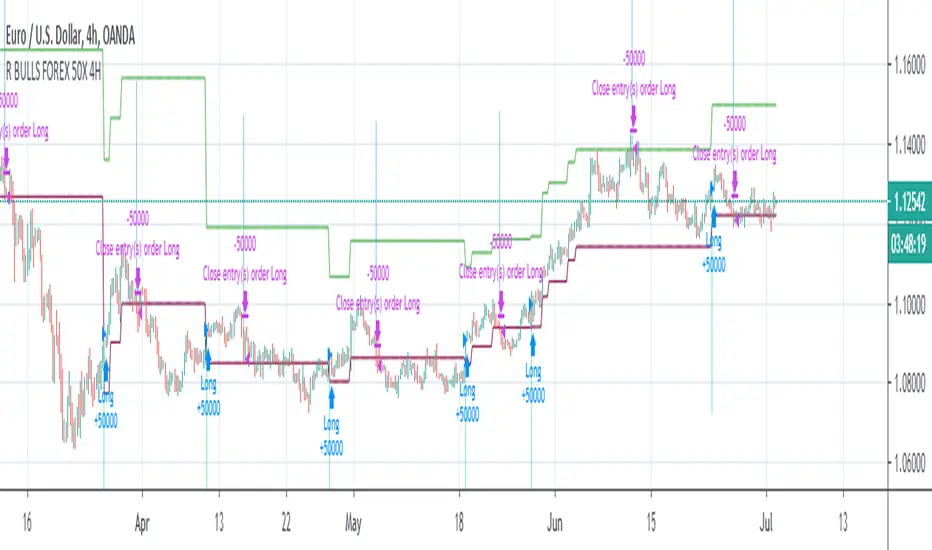
Relativity BULLS FOREX 50X 4H Algorithm
Hello, this script is the correction of my bull script related to Forex. (Bull market)
Old script :
4H was chosen as the time frame.
Thus, larger pips are at our disposal and we benefit more from the hedge effect of the leverage.
Commissions per trade have been removed to get more realistic commissions.
Because every wrong trade deletes all the 1% position size.
(with leverage effect)
Use the link below to obtain access to this indicator :
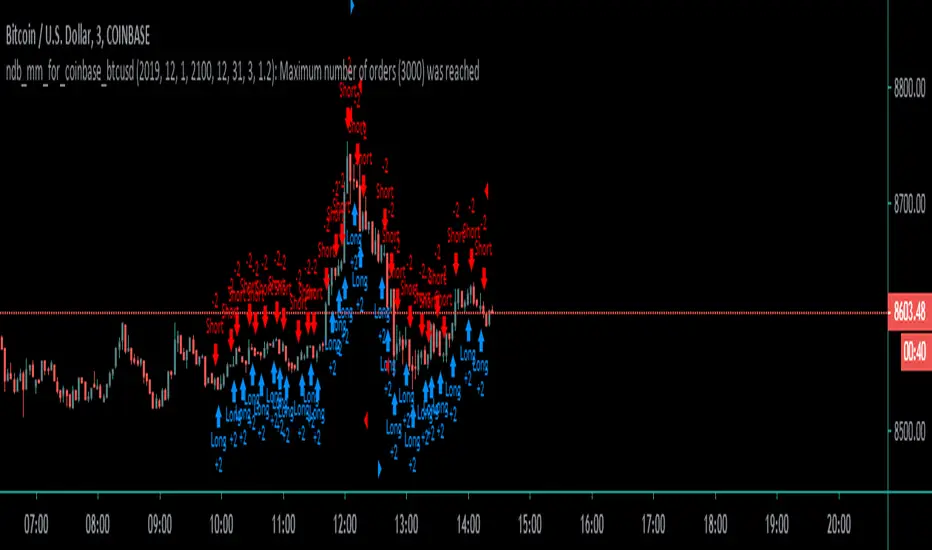
Coinbase_3-MIN_HFT-StrategyThis conceptual strategy trades against the short-term trend. The first position can be either long or short.
In the short-term, prices fluctuate up and down on wide spread exchanges.
And if the price moves to one side, the price tends to return to its original position momentarily.
This strategy set stop order. Stop price is calculated with upper and lower shadows.
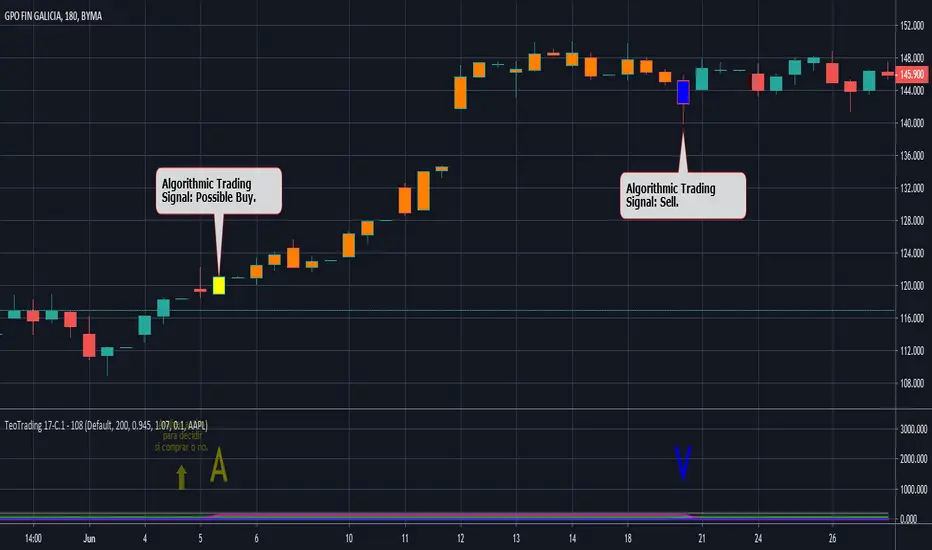
TeoTrading 17-C.1 - 108. Algorithmic Trading Long Signals.This indicator mark patterns that were successful in the past, based on Algorithmic Trading and backtesting.
This Script is for Private Use.
It was designed for Long Signals.
Was developed and tested with Argentinians and Nasdaq stocks.
Includes Real Time Stastistics.
No purchase recommendations are given. The user must do their own analysis to decide whether to buy.
"A" signal is to make the Analysis. Here the user will see a Yellow Candle.
"V" signal is to Sell. Here the user will see:
- A Green Candle: Sell with Gain using a fixed Stop Gain.
- A Blue Candle: Sell with Gain using a dynamic (variable) Stop Gain.
- A Fuchsia Candle: Sell with lost.
The Orange Candle indicates that a trade is open.
The user can filter by differents types of moving averages using input parameters.
Includes Alerts.
TeoTrading 17 - 106. Long Signals based on Algorithmic TradingThis indicator mark patterns that were successful in the past, based on Algorithmic Trading and backtesting.
This Script is for Private Use.
It was designed for Long Signals. Was developed and tested with o group of stocks:
- Argentine Stocks of different sectors: Bank, Energy and Industry.
- Nasdaq technology stocks.
- Petroleum.
Includes Real Time Stastistics.
No purchase recommendations are given. The user must do their own analysis to decide whether to buy.
"A" signal is to make the Analysis. Here the user will see a Yellow Candle.
"V" signal is to Sell. Here the user will see:
- A Green Candle: Sell with Gain using a fixed Stop Gain.
- A Blue Candle: Sell with Gain using a dynamic (variable) Stop Gain.
- A Fuchsia Candle: Sell with lost.
The Orange Candle indicates that a trade is open.
Includes Alerts.
Enabled users will obtain a complete manual.

THE QUANTUM TRADER BITCOINThe Quantum Trader is a Algorithmic Automated Trading System that trades XBTUSD and BTC/USD with an emphasis on minimizing risk.
This algorithm trades multiple of our individual algorithms in an attempt to have a large number of uncorrelated algorithms trading concurrently,
thereby smoothing out the equity curve in an attempt to provide more consistency in the returns.
The Quantum trader utilizes swing trading algorithms along with day trading algorithms which can enter positions either Long or Short, and
take profits either Long or Short depending on market characteristics.
The Quantum Trader was built for automated trading, but can be used for manual trading also.
The Quantum Trader was designed to be used with Heikin Ashi candles on 3H chart. Indicator uses security function for profit points so alerts will give a warning
however, gaps are OFF and Lookahead is ON and trades are entered, and profits are taken at candle close.
Trades are placed following a strict algorithm, and nothing is left to subjective opinion.
The Quantum Trader utilizes a sophisticated pattern recognition algorithms that have been rigorously tested, and has been traded live since March 2019
When compared to other algorithmic trading systems, the quantum trader places fewer trades which helps contribute to the smaller draw down seen in the back-testing.
Algorithmic Trading Strategy Compared to Paid Signal Groups and Online Trading Classes
While there is an appeal to paid signal groups, and online trading classes. Most of the trading tips and signals you find online are sadly too basic and lacking an analytical approach to defend the statements which are made.
Comments are made and repeated that simply don’t have any empirical evidence to back them up.
In algorithmic trading back-testing and monthly system overviews is (or should be) part of the design methodology, the strategy will be analyzed for multiple time periods to include bull and bear markets.
We test and trade our algorithms across multiple market cycles to include Bear and Bull markets.
With Algorithmic Trading, nothing is left to interpretation. The algo will place trades as it sees fit and will attempt to generate positive returns as trades are methodically placed on individuals accounts.
There is no staring at charts, no drawing of trend lines , no signals to take and all the negative emotions involved with trading are minimized.
Lastly, the potential for human errors is minimized since trades are placed automatically by the Automated Trading System as opposed to signals learned in an online trading course or signals received.
