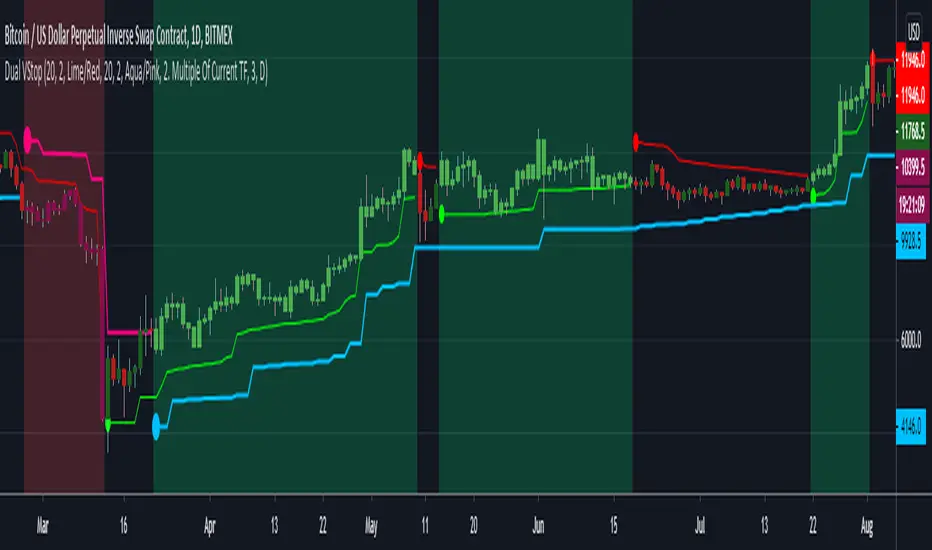
Dual Volatility StopThis merges Volatility Stop & its MTF version both published by u/TradingView . Background is colored green or red when both the current timeframe Vstop and higher timeframe Vstop point in same direction. Aim is to take the standard Vstop script which differentiates market from only uptrend/downtrend to uptrend/downtrend/sideways. There is a tradeoff with this, that there is no need for the Vstop to be always in a position which reduces trade time & frees up capital. However this leads to situations where it takes slightly more time to catch on to a trend after a reversal.
Green Background = Buy
Red Background = Sell
No Background = Flat
ATR
Average True Range %This is a modification to the Built-In Average True Range Indicator that uses the last close to calculate the range as a percentage.

ATR Daily LevelsPlots the daily ATR on the chart as upper and lower levels.
It can be use to adapt your trading in high and low periods of market volatility, determine reasonable target or take profit, entry at likely mean reversion, stop loss beyond normal flows etc...
More on the script behavior:
- Daily ATR upper/lower levels are applied on the current day low/high;
- The ATR value is defined by the last D1 bar;
- Shows up to D1 timeframe;
- Configuration for the indicator's period (default: 20 period ATR);
- Configuration for plotting the indicator on the the x axis with an offset/at begining of the day (default: offset);

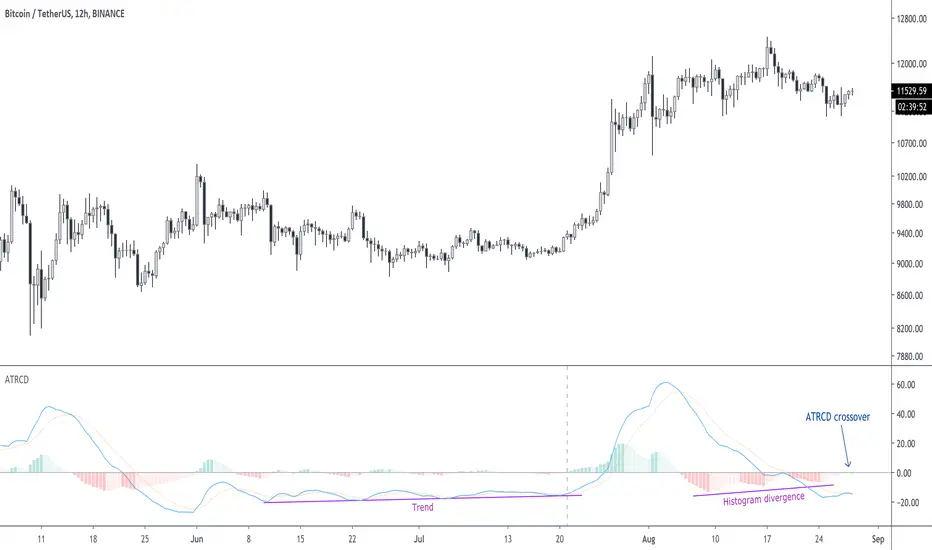
ATRCD, Average True Range Convergence DivergenceATRCD calculates a MACD over the Average True Range, therefore helping traders to spot momentum in volatility.
The Average True Range is a measurement of the average candle size over a period of time, i.e. when the candles are small, the ATR is low. ATR measures volatility .
The MACD is a momentum indicator. It measures market momentum based on the average closing prices over a period.
Therefore, using the MACD calculation over the ATR we get a measurement of momentum in volatility . The ATRCD is a concept at this point. I was curious to see whether such an indicator could provide any edge trading the markets. Because this is a MACD of the ATR the same concepts can be applied, e.g. spotting divergences, momentum trends, etc. Please be careful however, this indicator only looks like the MACD but it measures volatility and not price momentum . Maybe this can help traders confirm breakouts using price action?
Applying this indicator to the 12h of BTC/USDT we can see that we could be nearing a volatility expansion with a divergence on the histogram, and an ATRCD crossover.
BINANCE:BTCUSDT
AITI Investa: Trend FollowingScript ini dibuat untuk membantu strategi trend following harian pada saham-saham di IHSG.
Terdiri dari:
1. Petunjuk visual untuk area trend yang sebaiknya dihindari ( bearish trend ), berupa background berwarna merah. Dimana area bearish trend adalah ketika garis fast ema berada di bawah garis slow ema .
2. Batas stop loss / trailing stop, dengan acuan nilai ATR.
Script ini tidak memberikan sinyal buy. Silakan gunakan strategi buy on weakness/breakout sesuai analisa dan preferensi masing-masing. Untuk mencari entry trigger, penulis merekomendasikan untuk menarik garis support/resistance manual dan digabungkan dengan indikator MACD & CCI sebagai konfirmasi.
-AITI Investa

ATR with Impulse AlertsThis is a very simple script which simply plots an ATR (the built-in ATR function, using RMA) and plots a cross when the previously closed bar is larger than the ATR by a given threshold. There are also alert conditions set so you can be alerted when these impulse bars show up, either up or down bars. Have fun and safe trading!

Triple ATR multiplier - 3 ATR Values in OneHere you can choose to plot 3 different ATR values in 1 window. I use this indicator to get the values of my stop loss and take profits.
You can change the multiplier value for each ATR Line and the length of the base ATR.
Ty

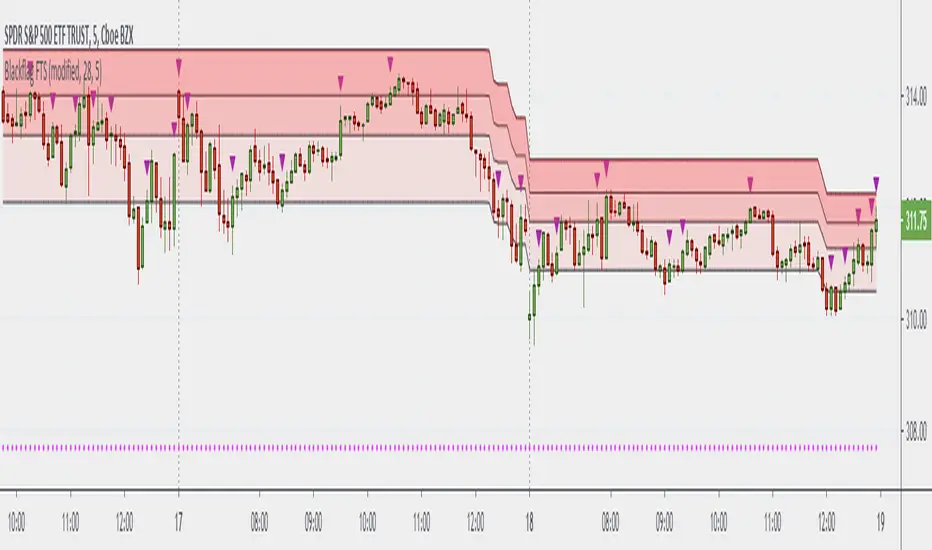
Efficient Support & Resistance LevelsThis script is a mixture of my two previous scripts "True Strong Classical Support/Resistance Levels" and "Hidden Supports & Resistances + Round Levels". This combination brings on better identification of the most efficient support/resistance levels.
Note that "Hidden SnR Levels" part of the code is only expected to work on Forex charts, but apart from that, the other parts could be applied to any chart.
The script may:
- Draw classical support/resistance levels which retraced the price previously, aided by multi-timeframe analysis
- Draw hidden support/resistance levels based on psychological patterns of the price
- Adjust to wicks better than Pine Script built-in pivot functions
- Differ the levels color based on chart reactions
- Merge nearby classical levels to avoid congestion on the chart
Feel free to use it and send me your thoughts.

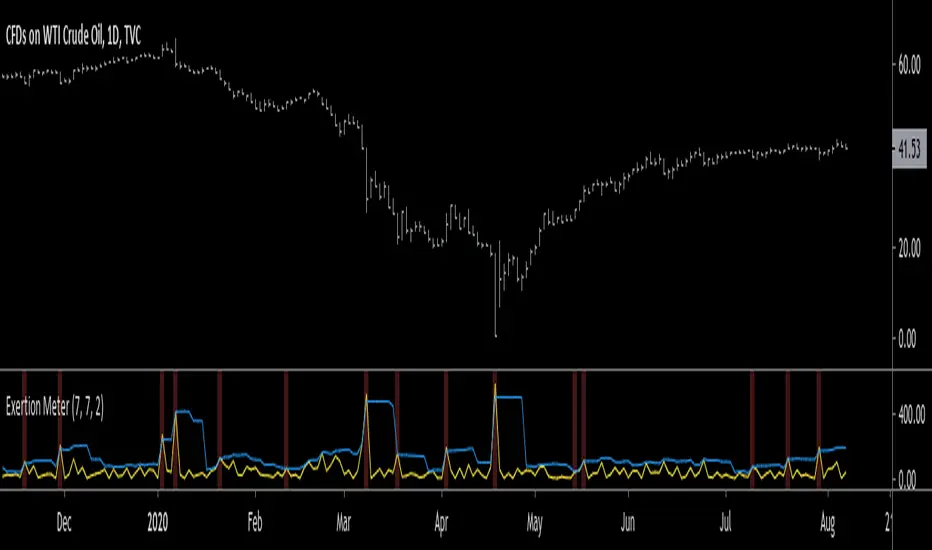
Exertion MeterHello traders, today I wanted to present you something special. I present you the Exertion Meter!
Created from scratch, this idea is based on a theory of mine called "Exertion".
Exertion occurs when price moves beyond the previous bar's range thus it has "exerted itself".
The idea is that when price moves a lot, it exerts a lot of energy which eventually leads to calmer motion, usually in the direction price has exerted itself.
Now, when price has exerted itself a lot in a particular direction, it's telling you that it will likely continue in that direction.
Once this happens, it will gradually calm down until price begins the cycle again, exerting itself in either the same or opposite direction.
This theory is similar to the theory of expansion & contraction phases.
This indicator attempts to show you where price has exerted itself by giving you a two lines cross signal.
The default settings are recommended, but experimentation is encouraged to fit your own personal system.
Both settings control the standard deviation line ( aka . Upper Bollinger Band ).
Enjoy, and hit the follow button to get easy access to all my indicators and to follow my latest publications!
Up/Down Trend MarkerA simple indicator of trend by using 3 EMAs of multiplies of 2, 5 and 10, filtered by standard positive/negative directional movements (DM) which are the base of Average Directional Index (ADX).
The "Trend Strength" option is included to set the EMA multipliers and also the variation between DM+ and DM- which interpret the trend as a weak or a strong one.
Note that the markers only point to almost the beginning of the trends and just change the direction when the opposite trend is detected.
Feel free to send me your opinions.

ATR Vol Proxy CrossThis script is a simple ATR cross, where the short-term ATR helps quickly and easily determine whether volatility is "high" or "low" compared to the long-term ATR value. Both values are adjustable, but initially calibrated for the daily chart.

ATR COG (Joy Bangla)Notes:
Black crosses indicate squeeze. It means an impending move once squeeze is released
Price tends to go from red dot to green dot to red dot to green dot to red dot in an endless cycle. We wait for the price bar to not touch the dots before we make a move
If the price goes between the dots and the lines, it means it is likely overheated/oversold respectively
If the price moves above the top line, it means the market is super overbought
If the price moves below the bottom line, it means the market is super oversold
This is an updated version 4 script from Lazy Bear's code as found from here
The update is there to ensure we can have alerts successfully set on Trading View

[CP]ATR Triple Stop Loss LevelsATR based Triple Stop Loss levels that are plotted on the chart (like moving averages!).
With ATR Levels plotted on the price chart itself, you can better set your volatility based trailing Stop Loss.
Also helps to define the SL when making an entry into a stock.
Note:
This indicator is supposed to be used on Daily and Weekly Charts.
For other timeframes you would need to tweek the default parameters.

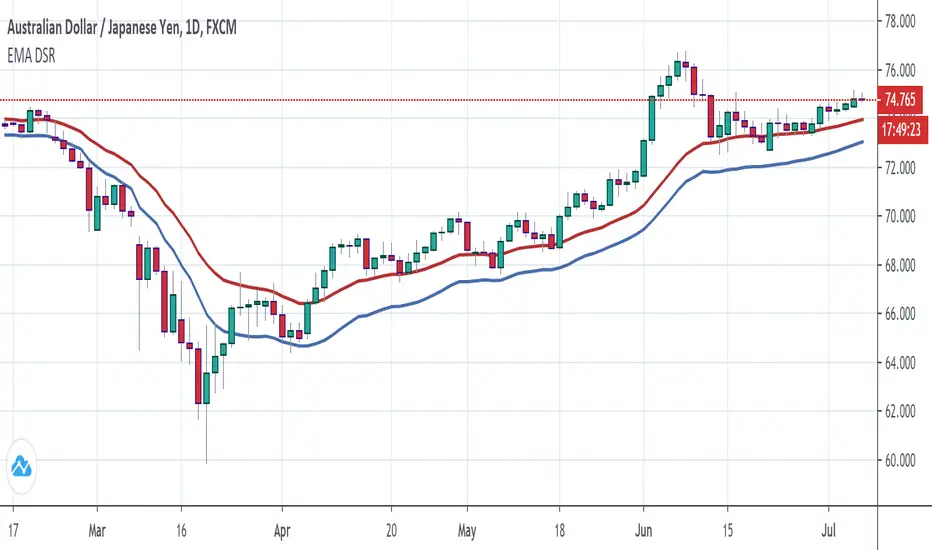
Trends & RangesTrends & Ranges uses EMA ATR bands as a SuperTrend indicator.
How to use:
This indicator can be used to give you a direction bias, with the added function to create ranges which often lead to reversals or flat trading periods. Trade the break-out or wait for pull backs in the direction of the trend.
I'm not great at explaining stuff and will probably make things only more complicated, so I won't bother for now,
but if you have a question on how the script works I will gladly give it a try.
The option "Flexible Trends" will disable the min/max function (trailing or non trailing).
Flexible Trends enabled:
Flexible Trends disabled:
Settings are not optimized for any asset or time frame, you will have to do that for yourself. Feel free to share them in the comments.
Thanks for showing interest, enjoy and good luck! :)

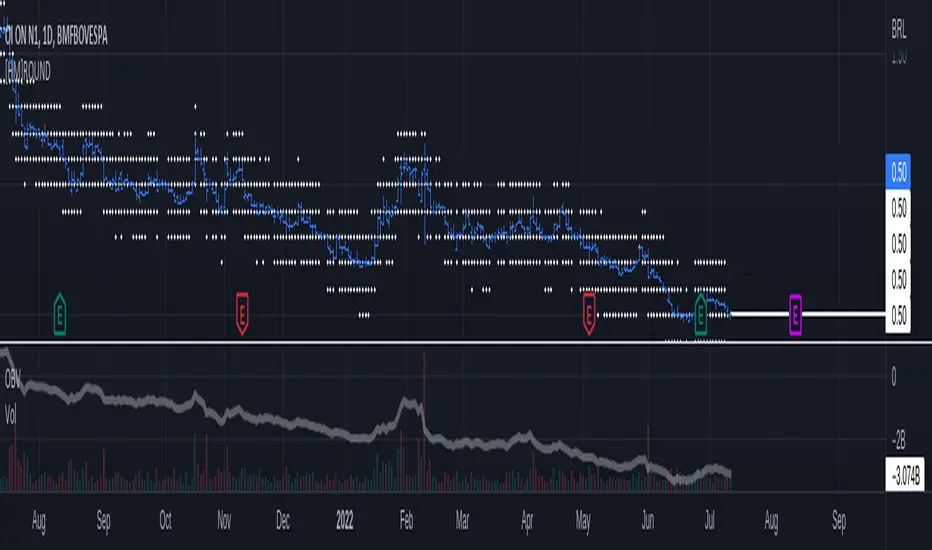
[HM] HORIZONTAL GRID ROUNDED (VOLATILITY BASED)The purpose of this indicator is to draw a horizontal grid having in mind:
- rounded price levels instead tradingview standard grid, zoom-based;
- calculated by volatility, using daily ATR;
- independent of timeframe in use, locked to DAILY calculations.
Further improvements are intended.
Wish this could be useful. Any questions, feel free to comment.
Trending True RangeDisplay a smoothed true range during trending markets, thus filtering any measurement occurring during ranging markets. Whether the market is trending or ranging is determined by the position of the efficiency ratio relative to its Wilder moving average.
Settings
Resolution : resolution of the indicator
Length : period of the efficiency ratio and the Wilder moving averages used in the script
Usage
If you are not interested in volatility during ranging markets, this indicator might result useful to you. An interesting aspect is that it both measures volatility, but also determine whether the market is trending or ranging, with a zero value indicating a ranging market.
Indicator against Atr, with both length = 14, our indicator might be easier to interpret.
Note
Thx to my twitter followers for their suggestions regarding this indicator. I apologize if it's a bit short, the original code was longer and included more options, but forcing a script to be lengthy is a really bad idea, so I stayed with something less flashy but certainly more practical, "classic Grover" some might say.
Thx for reading!
ATR Take Profit bandsSimple ATR-scaled levels or bands of suggested price to take profit on directional trades.

SwingArm ATR Trend IndicatorThe general idea of using SwingArms is to provide a visual confirmation of a trend change.
Green for bullish (BUY)
Red for bearish (SELL)
A color-coded system providing an easy way for a novice to understand.
Converted to TradingView based on the work of Jose Azcarate.
I hope you guys enjoy.
Trailing Stop LossTrailing stop loss indicator to determine when to exit a position.
Multiple trailing stop loss calculation techniques are implemented:
ATR: Determines stop loss using a gap from recent highest value, that gap is defined by the ATR value and a multiplier
MA: Just a simple moving average used as a stop-loss
Percentage: Uses a percentage of the price
The script also implements alerting to be notified when the stop loss price is reached.

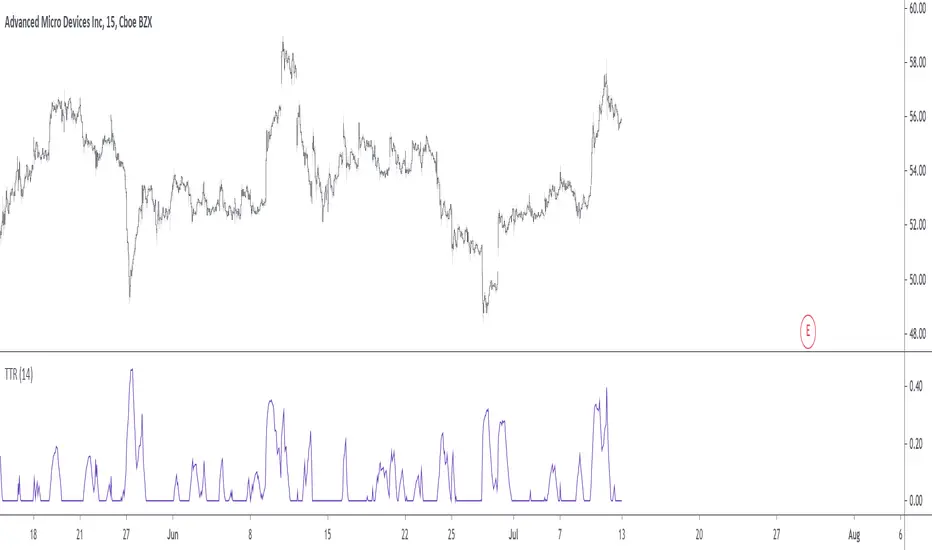
HG Scalpius - ATR Up/Down Tick HighlightHG Scalpius - ATR Up/Down Tick Highlight
This indicator highlights ATR(14) upticks (green) and downticks (red) and has the below application:
- If a new trend closing high (low) is made on a downtick in ATR, decreasing volatility mode turns on
If you come across or think of any other useful scripts for the HG Scalpius system please comment below!
Links to 2 previous HG Scalpius scripts:
-
-
Happy trading!
Code:
study(title="Average True Range", shorttitle="ATR", overlay=false)
length = input(title="Length", defval=14, minval=1)
smoothing = input(title="Smoothing", defval="RMA", options= )
ma_function(source, length) =>
if smoothing == "RMA"
rma(source, length)
else
if smoothing == "SMA"
sma(source, length)
else
if smoothing == "EMA"
ema(source, length)
else
wma(source, length)
ATR = ma_function(tr(true), length)
c = ATR >= ATR ? color.lime : color.red
plot(ATR, title = "ATR", color=c, transp=0)

cATRpillerThis indicator is used to identify range breakouts using an ATR multiplier. My first script, Im sure there are indies out there like this, but this my favorite way to identify breakouts and trends.

ATR Percent of PriceShows:
1. The current True Range, taken as ATR(1) as % of the close price
2. The SMA(14) of the current True Range, taken as ATR(1) as % of the close price
