Swing Data - SimplifiedThe swing data indicator by jfsrev but simplified. Thank you jfsrev for your work!
ATR
CyberTradingV1.4 TRexCyberTradingV1.3 — Multi-TF Volatility/Structure + FVG Suite (by College Pips)
TL;DR
One utility to read volatility regime (ATR vs TH), map market structure & swings, and track FVG/CE imbalances—so you can gauge range, context and entries in one place. No signals or promises; it’s a contextual toolkit.
What it does
Volatility table (multi-TF): Shows ATR-style and TH proxies across 1m → Monthly, so you can compare current TF vs higher TFs.
Composite levels: LQC / GAM / Trigger / TRex quantify “how much is enough” for legs/impulses relative to the active TF.
Structure & swings: Validated swing highs/lows with optional time-anchored rectangles (height sized by LQC) and auto structure/diagonal lines.
Imbalances (FVG): Auto-detect UP/DOWN FVGs, extend forward, optional CE line; alerts fire on touches/entries/fills.
Candle sizing: Directional color map by fixed ATR-ratio buckets; Inside Bars are force-colored for clarity.
How components work together (mashup rationale)
Read regime with the table (ATR vs TH per TF).
Map structure with swings/lines to see HH/HL/LH/LL context.
Focus imbalances with FVG + optional CE; monitor with alerts.
Act with thresholds using LQC/GAM/Trigger/TRex to standardize expectations across symbols/TFs.
Method transparency
ATR/TH math: ATR is a smoothed multi-window blend; TH scales the daily range to TF via √time.
Composites: LQC ≈ √(ATR×TH) × C(TF); GAM2/3/4 and Trigger/TRex apply TF-specific scalars to min/max aggregates (see source for exact coefficients).
Multi-TF: Values come from request.security and finalize on higher-TF bar close (no look-ahead).
Swings: Confirmed using left/right strengths; labels are offset back to the pivot bar.
FVG/CE: Classic 3-bar definition; CE is the midpoint line. Boxes extend until touched/filled; optional auto-delete on fill.
Usage
Enable the table to gauge expansion/contraction.
Turn on swing rectangles for LQC-sized reaction zones.
Toggle FVG + CE on your execution TF; use alerts to catch re-entries/resolutions.
Combine with price action and your own trade plan.
Limitations & fair warnings (be honest)
Offsets/past plotting: Swing labels and rectangles are anchored to past bars (offset = -right_strength). They do not predict future bars.
Repainting notes: Swings confirm after right_strength bars; higher-TF values finalize on their close. Past markings can update as confirmations occur.
Tick handling: Uses syminfo.mintick (special cases for JPY/XAU/XAG). Validate on exotic symbols.
No promises: This is a context tool, not a buy/sell signal generator.
Alerts included
ABOVE/BELOW threshold: Price crossing CE or FVG bounds.
IOFED up/down: Price entering an FVG from above/below.
Inputs (high-level)
Layout/positioning, color palettes, swing rectangle styling (width/fill/border), detection strengths, label/line widths, FVG lookback, CE on/off & style, auto-delete filled boxes.
Credits & reuse
Concepts like FVG/CE are widely known in market-microstructure education.
This implementation—table architecture, LQC/GAM/Trigger framework, swing rectangles, candle bucketing, and alert logic—is original to College Pips / CyberTradingV1.4

Advanced Chandelier Exit with S/R [Alpha Extract]Advanced Chandelier Exit with S/R is a precision-crafted trailing stop and market structure detection system that fuses advanced Chandelier Exit logic with intelligent, multi-timeframe support and resistance tracking. This indicator delivers adaptive trend detection, volatility-aware exit positioning, and real-time structural mapping in a clean, responsive format. By combining directional filtering, pivot zone detection, and customizable styling, Advanced Chandelier Exit with S/R is designed to give traders reliable context, strong risk management, and visually intuitive confirmation signals across all timeframes and asset classes.
🔶 Adaptive Trailing Stop Architecture
At the core of Advanced Chandelier Exit with S/R is a refined Chandelier Exit mechanism that dynamically calculates trailing stops based on recent highs and lows, ATR volatility, and trend sensitivity. The system features directional memory, anchoring the stop to maintain position until a confirmed trend break occurs. This method prevents premature flips and keeps the trade aligned with sustained momentum.
longStop := close > longStop ? math.max(longStop, longStop ) : longStop
shortStop := close < shortStop ? math.min(shortStop, shortStop ) : shortStop
🔶 Volatility-Weighted Filtering
To reduce noise and improve reaction quality, Advanced Chandelier Exit with S/R includes an optional volatility normalization filter. This system adjusts ATR output based on how elevated it is relative to its own average, effectively down-weighting erratic price moves while maintaining responsiveness in directional phases.
volatilityFilter = enableVolatilityFilter ? ta.sma(baseATR, length) / baseATR : 1.0
atr = mult * baseATR * sensitivity * volatilityFilter
🔶 Trend Strength-Aware State Transitions
Trend flips in Advanced Chandelier Exit with S/R are not based solely on price crossing the stop level. Instead, the system includes a momentum-derived trend strength filter that validates the legitimacy of directional shifts. This guards against weak reversals and gives stronger confidence in breakout moves.
priceChange = math.abs(close - close )
avgPriceChange = ta.sma(priceChange, length)
trendStrength = math.min(priceChange / avgPriceChange * 100, 200)
🔶 Multi-Timeframe Support & Resistance Zones
Advanced Chandelier Exit with S/R embeds a sophisticated pivot-based structure mapping engine that automatically identifies significant price reaction levels and tracks their validity over time. It filters redundant zones, removes invalidated levels, and renders real-time support and resistance overlays based on market structure.
if isUniqueLevel(ph, resistanceLevels)
array.unshift(resistanceLevels, ph)
if isUniqueLevel(pl, supportLevels)
array.unshift(supportLevels, pl)
🔶 Dynamic Visual Encoding
The indicator uses strength-scaled fills, customizable colors, and line styling to convey directional bias with clarity. Color opacity intensifies as trend strength increases, offering intuitive context at a glance. Dynamic background fills mark trend states, while S/R zones are rendered with user-defined transparency for clean integration.
🔶 Signal Detection and Alerts
Directional signals are generated upon confirmed flips between long and short regimes, validated by stop crosses and strength filters. Additionally, the indicator provides S/R breakout alerts, identifying when price breaks through a key structural level.
🔶 Performance and Customization Optimizations
Advanced Chandelier Exit with S/R is built with modularity and efficiency in mind. It supports full customization of stop logic, volatility sensitivity, structural lookback, S/R zone filtering, and visual display. The use of array-based data structures for S/R levels ensures consistent performance even across high-activity assets and longer lookback periods.
Advanced Chandelier Exit with S/R represents the next evolution in trailing stop and structure-aware trading tools. By blending the proven logic of the Chandelier Exit system with intelligent trend strength filters and robust S/R detection, it becomes more than just a stop indicator—it becomes a complete trade management companion. Traders benefit from fewer false flips, clearer directional bias, and precise structural overlays that reinforce both breakout and reversal strategies. Whether used for swing entries, intraday positioning, or zone-based re-entries, Advanced Chandelier Exit with S/R empowers traders with responsive, intelligent logic that adapts to market conditions without compromise.

1m Scalping ATR (with SL & Zones)A universal ATR indicator that anchors volatility to your stop-loss.
Read any market (FX, JPY pairs, Gold/Silver, indices, crypto) consistently—regardless of pip/point conventions and timeframe.
Why this indicator?
Classic ATR is absolute (pips/points) and feels different across markets/TFs. ATR Takeoff normalizes ATR to your stop-loss in pips and highlights clear zones for “quiet / ideal / too volatile,” so you instantly know if a 10-pip SL fits current conditions.
Key features
Auto pip detection (FX, JPY, XAU/XAG, indices, BTC/ETH).
Selectable ATR source: chart timeframe or fixed ATR TF (e.g., “15”, “30”, “60”).
Display modes:
Percent of SL – ATR relative to SL in %, great for M1 (typical 10–30%).
Multiple of SL – ATR as a multiple of SL (e.g., 0.6× / 1.0× / 1.2×).
Panel zones:
Green = “Ready for takeoff” (≤ Low), Yellow = reference (Mid), Red = too volatile (≥ High).
Status badge (top-right): Quiet / ATR ok / Wild, current ATR/SL value, ATR TF used.
Direction-agnostic: Works the same for longs and shorts.
Inputs (at a glance)
Length / Smoothing (RMA/SMA/EMA/WMA): ATR base settings.
Your Stop-Loss (Pips): Reference SL (e.g., 10).
ATR Timeframe (empty = chart): Use chart TF or a fixed TF.
Display Mode: “Percent of SL” or “Multiple of SL.”
Low/Mid/High (Percent Mode): Zone thresholds in % of SL.
Low/Mid/High (Multiple Mode): Zone thresholds in ×SL.
Recommended defaults
Length 14, Smoothing RMA, SL 10 pips
Display Mode: Percent of SL
Low/Mid/High (%): 15 / 20 / 25
ATR Timeframe: empty (= chart) for reactive, or “30” for smoother M30 context with M1 entries.
How to use
Set SL (pips). 2) Choose display mode. 3) Optionally pick ATR TF.
Interpretation:
≤ Low (green): setups allowed.
≈ Mid (yellow): neutral reference.
≥ High (red): too volatile → adjust SL/size or wait.
Note: Auto-pip relies on common ticker naming; verify on exotic symbols.
Disclaimer: For research/education. Not financial advice.

Risk Recommender — (Heatmap)📊 Risk Recommender — Per-Trade & Annualized (Heatmap Columns)
Estimate the optimal risk percentage for any market regime.
This tool dynamically recommends how much of your account equity to risk — either per trade or at a portfolio (annualized) level — using volatility as the guide.
⚙️ How it works
Two distinct modes give you flexibility:
1️⃣ Per-Trade (ATR-based)
• Calculates the current Average True Range (ATR) compared to its long-term baseline.
• When volatility is high (ATR ↑), risk per trade decreases to maintain constant dollar risk.
• When volatility is low (ATR ↓), risk per trade increases within your defined floor and ceiling.
• The display is normalized by stop distance (× ATR) and smoothed to avoid noise.
2️⃣ Annualized (Volatility Targeting)
• Computes realized volatility (standard deviation of log returns) and an EWMA forecast of future volatility.
• Blends current and forecast volatilities to estimate “effective” volatility.
• Scales your base risk so that portfolio volatility converges toward your chosen annual target (e.g., 20%).
• Useful for portfolio-level or systematic strategies that maintain constant volatility exposure.
🎨 Heatmap Visualization
The vertical column graph acts like a thermometer:
• 🟥 Red → “Reduce risk” (volatility high).
• 🟩 Green → “Increase risk” (volatility low).
• Smoothed and bounded between your Floor and Ceiling risk levels.
• Optional dotted guides mark those bounds.
• Label shows the current mode, recommended risk %, and key metrics (ATR ratio or effective volatility).
🔧 Key Inputs
• Base max risk per trade (%) — your normal per-trade risk budget.
• ATR length / Baseline ATR length — control sensitivity to short- vs. long-term volatility.
• Target annualized volatility (%) — portfolio volatility target for quant mode.
• λ (lambda) — smoothing factor for the EWMA volatility forecast (0.90–0.99 typical).
• Floor & Ceiling — clamps the output to avoid extreme sizing.
• Smoothing & Hysteresis — prevent rapid changes in risk recommendations.
🧮 Interpreting the Output
• “Recommended Risk (%)” = suggested portion of equity to risk on the next trade (or current exposure).
• In Per-Trade mode: reflects current ATR ÷ baseline ATR .
• In Annualized mode: reflects target volatility ÷ effective volatility .
• Use the color and height of the column as a quick visual cue for aggressiveness.
💡 Typical Use Cases
• Position-sizing overlay for discretionary traders.
• Volatility-targeting component for algorithmic or multi-asset systems.
• Educational tool to understand how volatility governs prudent risk management.
📘 Notes
• This indicator provides risk suggestions only ; it does not place trades.
• Works on any symbol or timeframe.
• Combine with your own strategy or alerts for full automation.
• All calculations use built-in Pine functions; no proprietary logic.
Tags:
#RiskManagement #ATR #Volatility #Quant #PositionSizing #SystematicTrading #AlgorithmicTrading #Portfolio #TradingStrategy #Heatmap #EWMA #Risk

Market Pressure Differential (MPD) [SharpStrat]Market Pressure Differential (MPD)
Concept & Purpose
The Market Pressure Differential (MPD) is a proprietary indicator designed to measure the internal balance of buying and selling pressure directly on the price chart.
Unlike standard momentum or trend indicators, MPD analyzes the structural behavior of each candle—its body, wicks, and overall range—to determine whether the market is dominated by expansion (buying aggression) or contraction (selling absorption).
This indicator provides a visual overlay of market pressure that adapts dynamically to volatility, helping traders see real-time shifts in participation intensity without using oscillators.
In simple terms:
When MPD expands upward → buyer pressure dominates.
When MPD contracts downward → seller pressure dominates.
Calculation Overview
MPD uses a structural candle formula to compute directional pressure:
Body Ratio = (Close − Open) / (High − Low)
Wick Differential = (Lower Wick − Upper Wick) / (High − Low)
Raw Pressure = (Body Ratio × Body Weight) + (Wick Differential × Wick Weight)
Then it applies:
EMA smoothing (to stabilize short-term noise)
Standard deviation normalization (to maintain consistent scaling)
ATR projection (to adapt the signal visually to volatility)
This produces the MPD projection line and the pressure ribbon, drawn directly on the main chart.
Customizable Inputs
Users can adjust color schemes, EMA smoothing length, ATR parameters, normalization length, and body/wick weighting to adapt the indicator’s sensitivity and aesthetic to different markets or chart themes.
How to Use
The Market Pressure Differential (MPD) visualizes the real-time balance between buying and selling pressure. It should be used as a contextual bias tool, not a standalone signal generator.
The white line represents the MPD projection, showing how market pressure evolves in real time based on candle structure and volatility.
The red line represents the ATR envelope, which defines the market’s expected volatility range.
MPD reacts quickly to candle structure, so trend bias is based on how its projection behaves relative to the ATR envelope:
Above the ATR band → positive pressure and bullish bias.
Below the ATR band → negative pressure and bearish bias.
Hovering near the ATR band → neutral or indecisive conditions.
The MPD percentage in the label represents the normalized strength of pressure relative to recent volatility.
Positive % = buying dominance.
Negative % = selling dominance.
Higher absolute values = stronger momentum compared to volatility.
To trade with MPD:
Watch candle colors and the projection line — green or positive % shows buyer control, red or negative % shows seller control.
Note transitions above or below the ATR level for early signs of momentum shifts.
Combine MPD signals with price structure, key levels, or volume for confirmation.
This helps reveal which side controls the market and whether that pressure is strong enough to overcome typical volatility.
Disclaimer
It introduces a novel structural–pressure approach to visualizing market dynamics.
For educational and analytical purposes only; this does not constitute financial advice.

Twisted Forex's Doji + Area StrategyTitle
Twisted Forex’s Doji + Area Strategy
Description
What this strategy does
This strategy looks for doji candles forming inside or near supply/demand areas . Areas are built from swing pivots and sized with ATR, then tracked for retests (“confirmations”). When a doji prints close to an area and quality checks pass, the strategy places a trade with the stop beyond the doji and a configurable R:R target.
How areas (zones) are built
• Swings are detected with a user-set pivot length.
• Each swing spawns a horizontal area centered at the pivot price with half-height = zoneHalfATR × ATR .
• Duplicates are de-duplicated by center distance (ATR-scaled).
• Areas fade when broken beyond a buffer or after an optional age (expiry).
• Retests are recorded when price touches and then bounces away from the area; repeated reactions increase the zone’s “strength”.
Signal logic (summary)
Doji detection: strict or loose body criteria with optional minimum wick fractions and ATR-scaled minimum range.
Proximity: price must be inside/near a supply or demand area (proxATR × ATR).
Side resolution: overlap is resolved by (a) which side price penetrates more, (b) fast/slow EMA trend, or (c) nearest distance. Optional “previous candle flip” can bias long after a bearish candle and short after a bullish one.
Optional 1-bar confirmation: the bar after the doji must close away from the area by confirmATR × ATR .
Quality filter (Off/Soft/Strict): four checks—(i) wick rejection past the edge, (ii) doji closes in an edge “band” of the area, (iii) fresh touch (cooldown), (iv) approach impulse over a short lookback. In Strict , thresholds auto-tighten.
Orders & exits
• Long: stop below doji low minus buffer; Short: above doji high plus buffer.
• Target = rrMultiple × risk distance .
• Pyramiding is off by default.
Position sizing
You can size from the script or from Strategy Properties:
• Script-driven (default): set Position sizing = “Risk % of equity” and choose riskPercent (e.g., 1.0%). The script applies safe floors/rounding (FX micro-lots by default) so quantity never rounds to zero.
• Properties-driven : toggle Use TV Properties → Order size ON, then pick “Percent of equity” in Properties (e.g., 1%). The header includes safe defaults so trades still place.
Key inputs to explore
• Zone building : pivotLen, zoneHalfATR, minDepartureATR, expiryBars, breakATR, leftBars, dedupeATR.
• Doji & proximity : strictDoji, dojiBodyFrac, minWickFrac, minRangeATR, proxATR, minBarsBetween.
• Overlap resolution : usePenetration, useTrend (EMA 21/55), “previous candle flip”, needNextBarConf & confirmATR.
• Quality : qualityMode (Off/Soft/Strict), minQualPass/kStrict, wickPenATR, edgeBandFrac, approachLookback, approachMinATR, freshTouchBars.
• Zone strength gating : minStrengthSoft / minStrengthStrict.
• HTF confluence (optional) : useHTFTrend (HTF EMA 34/89) and/or useHTFZoneProx (HTF swing bands).
Tips to make it cleaner / higher quality
• Turn needNextBarConf ON and use confirmATR = 0.10–0.15 .
• Increase approachMinATR (e.g., 0.35–0.45) to require a stronger pre-touch impulse.
• Raise minStrengthSoft/Strict (e.g., 4–6) so only well-reacted zones can signal.
• Use signalsOnlyConfirmed ON if you prefer trades only from zones with retests (the script falls back gracefully when none exist yet).
• Nudge proxATR to 0.5–0.6 to demand tighter proximity to the level.
• Optional: enable useHTFTrend to filter counter-trend setups.
Default settings used in this publication
• Initial capital: 100,000 (illustrative).
• Slippage: 1 tick; Commission: 0% (you can raise commission if you prefer—spread is partly modeled by slippage).
• Sizing: Risk % of equity via inputs; riskPercent = 1.0% ; FX uses micro-lot floors by default.
• Quality: Off by default (Soft/Strict available).
• HTF trend gate: Off by default.
Backtesting notes
For a meaningful sample size, test on liquid symbols/timeframes that yield 100+ trades (e.g., majors on 5–15m over 1–2 years). Backtests are modelled and broker costs/spread vary—validate on your feed and forward-test.
How to read the chart
Shaded bands are supply (above) and demand (below). Brighter bands are the nearest K per side (visual aid). BUY/SELL labels mark entries; colored dots show entry/SL/TP levels. You can hide zones or unconfirmed zones for a cleaner view.
Disclaimer
This is educational material, not financial advice. Trading involves risk. Always test and size responsibly.

Quant Trend + Donchian (Educational, Public-Safe)What this does
Educational, public-safe visualization of a quant regime model:
• Trend : EMA(64) vs EMA(256) (EWMAC proxy)
• Breakout : Donchian channel (200)
• Volatility-awareness : internal z-scores (not plotted) for concept clarity
Why it’s useful
• Shows when trend & breakout align (clean regimes) vs conflict (chop)
• Helps explain why volatility-aware systems size up in smooth trends and scale down in noise
How to read it
• EMA64 above EMA256 with price near/above Donchian high → trend-following alignment
• EMA64 below EMA256 with price near/below Donchian low → bearish alignment
• Inside channel with EMAs tangled → range/chop risk
Notes
• Indicator is educational only (no orders).
• Built entirely with TradingView built-ins.
• For consistent visuals: enable “Indicator values on price scale” and disable “Scale price chart only” in Settings → Scales .

ATR Horizontal Lines from EMA and SMA with TableHow it works:
The script calculates ATR levels (of your choosing)
Instead of plotting curves, it creates horizontal lines
The lines are deleted and recreated on each bar to show current levels
Lines extend to the right or can be limited to a certain width
Customization options:
Line width (1-10 pixels)
Individual colors for each of the 4 lines
All the original parameters (EMA/SMA lengths, ATR length, multipliers)
The horizontal lines will now show the current ATR-based support/resistance levels and move dynamically as the EMAs, SMA, and ATR values change with new price data.

Vol-Pace Projected-ATR-ADX-Alert-MAThe VolSC indicator analyzes stock volume trends with a focus on the Pace metric, which projects today's volume as a percentage of the 30-day average, highlighting unusual activity (e.g., over 200% turns bright green with alerts). The phantom projection bar, a wide green histogram to the right of the last bar, visually represents this projected volume on daily charts only, aiding quick identification of potential volume surges without cluttering intraday or weekly views. Additional features include ADX strength, ATR averages, and customizable table display for comprehensive insights.
Key Features:
* Primary Indicator: Volume with ADX (Average Directional Index) text.
* Pacing and Alerts: Calculates the volume pace for the day. Features an unusual volume alert with an adjustable threshold (e.g., 200%).
* Volume Projection: Projects a visual "Phantom Volume" for the day, offset to the right of the actual volume bar.
* ATR Indicator: Displays the 2x ATR (Average True Range) value as text.
* Volume Average: Displays the ADV (Average Daily Volume) Moving Average as text.
* Customization: Most settings are adjustable.

Trend-Following & Breakout — Index Quant Strategy (NASDAQ)📈 Trend-Following & Breakout — Index Quant Strategy (NASDAQ & S&P 500)
Type: Invite-only strategy
Markets: NASDAQ 100 (NAS100 / US100 / NQ), S&P 500 (US500 / SPX), and other major equity indices.
🧠 Concept: Continuous trend model combining EWMAC (trend-following) and Donchian (breakout) signals, scaled by forecast strength and portfolio risk.
⚙️ Execution: Rebalances only on decision-bar closes, using hysteresis and a no-trade band to reduce churn.
📊 Default bias: Long-only — aligned with equity index drift.
🧩 How it works
• EWMAC Trend: Difference between fast and slow EMAs, normalized by an EWMA of absolute returns.
• Donchian Breakout: Distance beyond a 200-bar channel (Strict mode) or relative z-score position within it.
• Forecast combination: Weighted sum of trend and breakout points, clamped to ± capPoints.
• Hysteresis: Prevents quick sign flips near zero forecast.
• Risk scaling: Maps forecast strength to position size using equity × risk budget × ATR-based stop distance.
• Rebalance: Executes only if the required quantity change exceeds the Δqty threshold; can optionally block increases on Sundays (for CFDs).
⚙️ Default parameters
Deployed on NQ / US100 / NAS100 on Daily Timeframe
• Decision timeframe = 360 min (other options from 1 min to 1 week).
• Trend (EWMAC): Fast = 64, Slow = 256, Vol Norm = 32, Weight = 0.8.
• Breakout (Donchian): Length = 200, Mode = Strict, Weight = 0.2.
• Forecast scaling: ptsPerSigma = 1.0, capPoints = 10.
• Risk % per rebalance = 4 % of equity.
• ATR stop: ATR(14) × 1.0.
• No-trade band (Δqty) = 4 units.
• Hysteresis = 2 forecast points.
• Bias = Long-only (Neutral / Long-bias 50 % optional).
• Skip Sunday increases = false (default).
📋 Backtest properties (documented)
• Initial capital = 100 000 USD.
• Commission = 0.20 % per trade.
• Pyramiding = 10.
• Calc on every tick = false.
• Point value = 1 (for NAS100 CFD).
• No financing or slippage modeled.
• If using CFDs, account for overnight funding.
• On futures (NQ / ES), carry is implicit.
📊 Typical behaviour
• Many small scratches, a few large winners.
• Performs best during multi-week / multi-month trends.
• Underperforms in tight or volatile ranges.
• Average hold ≈ 30 – 90 days in historical tests.
💡 Risk and performance guide (illustrative)
Sharpe ≈ 1.25
Sortino ≈ 1.10 – 1.30
Max drawdown ≈ –18 % to –25 %
Annual volatility ≈ 24 – 28 %
CAGR ≈ 50 – 60 % (at 4 % risk)
Edge ratio ≈ 5 (MFE / MAE)
Historical backtests only — past performance does not guarantee future results.
🌍 Intended markets and timeframes
Optimized for NASDAQ 100 and S&P 500; also effective on similar indices (DAX, Dow Jones, FTSE).
Best on Daily or higher timeframes.
Aligns with long-term index drift — suitable for long-bias systematic trend portfolios.
⚠️ Limitations
• Backtests exclude CFD funding costs.
• Trend models will have losing streaks in range-bound markets.
• Designed for experienced traders seeking systematic exposure.
🔑 Requesting access
Send a private TradingView message to with the text:
“Request access to Trend-Following & Breakout — Index Quant Strategy.”
Access is granted only on explicit request.
For further information, see my TradingView Signature.
🆕 Release notes (v1.0)
• Initial release (360 min TF): EWMAC 64/256 + Donchian 200 Strict.
• Risk 4 %, ATR × 1.0, Long-only bias, hysteresis 2 pts, Δqty ≥ 4.
• Developed for NASDAQ 100 and S&P 500 indices.
• Implements continuous risk-scaled positioning and no-trade band logic.
🧾 Originality statement
This strategy is original work built entirely from TradingView built-ins (EMA, ATR, Highest, Lowest).
It does not reuse open-source invite-only code.
Any future reuse of open scripts will be done with explicit permission and credit.

Atlantean Sideways / Range Regime DetectorPurpose
When using trend based indicators, you can skip the false signals when there is a sideways action, protecting you from the false signals.
Flags likely sideways/range phases using three checks:
Weak trend (ADX from DMI)
Price compression (Bollinger Band Width, normalized)
Low volatility (NATR = ATR/Price%)
Logic
isSideways = (ADX < adxThresh) AND (bbNorm < 0.25) AND (NATR < natrMax)
When true: bars + background turn teal and a provisional Range High/Low (rolling rangeWin) is drawn.
Key Inputs
DMI: diLen(22)
Optimized for 15 mins Bitcoin, could change it to 14 for more general approach
ADX: adxSmooth(14), adxThresh(18)
Volatility: lenATR(14), natrMax(1.8)
Visuals: rangeWin(20), bar/range toggles
Quick Tuning
More signals: raise adxThresh to 20–25, raise natrMax to 2.5–4.0, increase BB cutoff by editing bbNorm < 0.25 --> 0.35–0.50.
Smoother range lines: increase rangeWin to 30–40.
Use Cases
Mean reversion inside teal ranges.
Breakout prep when price closes outside the drawn range after teal ends. Could be used as a signal although not suggested.
Filter trend systems: skip trades when sidewaysCond is true. This is the main purpose, for it to be combined with trend based indicators, like Supertrend.
Alert
“Sideways Detected” triggers when isSideways is true.
Script could be expanded upon your requests.

Universal Breakout Strategy [KedArc Quant]Description:
A flexible breakout framework where you can test different logics (Prev Day, Bollinger, Volume, ATR, EMA Trend, RSI Confirm, Candle Confirm, Time Filter) under one system.
Choose your breakout mode, and the strategy will handle entries, exits, and optional risk management (ATR stops, take-profits, daily loss guard, cooldowns).
An on-chart info table shows live mode values (like Prev High/Low, Bollinger levels, RSI, etc.) plus P&L stats for quick analysis.
Use it to compare which breakout style works best on your instrument and timeframe, whether intraday, swing, or positional trading
🔑 Why it’s useful
* Flexibility: Switch between breakout strategies without loading different indicators.
* Clarity: On-chart info table displays current mode, relevant indicator levels, and live strategy P&L stats.
* Testing efficiency: Quickly A/B test different breakout styles under the same backtest environment.
* Transparency: Every trade is rule-based and displayed with entry/exit markers.
🚀 How it helps traders
* Lets you experiment with breakout strategies quickly without loading multiple scripts.
* Helps identify which breakout method fits your instrument & timeframe.
* Gives clear on-chart visual + statistical feedback for confident decision-making.
⚙️ Input Configuration
* Breakout Mode → choose which strategy to test:
* *Prev Day* → breakouts of yesterday’s High/Low.
* *Bollinger* → Upper/Lower BB pierce.
* *Volume* → Breakout confirmed with volume above average.
* *ATR Stop* → Wide range breakout using ATR filter.
* *Time Filter* → Breakouts inside defined session hours.
* *EMA Trend* → Breakouts only in EMA fast > slow alignment.
* *RSI Confirm* → Breakouts with RSI confirmation (e.g. >55 for longs).
* *Candle Confirm* → Breakouts validated by bullish/bearish candle.
* Lookback / ATR / Bollinger inputs → adjust sensitivity.
* Intrabar mode → option to evaluate breakouts using bar highs/lows instead of closes.
* Table options → show/hide info table, show/hide P&L stats, choose corner placement.
📈 Entry & Exit Logic
* Entry → occurs when breakout condition of chosen mode is met.
* Exit → default exits via opposite signals or optional stop/target if enabled.
* Session filter → optional auto-flat at session end.
* P&L management → optional daily loss guard, cooldown between trades, and ATR-based stop/take profit.
❓ FAQ — Choosing the best setup
Q: Which strategy should I use for which chart?
* *Prev Day Breakouts*: Best on indices, FX, and liquid futures with strong daily levels.
* *Bollinger*: Works well in range-bound environments, or crypto pairs with volatility compression.
* *Volume*: Good on equities where breakout strength is tied to volume spikes.
* *ATR Stop*: Suits volatile instruments (commodities, crypto).
* *EMA Trend*: Useful in trending markets (stocks, indices).
* *RSI Confirm*: Adds momentum filter, better for swing trades.
* *Candle Confirm*: Ideal for scalpers needing visual confirmation.
* *Time Filter*: For intraday traders who want signals only in high-liquidity sessions.
Q: What timeframe should I use?
* Intraday traders → 5m to 15m (Time Filter, Candle Confirm).
* Swing traders → 1H to 4H (EMA Trend, RSI Confirm, ATR Stop).
* Position traders → Daily (Prev Day, Bollinger).
* Breakout
A trade entry condition triggered when price crosses above a resistance level (for longs) or below a support level (for shorts).
* Prev Day High/Low
Formula:
Prev High = High of (Day )
Prev Low = Low of (Day )
* Bollinger Bands
Formula:
Basis = SMA(Close, Length)
Upper Band = Basis + (Multiplier × StdDev(Close, Length))
Lower Band = Basis – (Multiplier × StdDev(Close, Length))
* Volume Confirmation
A breakout is only valid if:
Volume > SMA(Volume, Length)
* ATR (Average True Range)
Measures volatility.
Formula:
ATR = SMA(True Range, Length)
where True Range = max(High–Low, |High–Close |, |Low–Close |)
* EMA (Exponential Moving Average)
Weighted moving average giving more weight to recent prices.
Formula:
EMA = (Price × α) + (EMA × (1–α))
with α = 2 / (Length + 1)
* RSI (Relative Strength Index)
Momentum oscillator scaled 0–100.
Formula:
RSI = 100 – (100 / (1 + RS))
where RS = Avg(Gain, Length) ÷ Avg(Loss, Length)
* Candle Confirmation
Bullish candle: Close > Open AND Close > Close
Bearish candle: Close < Open AND Close < Close
Win Rate (%)
Formula:
Win Rate = (Winning Trades ÷ Total Trades) × 100
* Average Trade P&L
Formula:
Avg Trade = Net Profit ÷ Total Trades
📊 Performance Notes
The Universal Breakout Strategy is designed as a framework rather than a single-asset optimized system. Results will vary depending on the chart, timeframe, and asset chosen.
On the current defaults (15-minute, INR-denominated example), the backtest produced 132 trades over the selected period. This provides a statistically sufficient sample size.
Win rate (~35%) is relatively low, but this is balanced by a positive reward-to-risk ratio (~1.8). In practice, a lower win rate with larger wins versus smaller losses is sustainable.
The average P&L per trade is close to breakeven under default settings. This is expected, as the strategy is not tuned for a single symbol but offered as a universal breakout framework.
Commissions (0.1%) and slippage (1 tick) are included in the simulation, ensuring realistic conditions.
Risk management is conservative, with order sizing set at 1 unit per trade. This avoids over-leveraging and keeps exposure well under the 5-10% equity risk guideline.
👉 Traders are encouraged to:
Experiment with inputs such as ATR period, breakout length, or Bollinger parameters.
Test across different timeframes and instruments (equities, futures, forex, crypto) to find optimal setups.
Combine with filters (trend direction, volatility regimes, or volume conditions) for further refinement.
⚠️ Disclaimer This script is provided for educational purposes only.
Past performance does not guarantee future results.
Trading involves risk, and users should exercise caution and use proper risk management when applying this strategy.

ATR Volatility and Trend AnalysisATR Volatility and Trend Analysis
Unlock the power of the Average True Range (ATR) with the ATR Volatility and Trend Analysis indicator. This comprehensive tool is designed to provide traders with a multi-faceted view of market dynamics, combining volatility analysis, dynamic support and resistance levels, and trend detection into a single, easy-to-use indicator.
How It Works
The ATR Volatility and Trend Analysis indicator is built upon the core concept of the ATR, a classic measure of market volatility. It expands on this by providing several key features:
Dynamic ATR Bands: The indicator plots three sets of upper and lower bands around the price. These bands are calculated by multiplying the current ATR value by user-defined multipliers. They act as dynamic support and resistance levels, widening during volatile periods and contracting during calm markets.
Volatility Breakout Signals: Identify potential breakouts with precision. The indicator generates a signal when the current ATR value surges above its own moving average by a specified threshold, indicating a significant increase in volatility that could lead to a strong price move.
Trend Detection: The indicator determines the market trend by analyzing both price action and ATR behavior. A bullish trend is signaled when the price is above its moving average and volatility is increasing. Conversely, a bearish trend is signaled when the price is below its moving average and volatility is increasing.
How to Use the ATR Multi-Band Indicator
Identify Support and Resistance: Use the ATR bands as key levels. Price approaching the outer bands may indicate overbought or oversold conditions, while a break of the bands can signal a strong continuation.
Confirm Breakouts: Look for a volatility breakout signal to confirm the strength behind a price move. A breakout from a consolidation range accompanied by a volatility signal is a strong indicator of a new trend.
Trade with the Trend: Use the background coloring and trend signals to align your trades with the dominant market direction. Enter long positions during confirmed bullish trends and short positions during bearish trends.
Set Up Alerts: The indicator includes alerts for band crosses, trend changes, and volatility breakouts, ensuring you never miss a potential trading opportunity.
What makes it different?
While many indicators use ATR, the ATR Volatility and Trend Analysis tool is unique in its integration of multiple ATR-based concepts into a single, cohesive system. It doesn't just show volatility; it interprets it in the context of price action to deliver actionable trend and breakout signals, making it a complete solution for ATR-based analysis.
Disclaimer
This indicator is designed as a technical analysis tool and should be used in conjunction with other forms of analysis and proper risk management.
Past performance does not guarantee future results, and traders should thoroughly test any strategy before implementing it with real capital.

Volume Percentile Supertrend [BackQuant]Volume Percentile Supertrend
A volatility and participation aware Supertrend that automatically widens or tightens its bands based on where current volume sits inside its recent distribution. The goal is simple: fewer whipsaws when activity surges, faster reaction when the tape is quiet.
What it does
Calculates a standard Supertrend framework from an ATR on a volume weighted price source.
Measures current volume against its recent percentile and converts that context into a dynamic ATR multiplier.
Widens bands when volume is unusually high to reduce chop. Tightens bands when volume is unusually low to catch turns earlier.
Paints candles, draws the active Supertrend line and optional bands, and prints clear Long and Short signal markers.
Why volume percentile
Fixed ATR multipliers assume all bars are equal. They are not. When participation spikes, price swings expand and a static band gets sliced.
Percentiles place the current bar inside a recent distribution. If volume is in the top slice, the Supertrend allows more room. If volume is in the bottom slice, it expects smaller noise and tightens.
This keeps the same playbook usable across busy sessions and sleepy ones without constant manual retuning.
How it works
Volume distribution - A rolling window computes the Pth percentile of volume. Above that is flagged as high volume. A lower reference percentile marks quiet bars.
Dynamic multiplier - Start from a Base Multiplier. If bar is high volume, scale it up by a function of volume-to-average and a Sensitivity knob. If bar is low volume, scale it down. Smooth the result with an EMA to avoid jitter.
VWMA source - The price input for bands is a short volume weighted moving average of close. Heavy prints matter more.
ATR envelope - Compute ATR on your length. UpperBasic = VWMA + Multiplier x ATR. LowerBasic = VWMA - Multiplier x ATR.
Trailing logic - The final lines trail price so they only move in a direction that preserves Supertrend behavior. This prevents sudden flips from transient pokes.
Direction and signals - Direction flips when price crosses through the relevant trailing line. SupertrendLong and SupertrendShort mark those flips. The plotted Supertrend is the active trailing side.
Inputs and what they change
Volume Lookback - Window for percentile and average. Larger window = stabler percentile, smaller = snappier.
Volume Percentile Level - Threshold that defines high volume. Example 70 means top 30 percent of recent bars are treated as high activity.
Volume Sensitivity - Gain from volume ratio to the dynamic multiplier. Higher = bands expand more when volume spikes.
VWMA Source Length - Smoothing of the volume weighted price source for the bands.
ATR Length - Standard ATR window. Larger = slower, smaller = quicker.
Base Multiplier - Core band width before volume adjustment. Think of this as your neutral volatility setting.
Multiplier Smoothing - EMA on the dynamic multiplier. Reduces back and forth changes when volume oscillates around the threshold.
Show Supertrend on chart - Toggles the active line.
Show Upper Lower Bands - Draws both sides even when inactive. Good for context.
Paint candles according to Trend - Colors bars by trend direction.
Show Long and Short Signals - Prints 𝕃 and 𝕊 markers at flips.
Colors - Choose your long and short palette.
Reading the plot
Supertrend line - Thick line that hugs price from above in downtrends and from below in uptrends. Its distance breathes with volume.
Bands - Optional upper and lower rails. Useful to see the inactive side and judge how wide the envelope is right now.
Signals - 𝕃 prints when the trend flips long. 𝕊 prints when the trend flips short.
Candle colors - Quick bias read at a glance when painting is enabled.
Typical workflows
Trend following - Use 𝕃 flips to initiate longs and ride while bars remain colored long and price respects the lower trailing line. Mirror for shorts with 𝕊 and the upper trailing line. During high volume phases the line will give more room, which helps stay in the move.
Pullback adds - In an established trend, shallow tags toward the active line after a high volume expansion can be add points. The dynamic envelope adjusts to the session so your add distance is not fixed to a stale volatility regime.
Mean reversion filter - In quiet tape the multiplier contracts and flips come earlier. If you prefer fading, watch for quick toggles around the bands when volume percentile remains low. In high volume, avoid fading into the widened line unless you have other strong reasons.
Notes on behavior
High volume bar: the percentile gate opens, volRatio > 1 powers up the multiplier through the Sensitivity lever, bands widen, fewer false flips.
Low volume bar: multiplier contracts, bands tighten, flips can happen earlier which is useful when you want to catch regime changes in quiet conditions.
Smoothing matters: both the price source (VWMA) and the multiplier are smoothed to keep structure readable while still adapting.
Quick checklist
If you see frequent chop and today feels busy: check that volume is above your percentile. Wider bands are expected. Consider letting the trend prove itself against the expanded line before acting.
If everything feels slow and you want earlier entries: percentile likely marks low volume, so bands tighten and 𝕃 or 𝕊 can appear sooner.
If you want more or fewer flips overall: adjust Base Multiplier first. If you want more reaction specifically tied to volume surges: raise Volume Sensitivity. If the envelope breathes too fast: raise Multiplier Smoothing.
What the signals mean
SupertrendLong - Direction changed from non-long to long. 𝕃 marker prints. The active line switches to support below price.
SupertrendShort - Direction changed from non-short to short. 𝕊 marker prints. The active line switches to resistance above price.
Trend color - Bars painted long or short help validate context for entries and management.
Summary
Volume Percentile Supertrend adapts the classic Supertrend to the day you are trading. Volume percentile sets the mood, sensitivity translates it into dynamic band width, and smoothing keeps it clean. The result is a single plot that aims to stay conservative when the tape is loud and act decisively when it is quiet, without you having to constantly retune settings.

Opening Candle Zone with ATR Bands by nkChartsThis indicator highlights the opening range of each trading session and projects dynamic ATR-based zones around it.
Key Features
Plots high and low levels of the opening candle for each new daily session.
Extends these levels across the session, providing clear intraday support and resistance zones.
Adds ATR-based offset bands above and below the opening range for volatility-adjusted levels.
Customizable colors, ATR length, and multiplier for flexible use across markets and timeframes.
Adjustable session history limit to control how many past levels remain on the chart.
How to Use:
The opening range high/low often acts as strong intraday support or resistance.
The ATR bands give an adaptive volatility buffer, useful for breakout or mean-reversion strategies.
Works on any market with clear session opens.
This tool is designed for traders who want to combine session-based price action with volatility insights, helping identify potential breakouts, reversals, or consolidation areas throughout the day.
⚠️ Disclaimer: This indicator is for educational purposes only. It does not provide financial advice or guarantee profits. Always perform your own analysis before making trading decisions.

KAMENICZKI PROSCAPLERPROSCAPLER is an advanced trading indicator that combines a dynamic channel with a prediction line for maximum accuracy and trading success. The indicator is designed for professional traders who need reliable signals with high success rates.
Adaptive Intelligence
Automatic optimal period detection - the indicator adapts to various market conditions
Intelligent timeframe settings - automatically optimizes periods based on TF
Dynamic adaptation - the channel changes according to volatility and trend.
High Signal Accuracy
Pearson R correlation - filters only strong trends with high reliability
Multi-timeframe confirmation - confirms signals on higher timeframe
Volatility and volume filters - eliminates false signals
RSI extreme values - captures only the best entry points
Prediction Line
Future price direction - shows where the price will move
Adaptive length - adapts to timeframe
Strong signals - when the entire prediction line is in the center of the channel
Quality Filters
Minimum Pearson R 0.5+ - only strong trends
Volume filter 1.2x - only signals with sufficient volume
ATR volatility filter - eliminates low volatility
RSI extreme levels - only at oversold/overbought values
Anomalies
Anomaly detection - captures exceptional opportunities
Bright yellow/pink color - immediately visible
Fast Reaction
Minimum trend bars = 1 - fast turning
Adaptive detection - immediate reaction to changes
Automatic optimizations - without manual settings
News & Volatility Filters
News filter - disables channel during high impact news
Volatility filter - protects against high volatility
Gap detection - filters dangerous gaps
Combined Filters
All filters must be met - maximum reliability
Multi-timeframe confirmation - double check
Pearson R validation - mathematical accuracy
Volume confirmation - institutional interest
Reaction Speed
Instant signals - without delay
Adaptive settings - automatic optimization
Fast turning - minimum 1 bar trend
Signal Accuracy
Quality filters increase success rate to 70-80%
Anomalies have 80-90% success rate
STRONG signals (prediction line in center) 85-95%
HAVE FUN :)
BOCS Channel Scalper Strategy - Automated Mean Reversion System# BOCS Channel Scalper Strategy - Automated Mean Reversion System
## WHAT THIS STRATEGY DOES:
This is an automated mean reversion trading strategy that identifies consolidation channels through volatility analysis and executes scalp trades when price enters entry zones near channel boundaries. Unlike breakout strategies, this system assumes price will revert to the channel mean, taking profits as price bounces back from extremes. Position sizing is fully customizable with three methods: fixed contracts, percentage of equity, or fixed dollar amount. Stop losses are placed just outside channel boundaries with take profits calculated either as fixed points or as a percentage of channel range.
## KEY DIFFERENCE FROM ORIGINAL BOCS:
**This strategy is designed for traders seeking higher trade frequency.** The original BOCS indicator trades breakouts OUTSIDE channels, waiting for price to escape consolidation before entering. This scalper version trades mean reversion INSIDE channels, entering when price reaches channel extremes and betting on a bounce back to center. The result is significantly more trading opportunities:
- **Original BOCS**: 1-3 signals per channel (only on breakout)
- **Scalper Version**: 5-15+ signals per channel (every touch of entry zones)
- **Trade Style**: Mean reversion vs trend following
- **Hold Time**: Seconds to minutes vs minutes to hours
- **Best Markets**: Ranging/choppy conditions vs trending breakouts
This makes the scalper ideal for active day traders who want continuous opportunities within consolidation zones rather than waiting for breakout confirmation. However, increased trade frequency also means higher commission costs and requires tighter risk management.
## TECHNICAL METHODOLOGY:
### Price Normalization Process:
The strategy normalizes price data to create consistent volatility measurements across different instruments and price levels. It calculates the highest high and lowest low over a user-defined lookback period (default 100 bars). Current close price is normalized using: (close - lowest_low) / (highest_high - lowest_low), producing values between 0 and 1 for standardized volatility analysis.
### Volatility Detection:
A 14-period standard deviation is applied to the normalized price series to measure price deviation from the mean. Higher standard deviation values indicate volatility expansion; lower values indicate consolidation. The strategy uses ta.highestbars() and ta.lowestbars() to identify when volatility peaks and troughs occur over the detection period (default 14 bars).
### Channel Formation Logic:
When volatility crosses from a high level to a low level (ta.crossover(upper, lower)), a consolidation phase begins. The strategy tracks the highest and lowest prices during this period, which become the channel boundaries. Minimum duration of 10+ bars is required to filter out brief volatility spikes. Channels are rendered as box objects with defined upper and lower boundaries, with colored zones indicating entry areas.
### Entry Signal Generation:
The strategy uses immediate touch-based entry logic. Entry zones are defined as a percentage from channel edges (default 20%):
- **Long Entry Zone**: Bottom 20% of channel (bottomBound + channelRange × 0.2)
- **Short Entry Zone**: Top 20% of channel (topBound - channelRange × 0.2)
Long signals trigger when candle low touches or enters the long entry zone. Short signals trigger when candle high touches or enters the short entry zone. This captures mean reversion opportunities as price reaches channel extremes.
### Cooldown Filter:
An optional cooldown period (measured in bars) prevents signal spam by enforcing minimum spacing between consecutive signals. If cooldown is set to 3 bars, no new long signal will fire until 3 bars after the previous long signal. Long and short cooldowns are tracked independently, allowing both directions to signal within the same period.
### ATR Volatility Filter:
The strategy includes a multi-timeframe ATR filter to avoid trading during low-volatility conditions. Using request.security(), it fetches ATR values from a specified timeframe (e.g., 1-minute ATR while trading on 5-minute charts). The filter compares current ATR to a user-defined minimum threshold:
- If ATR ≥ threshold: Trading enabled
- If ATR < threshold: No signals fire
This prevents entries during dead zones where mean reversion is unreliable due to insufficient price movement.
### Take Profit Calculation:
Two TP methods are available:
**Fixed Points Mode**:
- Long TP = Entry + (TP_Ticks × syminfo.mintick)
- Short TP = Entry - (TP_Ticks × syminfo.mintick)
**Channel Percentage Mode**:
- Long TP = Entry + (ChannelRange × TP_Percent)
- Short TP = Entry - (ChannelRange × TP_Percent)
Default 50% targets the channel midline, a natural mean reversion target. Larger percentages aim for opposite channel edge.
### Stop Loss Placement:
Stop losses are placed just outside the channel boundary by a user-defined tick offset:
- Long SL = ChannelBottom - (SL_Offset_Ticks × syminfo.mintick)
- Short SL = ChannelTop + (SL_Offset_Ticks × syminfo.mintick)
This logic assumes channel breaks invalidate the mean reversion thesis. If price breaks through, the range is no longer valid and position exits.
### Trade Execution Logic:
When entry conditions are met (price in zone, cooldown satisfied, ATR filter passed, no existing position):
1. Calculate entry price at zone boundary
2. Calculate TP and SL based on selected method
3. Execute strategy.entry() with calculated position size
4. Place strategy.exit() with TP limit and SL stop orders
5. Update info table with active trade details
The strategy enforces one position at a time by checking strategy.position_size == 0 before entry.
### Channel Breakout Management:
Channels are removed when price closes more than 10 ticks outside boundaries. This tolerance prevents premature channel deletion from minor breaks or wicks, allowing the mean reversion setup to persist through small boundary violations.
### Position Sizing System:
Three methods calculate position size:
**Fixed Contracts**:
- Uses exact contract quantity specified in settings
- Best for futures traders (e.g., "trade 2 NQ contracts")
**Percentage of Equity**:
- position_size = (strategy.equity × equity_pct / 100) / close
- Dynamically scales with account growth
**Cash Amount**:
- position_size = cash_amount / close
- Maintains consistent dollar exposure regardless of price
## INPUT PARAMETERS:
### Position Sizing:
- **Position Size Type**: Choose Fixed Contracts, % of Equity, or Cash Amount
- **Number of Contracts**: Fixed quantity per trade (1-1000)
- **% of Equity**: Percentage of account to allocate (1-100%)
- **Cash Amount**: Dollar value per position ($100+)
### Channel Settings:
- **Nested Channels**: Allow multiple overlapping channels vs single channel
- **Normalization Length**: Lookback for high/low calculation (1-500, default 100)
- **Box Detection Length**: Period for volatility detection (1-100, default 14)
### Scalping Settings:
- **Enable Long Scalps**: Toggle long entries on/off
- **Enable Short Scalps**: Toggle short entries on/off
- **Entry Zone % from Edge**: Size of entry zone (5-50%, default 20%)
- **SL Offset (Ticks)**: Distance beyond channel for stop (1+, default 5)
- **Cooldown Period (Bars)**: Minimum spacing between signals (0 = no cooldown)
### ATR Filter:
- **Enable ATR Filter**: Toggle volatility filter on/off
- **ATR Timeframe**: Source timeframe for ATR (1, 5, 15, 60 min, etc.)
- **ATR Length**: Smoothing period (1-100, default 14)
- **Min ATR Value**: Threshold for trade enablement (0.1+, default 10.0)
### Take Profit Settings:
- **TP Method**: Choose Fixed Points or % of Channel
- **TP Fixed (Ticks)**: Static distance in ticks (1+, default 30)
- **TP % of Channel**: Dynamic target as channel percentage (10-100%, default 50%)
### Appearance:
- **Show Entry Zones**: Toggle zone labels on channels
- **Show Info Table**: Display real-time strategy status
- **Table Position**: Corner placement (Top Left/Right, Bottom Left/Right)
- **Color Settings**: Customize long/short/TP/SL colors
## VISUAL INDICATORS:
- **Channel boxes** with semi-transparent fill showing consolidation zones
- **Colored entry zones** labeled "LONG ZONE ▲" and "SHORT ZONE ▼"
- **Entry signal arrows** below/above bars marking long/short entries
- **Active TP/SL lines** with emoji labels (⊕ Entry, 🎯 TP, 🛑 SL)
- **Info table** showing position status, channel state, last signal, entry/TP/SL prices, and ATR status
## HOW TO USE:
### For 1-3 Minute Scalping (NQ/ES):
- ATR Timeframe: "1" (1-minute)
- ATR Min Value: 10.0 (for NQ), adjust per instrument
- Entry Zone %: 20-25%
- TP Method: Fixed Points, 20-40 ticks
- SL Offset: 5-10 ticks
- Cooldown: 2-3 bars
- Position Size: 1-2 contracts
### For 5-15 Minute Day Trading:
- ATR Timeframe: "5" or match chart
- ATR Min Value: Adjust to instrument (test 8-15 for NQ)
- Entry Zone %: 20-30%
- TP Method: % of Channel, 40-60%
- SL Offset: 5-10 ticks
- Cooldown: 3-5 bars
- Position Size: Fixed contracts or 5-10% equity
### For 30-60 Minute Swing Scalping:
- ATR Timeframe: "15" or "30"
- ATR Min Value: Lower threshold for broader market
- Entry Zone %: 25-35%
- TP Method: % of Channel, 50-70%
- SL Offset: 10-15 ticks
- Cooldown: 5+ bars or disable
- Position Size: % of equity recommended
## BACKTEST CONSIDERATIONS:
- Strategy performs best in ranging, mean-reverting markets
- Strong trending markets produce more stop losses as price breaks channels
- ATR filter significantly reduces trade count but improves quality during low volatility
- Cooldown period trades signal quantity for signal quality
- Commission and slippage materially impact sub-5-minute timeframe performance
- Shorter timeframes require tighter entry zones (15-20%) to catch quick reversions
- % of Channel TP adapts better to varying channel sizes than fixed points
- Fixed contract sizing recommended for consistent risk per trade in futures
**Backtesting Parameters Used**: This strategy was developed and tested using realistic commission and slippage values to provide accurate performance expectations. Recommended settings: Commission of $1.40 per side (typical for NQ futures through discount brokers), slippage of 2 ticks to account for execution delays on fast-moving scalp entries. These values reflect real-world trading costs that active scalpers will encounter. Backtest results without proper cost simulation will significantly overstate profitability.
## COMPATIBLE MARKETS:
Works on any instrument with price data including stock indices (NQ, ES, YM, RTY), individual stocks, forex pairs (EUR/USD, GBP/USD), cryptocurrency (BTC, ETH), and commodities. Volume-based features require data feed with volume information but are optional for core functionality.
## KNOWN LIMITATIONS:
- Immediate touch entry can fire multiple times in choppy zones without adequate cooldown
- Channel deletion at 10-tick breaks may be too aggressive or lenient depending on instrument tick size
- ATR filter from lower timeframes requires higher-tier TradingView subscription (request.security limitation)
- Mean reversion logic fails in strong breakout scenarios leading to stop loss hits
- Position sizing via % of equity or cash amount calculates based on close price, may differ from actual fill price
- No partial closing capability - full position exits at TP or SL only
- Strategy does not account for gap openings or overnight holds
## RISK DISCLOSURE:
Trading involves substantial risk of loss. Past performance does not guarantee future results. This strategy is for educational purposes and backtesting only. Mean reversion strategies can experience extended drawdowns during trending markets. Stop losses may not fill at intended levels during extreme volatility or gaps. Thoroughly test on historical data and paper trade before risking real capital. Use appropriate position sizing and never risk more than you can afford to lose. Consider consulting a licensed financial advisor before making trading decisions. Automated trading systems can malfunction - monitor all live positions actively.
## ACKNOWLEDGMENT & CREDITS:
This strategy is built upon the channel detection methodology created by **AlgoAlpha** in the "Smart Money Breakout Channels" indicator. Full credit and appreciation to AlgoAlpha for pioneering the normalized volatility approach to identifying consolidation patterns. The core channel formation logic using normalized price standard deviation is AlgoAlpha's original contribution to the TradingView community.
Enhancements to the original concept include: mean reversion entry logic (vs breakout), immediate touch-based signals, multi-timeframe ATR volatility filtering, flexible position sizing (fixed/percentage/cash), cooldown period filtering, dual TP methods (fixed points vs channel percentage), automated strategy execution with exit management, and real-time position monitoring table.

ATR Bands over 50D SMA (% method)Indicator that shows multiples of ATR% above the 50d SMA as bands on a chart, building off of
Jeff Sun 's methodology. You should tinker with the settings to chose your multiples, colors and which multiple lines to show. I don't know if the negative multiple lines have any use, so I turn mine off. Offered as is. I am not a programmer. Note the other indicators shown on the print screen are not mine.
Rogue 4H ORRogue 4H OR – Opening Range
The Rogue 4H Daily OR is a powerful Opening Range tool designed to help traders identify key intraday levels and capitalize on failed breakout setups.
Key Features:
Custom Opening Range: Define your OR start and end times (default 4H) to suit any market – stocks, forex, or crypto.
Locked Levels: Once the OR session ends, the high and low are locked and projected across the trading day.
Fakeout Signals: Triangular buy/sell markers plot when price breaks out of the OR and then closes back inside, signaling potential reversal entries.
Daily Reset: Signals and ranges reset each trading day for clean analysis.
Session Cutoff: Optional cutoff time prevents late-day signals from cluttering your chart.
How to Use:
Adjust the OR start/end time to match your trading session (e.g., 09:30–13:30 for US stocks, 00:00–04:00 for crypto).
Watch for false breakouts → a close above the OR high that falls back inside signals a short, while a close below the OR low that reclaims the range signals a long.
Use the signals in confluence with trend, volume, or other confirmation tools for best results. **This is not financial advice.**
Designed for traders who thrive on intraday range dynamics and want a visual, session-based tool to spot high-probability setups.
**This is not financial advice**

Uptrick: ATR ModelIntroduction
The Uptrick: ATR Model is a multi-regime directional tool designed to adapt to various trading styles and timeframes. It combines trend assessment, market state evaluation, visual overlays, and signal filtering into a single, highly configurable system. This indicator is intended to help traders interpret directional conditions, structure their entries and exits, and view real-time shifts in market context, all without relying on external scripts or multiple chart layers.
Core Functionality
At its foundation, the Uptrick: ATR Model builds a framework that responds to user-defined structure and market behavior. Through a wide range of inputs, traders can adjust the internal responsiveness, signal frequency, and volatility interaction of the system. The core behavior of the model can be shaped via:
Custom starting date for signal activation
Flexible smoothing structure
Adjustable expansion control for range boundaries
Signal persistence settings to limit noise
Conditional plotting of directional signals
Real-time bar coloring and overlays
Custom routing between long, short, and neutral positioning
This indicator is not tied to a single interpretation of market movement. Instead, it adapts to how the user defines structural behavior, volatility confirmation, and trend alignment.
Multi-Regime Architecture
The script includes four unique operating regimes, each offering a distinct model of interpreting market conditions:
Trend Mode
This regime focuses on trend state transitions over time. Signal behavior is aligned with directional market shifts and transitions are plotted with visual labels. Optional filters and persistence settings help control signal quality and responsiveness.
Cloud Close Mode
Cloud Close mode detects transitions when price interacts with dynamic boundaries. Signals are generated when the asset moves in or out of these ranges. This regime supports state memory to avoid repeated signals and emphasizes confirmation over reactivity.
Lightning Trend Mode
This mode evaluates momentum alignment across selected structures. Its behavior is based on composite assessments and dynamically reflects changes in directional agreement. This regime is well-suited for intraday or high-resolution users seeking visual confirmation of trend shifts.
Final Verdict Mode
A meta-regime that combines the output of the other three modes into a single directional consensus. A live decision table is displayed on-screen, showing the current verdict of each regime and a final, averaged output. This mode is designed for high-conviction or conservative traders who prefer confirmation across multiple systems.
Each regime can be enabled through a single selector, and the indicator adapts its signal behavior and bar coloring to reflect the active mode.
Signal System and Visual Feedback
The indicator generates Long, Short, or Cash (neutral/exit) signals depending on the active regime, directional configuration, and filter conditions. Signal shapes are plotted only once per state transition and are color-coded for clarity.
Users can define:
Whether signals should support both long and short, or long-only
Whether repeated signals are allowed (pyramiding control)
Whether to enforce a minimum number of confirming bars before a signal is allowed (persistence)
Signals are accompanied by real-time bar coloring, giving users an instant visual cue of the current state without relying on shape markers alone. These signals adjust based on the selected regime and are subject to any active confirmation filters.
Confirmation Filters
To reduce noise and improve the relevance of each signal, the model includes two optional filters:
Strength Filter
[Applies a condition based on the asset’s momentum. When enabled, signals will only fire if this condition aligns with the trade direction. Includes parameters for sensitivity and smoothness.
Trend Filter
Applies a directional filter based on a broader trend context. Signals will only trigger when this larger structure supports the directional bias. This filter is useful for avoiding signals during counter-trend moves or consolidations.
Both filters can be toggled independently. When disabled, the model will operate with fewer restrictions.
Dynamic Structure Customization
Users can control how the internal structure of the model behaves using:
Source selection (e.g., close, open, high, etc.)
Smoothing configuration using a tiered structure with up to three stages
Custom length inputs to adjust responsiveness
Selectable method options for each layer
Expansion settings to adjust the distance of dynamic boundaries
Signal persistence threshold to delay entries until confirmation is met
This modular control allows traders to define whether they want faster reaction to movement or more conservative, delayed responses depending on their strategy.
Final Verdict Table
The Final Verdict table is a live display that summarizes the signal output of the three core regimes (Trend, Cloud Close, and Lightning Trend). It includes:
Regime names and their current directional state
Directional scores for each regime
A final averaged score and directional label
The table is updated every bar and is fully customizable:
Position on screen (top left, center, bottom right, etc.)
Text size for readability
Color-coded state labels for fast interpretation
This feature is designed to offer structured decision support by showing consensus or divergence across all logic models in real time.
Static Levels Module
An optional module allows the user to anchor a high point (typically an all-time high) from a user-defined historical date. From that anchor, multiple levels are projected downward using fixed ratios. These levels are:
Automatically updated when new highs occur
Visualized using horizontal step-lines
Fully customizable in terms of count, color, and source
These levels serve as contextual guides and can assist with price projection, risk management, or discretionary confluence zones.
Directional Control
The model supports both Long & Short and Long Only signal modes. In Long Only mode, exit signals are routed to neutral (Cash) instead of Short. This allows users to align the indicator with personal strategy, risk appetite, or portfolio rules. Neutral signals are also plotted with distinct labels and coloring to indicate a directional reset.
Input Summary
All components of the script are user-configurable through the following inputs:
Start date selector to restrict signal generation
Source selection for core price input
Custom lengths and responsiveness settings
Smoothing structure with optional stacking
Expansion control for range width
Signal persistence threshold
Signal type selector (long-only or long & short)
Regime selector between four logic systems
Filters: strength-based and trend-based
Verdict table display settings (position and size)
Static levels: anchor date, count, source, and visual customization
Originality
What sets the Uptrick: ATR Model apart is its integration of multiple directional systems into a single, configurable interface. Each regime is distinct and interprets market behavior from a unique perspective, while the Final Verdict mode offers a consolidated view that few tools provide in a fully visual and non-redundant format. The Lightning Trend scoring engine and modular structural design offer a level of control and flexibility uncommon in single-layer indicators. The combination of signal gating, decision tables, and state tracking creates a cohesive, structured environment for directional evaluation.
Summary
The Uptrick: ATR Model is a complete directional and volatility analysis system designed for customizable trend evaluation, signal clarity, and strategic filtering. It adapts to different trader needs through its configurable regimes, state-aware signals, dynamic overlays, and visual decision tools. It is suitable for discretionary traders seeking structured guidance, as well as systematic users who require configurable state management and signal control.
Disclaimer
This tool is provided for informational and research purposes only. It does not constitute investment advice or a recommendation to buy or sell any financial instrument. All trading involves risk, and past performance does not guarantee future results. Users are solely responsible for their own decisions.

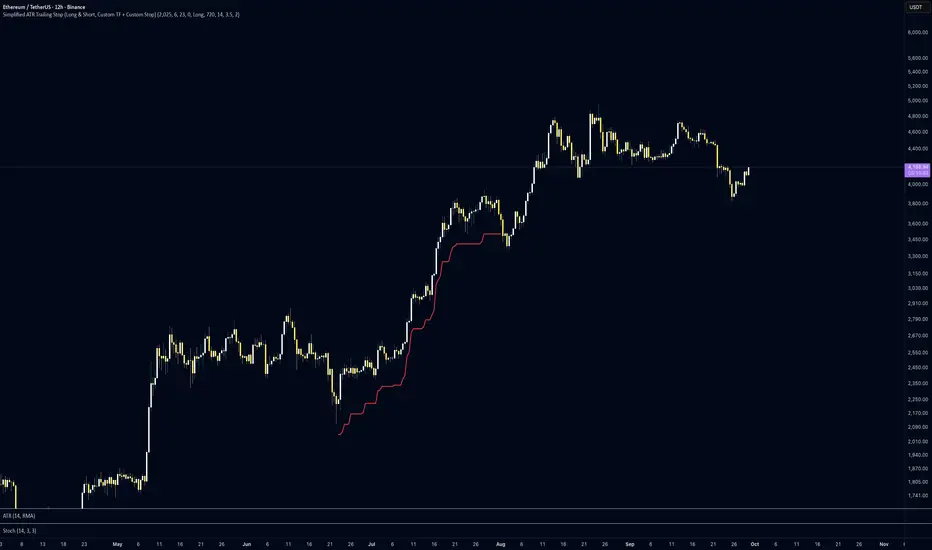
Simplified ATR Trailing Stop (Long & Short, Custom TF + Stop)This indicator plots a dynamic ATR-based trailing stop that adapts to price volatility and keeps you protected whether you’re trading long or short. It’s lightweight, customisable, and designed for traders who want clean risk management without unnecessary complexity.
✨ Key Features:
📅 Custom Entry Date & Price – choose the exact day you want the trailing stop to begin, or let it auto-start from the close.
🔀 Long or Short Mode – flip between bullish and bearish trade setups.
⏱️ Custom Timeframe Support – calculate ATR stops on any higher/lower timeframe (from 10m to 1M) for maximum flexibility.
📏 ATR-Based Logic – trailing stop adjusts dynamically using a multiplier of ATR, keeping stops adaptive to volatility.
🎯 Custom First-Day Stop – set a different ATR factor for day one to handle entries more cautiously.
✅ Stop Trigger Mode – choose between:
Stop on Wick Breach (default intraday aggressiveness)
Stop on Candle Close (extra confirmation, fewer false stops).
📊 How to Use:
Set your entry date and price (or leave price = 0 to use that day’s close).
Select trade direction (Long or Short).
Pick your ATR period, multiplier, and timeframe.
Watch the trailing stop line update automatically until it’s breached.
This tool is great for swing traders, intraday strategists, and anyone who wants a simple yet powerful trailing stop that adapts to price volatility.
Average True Range TrackerThis indicator calculates the daily ATR of the past 14 days. The ATR% indicates the range completed for the day. The ATR indicates the average daily range. The 20% ATR indicates the value of 20% of the daily ATR for retracement purposes.