ATR Grid Levels [By MUQWISHI]▋ INTRODUCTION :
The “ATR Levels” produces a sequence of horizontal line levels above and below the Center Line (reference level). They are sized based on the instrument's volatility, representing the average historical price movement on a selected higher timeframe using the average true range (ATR) indicator.
_______________________
▋ OVERVIEW:
_______________________
▋ IMPLEMENTATION:
The indicator starts by drawing a Center Line that is selected by the user from a variety of common levels. Then, it draws a sequence of horizontal lines above and below the Center Line, which are sized based on the most confirmed average true range (ATR) at the selected higher timeframe.
In the top right corner of the chart, there is a table displaying both the selected ATR (in the right cell) and the ATR of the current bar (in the left cell). This feature enables users to compare these two values. It's important to note that the ATR of the current bar may not be confirmed yet, as the market is still active.
_______________________
▋ INDICATOR SETTINGS:
# Section (1): ATR Settings
(1) ATR Period & Smoothing.
(2) Timeframe where ATR value imported from.
(3) To show/hide the table comparison between the current ATR and the ATR for the selected period. Also, ability to color the current ATR cell if it’s greater.
# Section (2): Levels Settings
(1) Selecting a Center Line level among a variety of common levels, which is taken as reference level where a sequence of horizontal lines plot above and below it.
(2) Size of grid in ATR unit.
(3) Number of horizontal lines to plot in a single side.
(4) Grid Side. Ability to plot above or below the Center Line.
(5) Lines colors, and mode.
(6) Line style.
(7) Label style.
(8) Ability to remove old lines, from previous HTF.
_____________________
▋ COMMENT:
The ATR Levels should not be taken as a major concept to build a trading decision.
Please let me know if you have any questions.
Thank you.
アベレージ・トゥルー・レンジ (ATR)

Scalper's Volatility Filter [QuantraSystems]Scalpers Volatility Filter
Introduction
The 𝒮𝒸𝒶𝓁𝓅𝑒𝓇'𝓈 𝒱𝑜𝓁𝒶𝓉𝒾𝓁𝒾𝓉𝓎 𝐹𝒾𝓁𝓉𝑒𝓇 (𝒮𝒱𝐹) is a sophisticated technical indicator, designed to increase the profitability of lower timeframe trading.
Due to the inherent decrease in the signal-to-noise ratio when trading on lower timeframes, it is critical to develop analysis methods to inform traders of the optimal market periods to trade - and more importantly, when you shouldn’t trade.
The 𝒮𝒱𝐹 uses a blend of volatility and momentum measurements, to signal the dominant market condition - trending or ranging.
Legend
The 𝒮𝒱𝐹 consists of a signal line that moves above and below a central zero line, serving as the indication of market regime.
When the signal line is positioned above zero, it indicates a period of elevated volatility. These periods are more profitable for trading, as an asset will experience larger price swings, and by design, trend-following indicators will give less false signals.
Conversely, when the signal line moves below zero, a low volatility or mean-reverting market regime dominates.
This distinction is critical for traders in order to align strategies with the prevailing market behaviors - leveraging trends in volatile markets and exercising caution or implementing mean-reversion systems in periods of lower volatility.
Case Study
Here we can see the indicator's unique edge in action.
Out of the four potential long entries seen on the chart - displayed via bar coloring, two would result in losses.
However, with the power of the 𝒮𝒱𝐹 a trader can effectively filter false signals by only entering momentum-trades when the signal line is above zero.
In this small sample of four trades, the 𝒮𝒱𝐹 increased the win rate from 50% to 100%
Methodology
The methodology behind the 𝒮𝒱𝐹 is based upon three components:
By calculating and contrasting two ATR’s, the immediate market momentum relative to the broader, established trend is calculated. The original method for this can be credited to the user @xinolia
A modified and smoothed ADX indicator is calculated to further assess the strength and sustainability of trends.
The ‘Linear Regression Dispersion’ measures price deviations from a fitted regression line, adding further confluence to the signals representation of market conditions.
Together, these components synthesize a robust, balanced view of market conditions, enabling traders to help align strategies with the prevailing market environment, in order to potentially increase expected value and win rates.

Truncated ATRThis program uses SMA and Truncated Mean to calculate ATR.
A truncated mean or trimmed mean is a statistical measure of central tendency, much like the mean and median. It involves the calculation of the mean after discarding given parts of a probability distribution or sample at the high and low end, and typically discarding an equal amount of both.

Supertrend & CCI Strategy ScalpThis strategy is based on 2 Super Trend Indicators along with CCI .
The longer factor length gives you the current trend and the deviation in the short factor length gives us the opportunity to enter in the trade .
CCI indicator is used to determine the overbought and oversold levels.
Setup :
Long : When atrLength1 > close and atrLength2 < close and CCI < -100 we look for long trades as the longer factor length will be bullish .
Short : When atrLength1 < close and atrLength2 > close and CCI > 100 we look for short trades as the longer factor length will be bearish .
Please tune the settings according to your use .
Trade what you see not what you feel .
Please consult with your financial advisor before you deploy any real money for trading .

PresentTrend RMI Synergy - Strategy [presentTrading] █ Introduction and How it is Different
The "PresentTrend RMI Synergy Strategy" is the combined power of the Relative Momentum Index (RMI) and a custom presentTrend indicator. This strategy introduces a multifaceted approach, integrating momentum analysis with trend direction to offer traders a more nuanced and responsive trading mechanism.
BTCUSD 6h L/S Performance
Local
█ Strategy, How It Works: Detailed Explanation
The "PresentTrend RMI Synergy Strategy" intricately combines the Relative Momentum Index (RMI) and a custom SuperTrend indicator to create a powerful tool for traders.
🔶 Relative Momentum Index (RMI)
The RMI is a variation of the Relative Strength Index (RSI), but instead of using price closes against itself, it measures the momentum of up and down movements in price relative to previous prices over a given period. The RMI for a period length `N` is calculated as follows:
RMI = 100 - 100/ (1 + U/D)
where:
- `U` is the average upward price change over `N` periods,
- `D` is the average downward price change over `N` periods.
The RMI oscillates between 0 and 100, with higher values indicating stronger upward momentum and lower values suggesting stronger downward momentum.
RMI = 21
RMI = 42
For more information - RMI Trend Sync - Strategy :
🔶 presentTrend Indicator
The presentTrend indicator combines the Average True Range (ATR) with a moving average to determine trend direction and dynamic support or resistance levels. The presentTrend for a period length `M` and a multiplier `F` is defined as:
- Upper Band: MA + (ATR x F)
- Lower Band: MA - (ATR x F)
where:
- `MA` is the moving average of the close price over `M` periods,
- `ATR` is the Average True Range over the same period,
- `F` is the multiplier to adjust the sensitivity.
The trend direction switches when the price crosses the presentTrend bands, signaling potential entry or exit points.
presentTrend length = 3
presentTrend length = 10
For more information - PresentTrend - Strategy :
🔶 Strategy Logic
Entry Conditions:
- Long Entry: Triggered when the RMI exceeds a threshold, say 60, indicating a strong bullish momentum, and when the price is above the presentTrend, confirming an uptrend.
- Short Entry: Occurs when the RMI drops below a threshold, say 40, showing strong bearish momentum, and the price is below the present trend, indicating a downtrend.
Exit Conditions with Dynamic Trailing Stop:
- Long Exit: Initiated when the price crosses below the lower presentTrend band or when the RMI falls back towards a neutral level, suggesting a weakening of the bullish momentum.
- Short Exit: Executed when the price crosses above the upper presentTrend band or when the RMI rises towards a neutral level, indicating a reduction in bearish momentum.
Equations for Dynamic Trailing Stop:
- For Long Positions: The exit price is set at the lower SuperTrend band once the entry condition is met.
- For Short Positions: The exit price is determined by the upper SuperTrend band post-entry.
These dynamic trailing stops adjust as the market moves, providing a method to lock in profits while allowing room for the position to grow.
This strategy's strength lies in its dual analysis approach, leveraging RMI for momentum insights and presentTrend for trend direction and dynamic stops. This combination offers traders a robust framework to navigate various market conditions, aiming to capture trends early and exit positions strategically to maximize gains and minimize losses.
█ Trade Direction
The strategy provides flexibility in trade direction selection, offering "Long," "Short," or "Both" options to cater to different market conditions and trader preferences. This adaptability ensures that traders can align the strategy with their market outlook, risk tolerance, and trading goals.
█ Usage
To utilize the "PresentTrend RMI Synergy Strategy," traders should input their preferred settings in the Pine Script™ and apply the strategy to their charts. Monitoring RMI for momentum shifts and adjusting positions based on SuperTrend signals can optimize entry and exit points, enhancing potential returns while managing risk.
█ Default Settings
1. RMI Length: 21
The 21-period RMI length strikes a balance between capturing momentum and filtering out market noise, offering a medium-term outlook on market trends.
2. Super Trend Length: 7
A SuperTrend length of 7 periods is chosen for its responsiveness to price movements, providing a dynamic framework for trend identification without excessive sensitivity.
3. Super Trend Multiplier: 4.0
The multiplier of 4.0 for the SuperTrend indicator widens the trend bands, focusing on significant market moves and reducing the impact of minor fluctuations.
---
The "PresentTrend RMI Synergy Strategy" represents a significant step forward in trading strategy development, blending momentum and trend analysis in a unique way. By providing a detailed framework for understanding market dynamics, this strategy empowers traders to make more informed decisions.

Heiken Ashi Algo v6The Heiken Ashi Algo Oscillator v6, introduces a refined approach to technical analysis applicable across various markets. Central to this algorithm is the integration of the Relative Strength Index #RSI, a staple indicator renowned for its effectiveness in measuring momentum.
The RSI - Tried and True:
By incorporating the #RSI, traders gain valuable insights into the speed and strength of price movements, aiding in the identification of potential #trend #reversals and #continuations.
Why Heiken Ashi Candles:
Additionally, the utilization of #Heiken Ashi candles within this algorithm offers a smoother representation of price action, reducing noise and enhancing clarity in trend analysis. This feature is particularly advantageous in volatile markets, where traditional candlestick patterns may produce false signals. By employing Heiken #Ashi candles, traders can more accurately identify underlying trends and make informed decisions based on reliable price data.
Combining RSI and Heiken Ashi:
The synergy between the RSI and Heiken Ashi candles in the Heiken Ashi Algo Oscillator v6 provides traders with a comprehensive perspective on both momentum and trend direction. This combination allows for a nuanced analysis of market dynamics, enabling traders to navigate various market conditions with greater confidence.
Heiken Ashi Candle Sizes:
The size of the Heiken Ashi candles serves as a visual indicator of the distance the RSI has moved between closing prices, offering additional insights into momentum shifts.
Not your average Heiken Ashi Candles:
Ive taken the time to do some serious custom coding for these particular Heiken Ashi Candles.
They do NOT color as the normal ones do. There is a setting in the inputs tab of the indicator that allows you to color them according to my secret code where its looking for Breaks of Structure on lower timeframes based on Heiken Ashi Candle calculations.
Turning on this feature gives you a more promising array of candle colors telling you about false or positive breakouts and trends.
Why choose this tool:
CoffeeShopCrypto's Heiken Ashi Algo Oscillator v6 offers a balanced and effective tool for traders across different markets. By leveraging the power of the RSI and Heiken Ashi candles, traders can enhance their decision-making process, identify trading opportunities with greater precision, and ultimately improve their overall trading performance.
------------------------------------------HOW TO USE IT------------------------------------------
Inflow / Outflow (accumulation and distribution) Ribbon
In trading we know liquidity means volume and volume is orders. This ribbon shows you when orders are entering, exiting, filling or flat in the market.
The Liquidity Ribbon is a visual representation of whats happening with accumulation and distribution in the market.
It acts as a dynamic area of support and resistance for the RSI (momentum).
Once the RSI breaks above or below the full area of the ribbon, you have an overturned short term market.
Breaking this area isn't easy because of the one sided thick line known as the PoC line or Point of Control Line.
This line changes between a rising and falling color to tell you what side of the market has the most resistance or support.
Custom HA candles
The common way for HA candles to be colors is green for bullish and red for bearish.
These candles color differently according to market dynamics vs how the current candle closes.
This is helpful to keep you from taking longs or shorts when the momentum just doesn't have the move.
How it all works together: Taking entries and failed breakouts.
In the image below (left to right) you can see the following take place:
Short Entry:
HA Candles push down through the ribbon breaking below its low side (Support Ribbon Broken)
Following this the RSI RANGE is broken to the down side.
This is a good setup for a short breakout
Retrace to false breakout:
After this price retraces and so does momentum.
HA Candles attempt to but fail to break through the top of the ribbon and push back down . This is a false breakout.
Bullish Divergence to Long Entry:
The Heiken Ashi Algo forms a bullish divergence and HA candles push back up into the ribbon. Without a change in candle structure the RSI breaks the top of the ribbon where the control line sits as well as breaking through the top of the RANGE area and
This is a promising setup for a long trade.
Rally Base Rally: (into secondary long trade)
As price is rising, it retraces until HA candles are within the RANGE. No candle closes or has a low below the RSI midline.
HA Candles are forming a consolidation. After consolidation the RSI breaks out the top of the ribbon and the top of the RANGE allowing a secondary long entry.
-----------------------------------------------------------------------------------------
Im not gonna lie. Ive written a lot of tutorials but this one was probably the most exciting to describe.
If you have any questions please do ask below.

AI SuperTrend x Pivot Percentile - Strategy [PresentTrading]█ Introduction and How it is Different
The AI SuperTrend x Pivot Percentile strategy is a sophisticated trading approach that integrates AI-driven analysis with traditional technical indicators. Combining the AI SuperTrend with the Pivot Percentile strategy highlights several key advantages:
1. Enhanced Accuracy in Trend Prediction: The AI SuperTrend utilizes K-Nearest Neighbors (KNN) algorithm for trend prediction, improving accuracy by considering historical data patterns. This is complemented by the Pivot Percentile analysis which provides additional context on trend strength.
2. Comprehensive Market Analysis: The integration offers a multi-faceted approach to market analysis, combining AI insights with traditional technical indicators. This dual approach captures a broader range of market dynamics.
BTC 6H L/S Performance
Local
█ Strategy: How it Works - Detailed Explanation
🔶 AI-Enhanced SuperTrend Indicators
1. SuperTrend Calculation:
- The SuperTrend indicator is calculated using a moving average and the Average True Range (ATR). The basic formula is:
- Upper Band = Moving Average + (Multiplier × ATR)
- Lower Band = Moving Average - (Multiplier × ATR)
- The moving average type (SMA, EMA, WMA, RMA, VWMA) and the length of the moving average and ATR are adjustable parameters.
- The direction of the trend is determined based on the position of the closing price in relation to these bands.
2. AI Integration with K-Nearest Neighbors (KNN):
- The KNN algorithm is applied to predict trend direction. It uses historical price data and SuperTrend values to classify the current trend as bullish or bearish.
- The algorithm calculates the 'distance' between the current data point and historical points. The 'k' nearest data points (neighbors) are identified based on this distance.
- A weighted average of these neighbors' trends (bullish or bearish) is calculated to predict the current trend.
For more please check: Multi-TF AI SuperTrend with ADX - Strategy
🔶 Pivot Percentile Analysis
1. Percentile Calculation:
- This involves calculating the percentile ranks for high and low prices over a set of predefined lengths.
- The percentile function is typically defined as:
- Percentile = Value at (P/100) × (N + 1)th position
- Where P is the desired percentile, and N is the number of data points.
2. Trend Strength Evaluation:
- The calculated percentiles for highs and lows are used to determine the strength of bullish and bearish trends.
- For instance, a high percentile rank in the high prices may indicate a strong bullish trend, and vice versa for bearish trends.
For more please check: Pivot Percentile Trend - Strategy
🔶 Strategy Integration
1. Combining SuperTrend and Pivot Percentile:
- The strategy synthesizes the insights from both AI-enhanced SuperTrend and Pivot Percentile analysis.
- It compares the trend direction indicated by the SuperTrend with the strength of the trend as suggested by the Pivot Percentile analysis.
2. Signal Generation:
- A trading signal is generated when both the AI-enhanced SuperTrend and the Pivot Percentile analysis agree on the trend direction.
- For instance, a bullish signal is generated when both the SuperTrend is bullish, and the Pivot Percentile analysis shows strength in bullish trends.
🔶 Risk Management and Filters
- ADX and DMI Filter: The strategy uses the Average Directional Index (ADX) and the Directional Movement Index (DMI) as filters to assess the trend's strength and direction.
- Dynamic Trailing Stop Loss: Based on the SuperTrend indicator, the strategy dynamically adjusts stop-loss levels to manage risk effectively.
This strategy stands out for its ability to combine real-time AI analysis with established technical indicators, offering traders a nuanced and responsive tool for navigating complex market conditions. The equations and algorithms involved are pivotal in accurately identifying market trends and potential trade opportunities.
█ Usage
To effectively use this strategy, traders should:
1. Understand the AI and Pivot Percentile Indicators: A clear grasp of how these indicators work will enable traders to make informed decisions.
2. Interpret the Signals Accurately: The strategy provides bullish, bearish, and neutral signals. Traders should align these signals with their market analysis and trading goals.
3. Monitor Market Conditions: Given that this strategy is sensitive to market dynamics, continuous monitoring is crucial for timely decision-making.
4. Adjust Settings as Needed: Traders should feel free to tweak the input parameters to suit their trading preferences and to respond to changing market conditions.
█Default Settings and Their Impact on Performance
1. Trading Direction (Default: "Both")
Effect: Determines whether the strategy will take long positions, short positions, or both. Adjusting this setting can align the strategy with the trader's market outlook or risk preference.
2. AI Settings (Neighbors: 3, Data Points: 24)
Neighbors: The number of nearest neighbors in the KNN algorithm. A higher number might smooth out noise but could miss subtle, recent changes. A lower number makes the model more sensitive to recent data but may increase noise.
Data Points: Defines the amount of historical data considered. More data points provide a broader context but may dilute recent trends' impact.
3. SuperTrend Settings (Length: 10, Factor: 3.0, MA Source: "WMA")
Length: Affects the sensitivity of the SuperTrend indicator. A longer length results in a smoother, less sensitive indicator, ideal for long-term trends.
Factor: Determines the bandwidth of the SuperTrend. A higher factor creates wider bands, capturing larger price movements but potentially missing short-term signals.
MA Source: The type of moving average used (e.g., WMA - Weighted Moving Average). Different MA types can affect the trend indicator's responsiveness and smoothness.
4. AI Trend Prediction Settings (Price Trend: 10, Prediction Trend: 80)
Price Trend and Prediction Trend Lengths: These settings define the lengths of weighted moving averages for price and SuperTrend, impacting the responsiveness and smoothness of the AI's trend predictions.
5. Pivot Percentile Settings (Length: 10)
Length: Influences the calculation of pivot percentiles. A shorter length makes the percentile more responsive to recent price changes, while a longer length offers a broader view of price trends.
6. ADX and DMI Settings (ADX Length: 14, Time Frame: 'D')
ADX Length: Defines the period for the Average Directional Index calculation. A longer period results in a smoother ADX line.
Time Frame: Sets the time frame for the ADX and DMI calculations, affecting the sensitivity to market changes.
7. Commission, Slippage, and Initial Capital
These settings relate to transaction costs and initial investment, directly impacting net profitability and strategy feasibility.

ATR Based Support and Resistance Zones [UAlgo]🔶 ATR Based Support and Resistance Indicator 🔶
The ATR Based Support and Resistance Indicator is a technical tool designed for TradingView users to analyze and visualize support and resistance levels based on the Average True Range (ATR) indicator. ATR is a widely used volatility indicator that measures the average trading range of an asset over a specified period. This indicator utilizes ATR values to dynamically calculate and display support and resistance zones on the price chart.
🔶 Indicator Settings
ATR Length: This setting allows users to specify the length of the period over which the ATR indicator is calculated. A longer period results in a smoother ATR value, providing a broader view of market volatility.
ATR Multiplier: The ATR multiplier enables users to adjust the sensitivity of the support and resistance zones. Increasing the multiplier widens the zones, while decreasing it narrows them, allowing traders to customize the indicator according to their trading preferences and market conditions.
🔶 Key Features
Trend Identification: The indicator identifies potential support and resistance zones based on the relationship between the ATR values and the price action. When the current ATR value exceeds a certain threshold determined by the ATR multiplier, it indicates a significant price movement, potentially signaling a trend reversal or continuation.
Impulse Detection: The indicator detects impulses in price movement by comparing the current ATR value with the previous value. An impulse is identified when the current ATR value is greater than or equal to the previous value, indicating a sudden surge in market volatility.
Bearish Impulse Example :
Bullish Impulse Example:
Color-Coded Impulses: Impulse candles are color-coded for easy visualization of bullish (green) and bearish (red) impulses. This feature helps traders quickly identify potential trading opportunities and market trends.
Wick Percentage Calculation: The indicator calculates the percentage of the wick length relative to the true range of each candle. Users can specify a threshold percentage, and when the wick percentage exceeds this threshold, it indicates a potential support or resistance zone.
Support and Resistance Zones: The indicator plots support and resistance zones based on the calculated wick percentage. These zones are visualized as rectangular boxes on the price chart, highlighting areas where price reversals or significant price movements are likely to occur.
Customizable Styling: Users can customize the styling of support and resistance zones, including line style, width, border color, and background color. This flexibility allows traders to adapt the indicator's visual appearance to their personal preferences and trading strategies.
🔶 Usage
Traders can utilize the ATR Based Support and Resistance Indicator in various ways :
Trend Direction Analysis: By observing the color-coded impulse candles, traders can identify the prevailing trend direction (bullish or bearish) based on the frequency and magnitude of impulses.
Entry and Exit Signals: Traders can use the detected support and resistance zones as potential entry and exit points for their trades. When price approaches these zones, it may indicate a trading opportunity or signal the need to adjust stop-loss or take-profit levels.
Confirmation Tool: The indicator serves as a confirmation tool for identifying potential reversal or continuation signals in conjunction with other technical indicators or trading strategies.

ATR Percentage ValuesThis indicator is created to give you the daily ATR 2% and 10% values for any product that you are looking at. The way the indicator is designed is to only show the most recent 2 and 10 percent values on any chart and will not show you any other number. If you are hovering over price that occurred in the past it will show zeros on the values. To get the right values, take your mouse off of the chart and it will show you the values.
The way this indicator is coded will give you the daily ATR numbers no matter what chart timeframe you are currently looking at. The idea is to save time and make sure you do not make a mistake getting the wrong value.
*** To make this show up on the status line, click on the settings, click on the style box and check the box "VALUES IN STATUS LINE" ****

ATR Divergences [UAlgo]Divergence is a concept in financial markets that highlights inconsistencies between the price of an asset and a given indicator. This script focuses on identifying divergences using the Average True Range (ATR). Divergence occurs when there is a disparity between the direction of the price and the oscillator, providing valuable insights for traders anticipating potential trend reversals.
This script employs pivot points (with using High-Low values of the candles) to identify potential divergences between the oscillator (ATR) and price movements. Here's how each type of divergence is determined:
Key Features:
Regular Bullish Divergence:
Oscillator registers a higher low.
Price records a lower low.
Indicative of potential upward reversal.
Hidden Bullish Divergence:
Oscillator indicates a lower low.
Price exhibits a higher low.
Signals a concealed bullish continuation pattern.
Regular Bearish Divergence:
Oscillator shows a lower high.
Price marks a higher high.
Suggests a possible downward reversal.
Hidden Bearish Divergence:
Oscillator reflects a higher high.
Price displays a lower high.
Indicates a hidden bearish continuation pattern.
Usage and Customization:
ATR Length: Adjustable parameter for customizing the Average True Range calculation period.
Plot Options: Choose to display Regular Bullish, Hidden Bullish, Regular Bearish, and/or Hidden Bearish divergences.
Wait for Candle Close: Option to wait for candle closure before plotting signals.
How to Interpret:
Regular divergences may indicate potential trend reversals, while hidden divergences suggest a continuation of the current trend. Traders can leverage these signals to make informed decisions in their trading strategies.
Feel free to customize the parameters based on your trading preferences. Happy Trading!

RVOL/ExpVol/ATR/ExpRGives 4 values:
- Relative Volume: needs the first 5M candle to have closed to give a good value then updates every 5 minute throughout the day. Compares to the historical Volume on the last 30 days on the SAME time period from Open.
Most indicators compare to the average volume on any 30min period, thus highly overestimating the RVOL at Open when Volume is higher.
- Expected Volume on the day in Million of shares given the RVOL.
- Average True Range on the last 14 days
- Expected Range on the day given the ATR & the RVOL.
Warning: Expected Range is just an estimation from data I gathered but the Day's range can be way higher or lower than that. Also if RVOL > 3 then the estimation works less & less.
As this was originally coded just for me I don't ask user input for things like the lookback period or the refresh period. You have to make a copy & go in the code and modify it if you want to change it.
Also the data displayed is given for the candle on which your cursor is !
Works best on 5-minute and above chart timeframes.

Volatility Spectrum - Whvntr"Volatility Spectrum" is a useful technical indicator crafted for traders who prioritize precision in volatility analysis. This tool revolutionizes the traditional Average True Range (ATR) concept by offering a nuanced, multi-faceted view of market volatility.
Key Features:
Enhanced Volatility Insights: Seamlessly integrates standard ATR with an average ATR for a more detailed volatility analysis.
Customizable Parameters: Users can tailor the ATR and average ATR lengths to align with various trading styles and timeframes.
Multiple Smoothing Techniques: Options like RMA, SMA, EMA, or WMA are available to customize the ATR's responsiveness.
Dynamic Color Indicators: Unique color gradients visually represent different levels of volatility, aiding in quick and effective analysis.
Configurable Volatility Alerts: Set up alerts for specific high or low volatility conditions to assist in making informed decisions.
Intuitive Backgrounds: The background color shifts in response to volatility levels, offering an instant read on market dynamics .
Personalized Color Settings: Customize the color scheme for high and low volatility indicators to fit personal preferences and trading dashboards.
When and Where to Use:
Diverse Market Application: Suitable for various markets, including stocks, forex, and commodities.
Strategy Enhancement: Integrates with trading strategies for improved risk management and optimized entry/exit points.
Adaptable for All Trading Styles: Effective for both short-term day trading and long-term investment approaches.
Informed Trading Decisions: Best used in conjunction with other indicators for a well-rounded approach to volatility-based trading.
"Volatility Spectrum" is an essential tool for traders looking to enrich their understanding of market volatility. Its adaptability and depth make it a valuable component in any trader's toolkit, suitable for a range of markets and trading strategies.
"While 'Volatility Spectrum' provides valuable insights into market volatility, its indications should not be interpreted as definitive predictions or guarantees of future market behavior."

FlexiMA x FlexiST - Strategy [presentTrading]█ Introduction and How it is Different
The FlexiMA x FlexiST Strategy blends two analytical methods - FlexiMA and FlexiST, which are opened in my early post.
- FlexiMA calculates deviations between an indicator source and a dynamic moving average, controlled by a starting factor and increment factor.
- FlexiST, on the other hand, leverages the SuperTrend model, adjusting the Average True Range (ATR) length for a comprehensive trend-following oscillator.
This synergy offers traders a more nuanced and multifaceted tool for market analysis.
BTC 6H L/S Performance
Local
█ Strategy, How It Works: Detailed Explanation
The strategy combines two components: FlexiMA and FlexiST, each utilizing unique methodologies to analyze market trends.
🔶FlexiMA Component:
- Calculates deviations between an indicator source and moving averages of variable lengths.
- Moving average lengths are dynamically adjusted using a starting factor and increment factor.
- Deviations are normalized and analyzed to produce median and standard deviation values, forming the FlexiMA oscillator.
Length indicator (50)
🔶FlexiST Component:
- Uses SuperTrend indicators with varying ATR (Average True Range) lengths.
- Trends are identified based on the position of the indicator source relative to the SuperTrend bands.
- Deviations between the indicator source and SuperTrend values are calculated and normalized.
Starting Factor (5)
🔶Combined Strategy Logic:
- Entry Signals:
- Long Entry: Triggered when median values of both FlexiMA and FlexiST are positive.
- Short Entry: Triggered when median values of both FlexiMA and FlexiST are negative.
- Exit Signals:
- Long Exit: Triggered when median values of FlexiMA or FlexiST turn negative.
- Short Exit: Triggered when median values of FlexiMA or FlexiST turn positive.
This strategic blend of FlexiMA and FlexiST allows for a nuanced analysis of market trends, providing traders with signals based on a comprehensive view of market momentum and trend strength.
█ Trade Direction
The strategy is designed to cater to various trading preferences, offering "Long", "Short", and "Both" options. This flexibility allows traders to align the strategy with their specific market outlook, be it bullish, bearish, or a combination of both.
█ Usage
Traders can effectively utilize the FlexiMA x FlexiST Strategy by first selecting their desired trade direction. The strategy then generates entry signals when the conditions for either the FlexiMA or FlexiST are met, indicating potential entry points in the market. Conversely, exit signals are generated when the conditions for these indicators diverge, thus signaling a potential shift in market trends and suggesting a strategic exit point.
█ Default Settings
1. Indicator Source (HLC3): Provides a balanced and stable price source, reducing the impact of extreme market fluctuations.
2. Indicator Lengths (20 for FlexiMA, 10 for FlexiST): Longer FlexiMA length smooths out short-term fluctuations, while shorter FlexiST length allows for quicker response to market changes.
3. Starting Factors (1.0 for FlexiMA, 0.618 for FlexiST): Balanced start for FlexiMA and a harmonized approach for FlexiST, resonating with natural market cycles.
4. Increment Factors (1.0 for FlexiMA, 0.382 for FlexiST): FlexiMA captures a wide range of market behaviors, while FlexiST provides a gradual transition to capture finer trend shifts.
5. Normalization Methods ('None'): Uses raw deviations, suitable for markets where absolute price movements are more significant.
6. Trade Direction ('Both'): Allows strategy to consider both long and short opportunities, ideal for versatile market engagement.
*More details:
1. FlexiMA
2. FlexiST

ATR TrendTL;DR - An average true range (ATR) based trend
ATR trend uses a (customizable) ATR calculation and highest high & lowest low prices to calculate the actual trend. Basically it determines the trend direction by using highest high & lowest low and calculates (depending on the determined direction) the ATR trend by using a ATR based calculation and comparison method.
The indicator will draw one trendline by default. It is also possible to draw a second trendline which shows a 'negative trend'. This trendline is calculated the same way the primary trendline is calculated but uses a negative (-1 by default) value for the ATR calculation. This trendline can be used to detect early trend changes and/or micro trends.
How to use:
Due to its ATR nature the ATR trend will show trend changes by changing the trendline direction. This means that when the price crosses the trendline it does not automatically mean a trend change. However using the 'negative trend' option ATR trend can show early trend changes and therefore good entry points.
Some notes:
- A (confirmed) trend change is shown by a changing color and/or moving trendline (up/down)
- Unlike other indicators the 'time period' value is not the primary adjustment setting. This value is only used to calculate highest high & lowest low values and has medium impact on trend calculation. The primary adjustment setting is 'ATR weight'
- Every settings has a tooltip with further explanation
- I added additional color coding which uses a different color when the trend attempts to change but the trend change isn't confirmed (yet)
- Default values work fine (at least in my back testing) but the recommendation is to adjust the settings (especially ATR weight) to your trading style
- You can further finetune this indicator by using custom moving average types for the ATR calculation (like linear regression or Hull moving average)
- Both trendlines can be used to determine future support and resistance zones
- ATR trend can be used as a stop loss finder
- Alerts are using buy/sell signals
- You can use fancy color filling ;)
Happy trading!
Daniel

Relative Strength Trend Indicator (RSTI)This indicator is called the "Relative Strength Trend Indicator" (RSTI), designed to assess the relative strength of a trend.
Here is a detailed explanation of how it works and how traders can interpret it:
Indicator Operation:
1. Data Source (src): The indicator considers a data source, typically the closing price (close), but this can be adjusted according to the trader's preferences.
2. Period Length (Length): This determines the period used to calculate the simple moving average (SMA) of the data source. A longer period smoothes the indicator, while a shorter period makes it more responsive.
3. Multiplier (Multiplier): This is a multiplication factor applied to the Average True Range (ATR), adjusting the width of the bands.
4. Signal Length (Signal Length): This period is used to calculate the simple moving average of the relative strength (l_strength). It determines the sensitivity of the signal to changes in relative strength.
Interpretation of the Indicator:
1. Upper Strength Band (Upper Level): This line is drawn at 80 and represents a high strength level. When relative strength exceeds this value, it may indicate a potential overbought market.
2. Lower Strength Band (Lower Level): This line is drawn at 20 and represents a low strength level. When relative strength is below this value, it may indicate a potential oversold market.
3. RSTI Strength: The main line of the indicator, representing the calculated relative strength. When this line exceeds 50, it may indicate an uptrend, while a value below 50 may indicate a downtrend.
4. Filling Zones: These colored zones between levels 80 and 50, and between 50 and 20, can help quickly visualize relative strength. A colored zone above 50 indicates positive strength, while a colored zone below 50 indicates negative strength.
Qualities of the Indicator:
1. Adaptability: The use of ATR and the flexibility of parameters (length, multiplier, signal_length) allow the indicator to adapt to different market conditions.
2. Visual Clarity: Colored filling zones and horizontal lines make it easy to visualize relative strength levels.
3. Strength Signal: The signal line (RSTI Strength) allows traders to quickly spot changes in relative strength, facilitating decision-making.
4. Responsiveness: The combination of smoothed moving averages and relative strength indicators allows responsiveness to trend changes while reducing false signals.
It is essential to note that while this indicator can provide valuable insights, it is always recommended to use it in conjunction with other technical analysis tools for informed decision-making.

FlexiSuperTrend - Strategy [presentTrading]█ Introduction and How it is Different
The "FlexiSuperTrend - Strategy" by PresentTrading is a cutting-edge trading strategy that redefines market analysis through the integration of the SuperTrend indicator and advanced variance tracking.
BTC 6H L/S
This strategy stands apart from conventional methods by its dynamic adaptability, capturing market trends and momentum shifts with increased sensitivity. It's designed for traders seeking a more responsive tool to navigate complex market movements.
Local
█ Strategy, How It Works: Detailed Explanation
The "FlexiSuperTrend - Strategy" employs a multifaceted approach, combining the adaptability of the SuperTrend indicator with variance tracking. The strategy's core lies in its unique formulation and application of these components:
🔶 SuperTrend Polyfactor Oscillator:
- Basic Concept: The oscillator is a series of SuperTrend calculations with varying ATR lengths and multipliers. This approach provides a broader and more nuanced perspective of market trends.
- Calculation:
- For each iteration, `i`, the SuperTrend is calculated using:
- `ATR Length = indicatorLength * (startingFactor + i * incrementFactor)`.
- `Multiplier = dynamically adjusted based on market conditions`.
- The SuperTrend output for each iteration is compared with the indicator source (like hlc3), and the deviation is recorded.
SuperTrend Calculation:
- `Upper Band (UB) = hl2 + (ATR Length * Multiplier)`
- `Lower Band (LB) = hl2 - (ATR Length * Multiplier)`
- Where `hl2` is the average of high and low prices.
Deviation Calculation:
- `Deviation = indicatorSource - SuperTrend Value`
- This value is calculated for each SuperTrend setting in the oscillator series.
🔶 Indicator Source (`hlc3`):
- **Usage:** The strategy uses the average of high, low, and close prices, providing a balanced representation of market activity.
🔶 Adaptive ATR Lengths and Factors:
- Dynamic Adjustment: The strategy adjusts the ATR length and multiplier based on the `startingFactor` and `incrementFactor`. This adaptability is key in responding to changing market volatilities.
- Equation: ATR Length at each iteration `i` is given by `len = indicatorLength * (startingFactor + i * incrementFactor)`.
incrementFactor - 1
incrementFactor - 2
🔶 Normalization Methods:
Purpose: To standardize the deviations for comparability.
- Methods:
- 'Max-Min': Scales the deviation based on the range of values.
- 'Absolute Sum': Uses the sum of absolute deviations for normalization.
Normalization 'Absolute Sum'
- For 'Max-Min': `Normalized Deviation = (Deviation - Min(Deviations)) / (Max(Deviations) - Min(Deviations))`
- For 'Absolute Sum': `Normalized Deviation = Deviation / Sum(Absolute(Deviations))`
🔶 Trading Logic:
The strategy integrates the SuperTrend indicator, renowned for its effectiveness in identifying trend direction and reversals. The SuperTrend's incorporation enhances the strategy's ability to filter out false signals and confirm genuine market trends. * The SuperTrend Toolkit is made by @QuantiLuxe
- Long Entry Conditions: A buy signal is generated when the current trend, as indicated by the SuperTrend Polyfactor Oscillator, turns positive.
- Short Entry Conditions: A sell signal is triggered when the current trend turns negative.
- Entry and Exit Strategy: The strategy opens or closes positions based on these signals, aligning with the selected trade direction (long, short, or both).
█ Trade Direction
The strategy is versatile, allowing traders to choose their preferred trading direction: long, short, or both. This flexibility enables traders to tailor their strategies to their market outlook and risk appetite.
█ Usage
The FlexiSuperTrend strategy is suitable for various market conditions and can be adapted to different asset classes and time frames. Traders should set the strategy parameters according to their risk tolerance and trading goals. It's particularly useful for capturing long-term movements, ideal for swing traders, yet adaptable for short-term trading strategies.
█ Default Settings
1. Trading Direction: Choose from "Long", "Short", or "Both" to define the trade type.
2. Indicator Source (HLC3): Utilizes the HLC3 as the primary price reference.
3. Indicator Length (Default: 10): Influences the moving average calculation and trend sensitivity.
4. Starting Factor (0.618): Initiates the ATR length, influenced by Fibonacci ratios.
5. Increment Factor (0.382): Adjusts the ATR length incrementally for dynamic trend tracking.
6. Normalization Method: Options include "None", "Max-Min", and "Absolute Sum" for scaling deviations.
7. SuperTrend Settings: Varied ATR lengths and multipliers tailor the indicator's responsiveness.
8. Additional Settings: Features mesh style plotting and customizable colors for visual distinction.
The default settings provide a balanced approach, but users are encouraged to adjust them based on their individual trading style and market analysis.

Universal Volatility IndexThe Universal Volatility Index (UVI) is a robust indicator designed to gauge market volatility across various asset classes. By synthesizing multiple volatility measures, the UVI offers traders a nuanced understanding of market dynamics, aiding in the assessment of risk and the decision-making process.
How It Works:
The UVI incorporates three key components to calculate a composite volatility score:
Average True Range (ATR): This represents the average volatility over the specified period, giving a base measure of market movement.
Bollinger Bands Width: Highlights the expansion or contraction of price ranges, offering insights into market volatility relative to recent price action.
Rate of Change (ROC): Captures the momentum or the velocity of price changes, adding a temporal dimension to volatility assessment.
By combining these components, the UVI delivers a singular volatility metric that adapts to changing market conditions, providing a valuable tool for traders in any market.
Usage:
To apply the UVI to your chart, add the indicator from the Pine Script library and adjust the input parameters as desired.
The plot will display a line representing the composite volatility score, with higher values indicating increased market volatility and lower values suggesting calmer market conditions.
Benefits:
The UVI is versatile and can be applied to any market, making it a universal tool for traders.
The indicator helps in identifying periods of high risk where tighter risk management may be warranted.
It assists in pinpointing potential breakouts when volatility is expanding after a period of consolidation.
Compliance with TradingView House Rules:
This script is provided for educational purposes and does not constitute financial advice. It has been created to contribute to the TradingView community by offering a versatile tool that helps traders understand and navigate market volatility.

Session Breakout Scalper Trading BotHi Traders !
Introduction:
I have recently been exploring the world of automated algorithmic trading (as I prefer more objective trading strategies over subjective technical analysis (TA)) and would like to share one of my automation compatible (PineConnecter compatible) scripts “Session Breakout Scalper”.
The strategy is really simple and is based on time conditional breakouts although has more ”relatively” advanced optional features such as the regime indicators (Regime Filters) that attempt to filter out noise by adding more confluence states and the ATR multiple SL that takes into account volatility to mitigate the down side risk of the trade.
What is Algorthmic Trading:
Firstly what is algorithmic trading? Algorithmic trading also known as algo-trading, is a method of using computer programs (in this case pine script) to execute trades based on predetermined rules and instructions (this trading strategy). It's like having a robot trader who follows a strict set of commands to buy and sell assets automatically, without any human intervention.
Important Note:
For Algorithmic trading the strategy will require you having an essential TV subscription at the minimum (so that you can set alerts) plus a PineConnecter subscription (scroll down to the .”How does the strategy send signals” headings to read more)
The Strategy Explained:
Is the Time input true ? (this can be changed by toggling times under the “TRADE MEDIAN TIMES” group for user inputs).
Given the above is true the strategy waits x bars after the session and then calculates the highest high (HH) to lowest low (LL) range. For this box to form, the user defined amount of bars must print after the session. The box is symmetrical meaning the HH and LL are calculated over a lookback that is equal to the sum of user defined bars before and after the session (+ 1).
The Strategy then simultaneously defines the HH as the buy level (green line) and the LL as the sell level (red line). note the strategy will set stop orders at these levels respectively.
Enter a buy if price action crosses above the HH, and then cancel the sell order type (The opposite is true for a stop order).
If the momentum based regime filters are true the strategy will check for the regime / regimes to be true, if the regime if false the strategy will exit the current trade, as the regime filter has predicted a slowing / reversal of momentum.
The image below shows the strategy executing these trading rules ( Regime filters, "Trades on chart", "Signal & Label" and "Quantity" have been omitted. "Strategy label plots" has been switched to true)
Other Strategy Rules:
If a new session (time session which is user defined) is true (blue vertical line) and the strategy is currently still in a trade it will exit that trade immediately.
It is possible to also set a range of percentage gain per day that the strategy will try to acquire, if at any point the strategy’s profit is within the percentage range then the position / trade will be exited immediately (This can be changed in the “PERCENT DAY GAIN” group for user inputs)
Stops and Targets:
The strategy has either static (fixed) or variable SL options. TP however is only static. The “STRAT TP & TP” group of user inputs is responsible for the SL and TP values (quoted in pips). Note once the ATR stop is set to true the SL values in the above group no longer have any affect on the SL as expected.
What are the Regime Filters:
The Larry Williams Large Trade Index (LWLTI): The Larry Williams Large Trade Index (LWTI) is a momentum-based technical indicator developed by iconic trader Larry Williams. It identifies potential entries and exits for trades by gauging market sentiment, particularly the buying and selling pressure from large market players. Here's a breakdown of the LWTI:
LWLTI components and their interpretation:
Oscillator: It oscillates between 0 and 100, with 50 acting as the neutral line.
Sentiment Meter: Values above 75 suggest a bearish market dominated by large selling, while readings below 25 indicate a bullish market with strong buying from large players.
Trend Confirmation: Crossing above 75 during an uptrend and below 25 during a downtrend confirms the trend's continuation.
The Andean Oscillator (AO) : The Andean Oscillator is a trend and momentum based indicator designed to measure the degree of variations within individual uptrends and downtrends in the prices.
Regime Filter States:
In trading, a regime filter is a tool used to identify the current state or "regime" of the market.
These Regime filters are integrated within the trading strategy to attempt to lower risk (equity volatility and/or draw down). The regime filters have different states for each market order type (buy and sell). When the regime filters are set to true, if these regime states fail to be true the trade is exited immediately.
For Buy Trades:
LWLTI positive momentum state: Quotient of the lagged trailing difference and the ATR > 50
AO positive momentum state: Bull line > Bear line (signal line is omitted)
For Sell Trades:
LWLTI negative momentum stat: Quotient of the lagged trailing difference and the ATR < 50
AO negative momentum state: Bull line < Bear line (signal line is omitted)
How does the Strategy Send Signals:
The strategy triggers a TV alert (you will neet to set a alert first), TV then sends a HTTP request to the automation software (PineConnecter) which receives the request and then communicates to an MT4/5 EA to automate the trading strategy.
For the strategy to send signals you must have the following
At least a TV essential subscription
This Script added to your chart
A PineConnecter account, which is paid and not free. This will provide you with the expert advisor that executes trades based on these strategies signals.
For more detailed information on the automation process I would recommend you read the PineConnecter documentation and FAQ page.
Dashboard:
This Dashboard (top right by defualt) lists some simple trading statistics and also shows when a trade is live.
Important Notice:
- USE THIS STRATEGY AT YOUR OWN RISK AND ALWAYS DO YOUR OWN RESEARCH & MANUAL BACKTESTING !
- THE STRATEGY WILL NOT EXHIBIT THE BACKTEST PERFORMANCE SEEN BELOW IN ALL MARKETS !

EXOFADEEXOFADE is an incredible trading indicator designed help give traders a visual clue of price momentum by combining Linear regression calculations with volume.
Overview:
ExoFade is a unique and dynamic trading indicator designed for both beginner and professional traders. At its core, it uses a sophisticated blend of multiple linear regression analysis, incorporating price, time, and volume-weighted moving average (VWMA) to predict potential price movements. By analyzing these key factors, EXOFade offers an innovative approach to understanding market trends and identifying trade opportunities.
Why It Works:
ExoFade works by calculating a regression line that adapts to market conditions, factoring in both price trends and trading volumes. This approach provides a more nuanced view of market momentum, going beyond traditional price-only indicators. The inclusion of time as a variable offers unique insights into market dynamics, making ExoFade a valuable tool for various trading strategies.
Key Features to Look Out For:
Regression Line: The heart of ExoFade, offering visual cues about the market's direction.
ATR-Based Fade Levels: Utilizes Average True Range (ATR) to set dynamic levels that signal potential reversals or continuation. The indicator comes with three fade levels, which are described below
Alert Conditions: You can set up for alerts for when any of the fade levels have been been reached, indicating potential entry points.
What Are Fade Levels And How To Use The Enter Trades:
The exofade line always moves with price, this indicates that the current volume is moving in the same direction.
When you see the exofade start to move ahead of price. For example, in an Uptrend, if price stops making new highs and you see the exofade line continue moving up ahead of price as price stagnates, this is the first time that you should be expecting pull back or reversal. When the line starts to visibly curve, this when you want to enter the trade.
Sometimes, the exofade line will move just a little bit ahead of price, and sometimes it will move a clear distance ahead of price.
From my experience, the further ahead it moves from price without price keeping up, the higher the probability of a pullback or reversal.
The actual pullback then starts when the exofade line starts to curve, which signifies the start if the actual pullback.
Since we cannot sit and watch for when the line has either moved further ahead enough or started to curve, thats why i figured to use ATR as the best way to measure the distance the exofade line moves ahead of price and the ATR also happens to measure Volatility, which makes it a perfect match.
From forward testing this for months, i have found the pullbacks typically start when the exofade line has moved ahead of price by atleast 2 ATR's. A distance of 2 ATR and above are the ones i consider the best setups. This also marks the point for your stop loss, since 2 ATR is generally used stoploss level.
To catch and sell a pullback in an uptrend, you can set alert for one or both of these alerts
Fade Level 2 abv price - This alert will trigger once Exofade line reached 2 ATR ABOVE price (Just means it has reached 2 atr, dosent mean it has started curving yet)
Curve lvl 2 - SELL - This alert means the exofade line has started to curve at 2 ATR
To buy pullbacks in a downtrend you set the opposite alerts of the one above for curve below price
There are also same alerts for level 3 as well, which is 2.5 ATR
IMPORTANT NOTES - DONT SKIP THIS
For daily and intra-day swings - Use this on 1hr trend upwards - The exofade line much slower on higher timeframe, so when you get a curve on a high time frame, like the 4HR or Daily timeframe, those are excellent signals
For scalpers trading 1hr below - The exofade moves faster on lower timeframes, so more caution should be used with these on lower timeframes , you this with other confluences like a good momentum oscillator oversold/overbought regions StochRSI, MACD etc
EXTRA TIPS
- Since the curve forms slower on higher time frames, it means getting a curve the on daily and weekly chart can help in your trend analysis to detect early signs of potential trend reversals
-I typically pair this with my customized version of Nadaraya watsons envelope ( a free indicator on tradingview) It will further improve your entry and winrate. Biggest advantage is for setting a profit target. In a buy trade for example, you buy the curve below price and set your profit target for the top band of the nadaraya watson envelope. Very efficient for scalping
- Unique areas were you want to pay attention to the exofade is when price enters points of interest, this depending on your trading style could be a
-FVG - fair value gaps
-Order blocks
- Supply / Demand areas
-Volume profile Value area High and Value area Low
The are two scenarios i would like you to be cautious of
1. As with every indicator and strategy, i most definitely wouldn't use this during high impact news.
2. If price is trending very strongly in one direction only, such that even barely gives any decent pull backs at all. Most especially if that strong push is happening between the 4hr to Daily time frame. Do not attempt to counter those trends unless you know what you are doing. Its not advisable.
Instead i'll recommend using the Exofade to catch an entry in the direction of the trade for a continuation.
And Lastly
Since this indicator uses VOLUME data as part of its calculations. It will not work on any pairs that tradingview does not provide volume data for, like Gold. But it will work normally on Gold Futures, since that has volume data

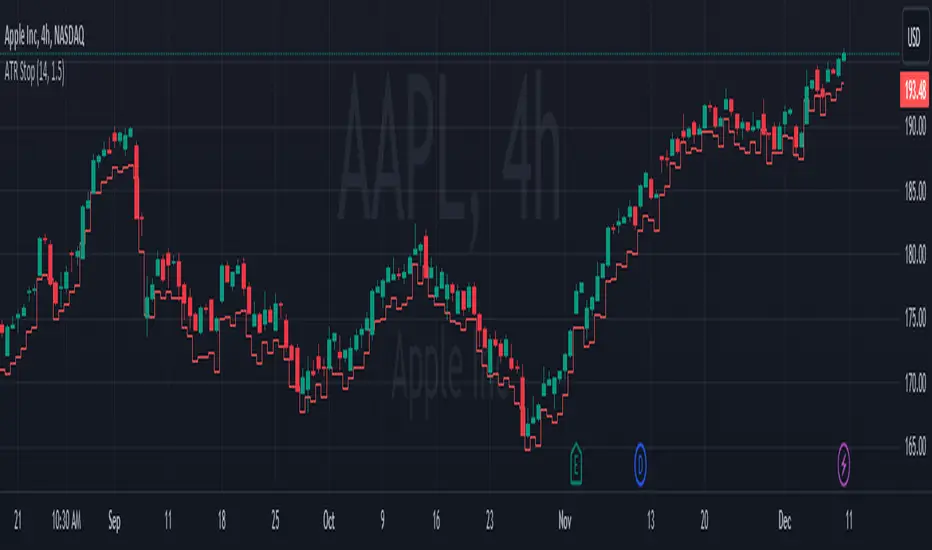
ATR StopThe "ATR Stop" indicator is designed to provide traders with insights into potential stop levels based on Average True Range (ATR) calculations specifically tailored for profitable (green candles) and unprofitable (red candles) price movements. This tool aims to assist traders in identifying potential stop levels that adjust dynamically based on the volatility of distinct market conditions.
The indicator functions by calculating two types of ATR: one for profitable movements and the other for unprofitable movements. The Average True Range is calculated separately for green and red candles, allowing users to assess potential stop levels more accurately based on the nature of price movements.
Key features of the "ATR Stop" indicator include:
Custom ATR Calculation: It calculates the ATR for profitable (green) and unprofitable (red) movements separately, considering only specific candle types based on their closing price relative to their opening price.
Dynamic Multiplier: Users can adjust the multiplier to fine-tune the sensitivity of the ATR-based stop levels, accommodating different risk preferences and market conditions.
Clear Visualization: The indicator plots the ATR levels for profitable (green) and unprofitable (red) movements one candle ahead on the chart, providing a visual representation of potential stop levels.
To use the indicator effectively, traders can adjust the ATR length and multiplier parameters based on their trading strategies and risk management preferences. By considering distinct price movements, this tool can assist in setting more informed stop levels in varying market conditions.
Please note that while the "ATR Stop" indicator can be a valuable addition to a trader's toolbox, it should be used in conjunction with other technical analysis tools and risk management strategies to make well-informed trading decisions.
Nasan Rate of Change (ROC)**NOTE: FOR COMPARISON TRADITIONAL ROC IS PLOTTED WITH THE SAME ROC LENGTH OF 9. IT IS NOT PART OF THE INDICATOR"
The Nasan ROC indicator is smoothed version of the of the traditional ROC indicator. The Nasna ROC uses a triple pass moving average differencing strategy. A cumulative sum of the deviations obtained from the moving average differencing provides a smooth "noise free" trend and this cumulative sum of deviations is used for calculating ROC.
Let's break down the components and understand the indicator we discussed earlier:
Sequential Triple Pass Filter:
Three filters with lengths specified by length1, length2, and length3 are applied to the closing prices (close).
The filters involve calculating the cumulative sum of the differences between the closing prices and their respective moving averages.
The idea is to detrend the data and accumulate the deviations from the average over time, emphasizing longer-term trends.
Calculation of Rate of Change (ROC) of Cumulative Sum:
The Rate of Change (ROC) of the cumulative sum (rocCumulativeSum) is calculated using the ta.roc function with a specified length (rocLength).
ROC measures the percentage change in the cumulative sum over a specified period.
The ROC histogram provides insights into the momentum of the detrended series. Positive values suggest increasing momentum, while negative values suggest decreasing momentum.
Pay attention to the color of the histogram bars.
The histogram bars are colored green if the current ROC value is greater than or equal to the previous ROC value, and red otherwise.
This coloring is based on the concept that a positive ROC suggests upward momentum, while a negative ROC suggests downward momentum.
Volatility - Volume Impact:
The Average True Range (ATR) is calculated with a period of 14.
Volume strength is calculated as a factor (VCF) that considers the ratio of the simple moving average (SMA) of the current volume to the SMA of the volume over a longer period (144).
This volume factor (VCF) is then multiplied by ATR, creating a synergy with volatility and volume.
Visualization with Background Color Gradient:
A background color gradient is applied to the chart based on the calculated volume strength (f1).
The gradient color ranges from black (indicating low ATR and volume strength) to purple (indicating high ATR and volume strength). A low value indicates a ranging market with no significant price movements and it is safter to avoid signals generated from ROC histogram in these region.
Synergy of ROC and Volume Strength:
Observe how the ROC signals align with the background color gradient. For example, confirm whether positive ROC aligns with periods of high ATR and volume strength.
This synergy can provide confirmation or divergence signals, adding another layer of analysis.

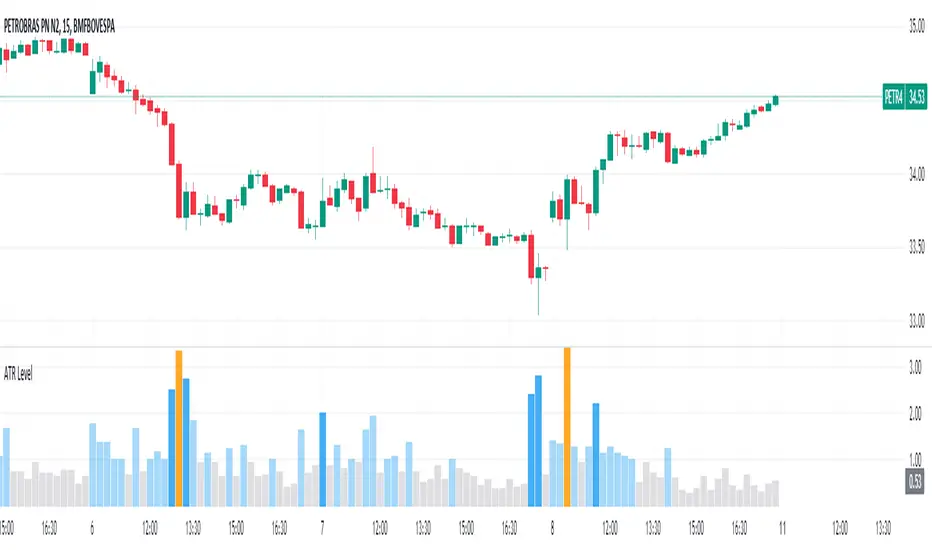
Average True Range Level█ Overview
The indicator uses color-coded columns to represent different levels of normalized ATR, helping traders identify periods of high or low volatility.
█ Calculations
The normalization process involves dividing the current True Range by the Average True Range. The formula for normalized ATR in the code is:
nAtr = nz(barRange/atr)
█ How To Use
Level < 1
During periods when the normalized ATR is less than 1, suggesting a lower level of volatility, traders may explore inside bar strategies. These strategies focus on trading within the range of the previous bar, aiming to capitalize on potential breakout opportunities.
Level between 1 and 3
In instances where the normalized ATR falls between 1 and 3, indicating moderate volatility, a pullback strategy may be considered. Traders look for temporary corrections against the prevailing trend, entering positions in anticipation of the trend's resumption
Level between 2 and 3
Within the range of normalized ATR between 2 and 3, signifying a balanced level of volatility, traders might explore breakout strategies. These strategies involve identifying potential breakout levels using support and resistance or other indicators and entering trades in the direction of the breakout.
Level > 3
When the normalized ATR exceeds 3, signaling high volatility, traders should approach with caution. While not ideal for typical mean reversion strategies, this condition may indicate that the price has become overextended. Traders might wait for subsequent candles, observing a normalized ATR between 2 and 3, to consider mean reversion opportunities after potential overpricing during the high volatility period.
* Note: These strategies are suggestions and may not be suitable for all trading scenarios. Traders should exercise discretion, conduct their own analysis, and adapt strategies based on individual preferences and risk tolerance.
Red Candle ATRThis ATR - Average True Range - Measures only red candles, giving the average true range of market declines.
