Bill Williams SystemBill Williams System combine all indicators of Mr. Bill Williams into one window with detail below:
1. Top of window:
Display Fractals with shape triangle down is bottom fractal and shape triangle up is top fractal
2. Bottom of window:
Display Alligator Trend Flat with trend defined as below:
* Up trend: Lips value shift 3 bars greater than Teeth value shift 5 bars. And Teeth value shift 5 bars greater than Jaws value shift 8 bars. By default up trend is green square.
* Down trend: Lips value shift 3 bars less than Teeth value shift 5 bars. And Teeth value shift 5 bars less than Jaws value shift 8 bars. By default down trend is red square.
* Choppy: not up trend and not down trend. By default choppy is gray square.
3. Moving around zero line
* Awesome Oscillator is circles.
* Accelerator Oscillator is columns.
* Gator Oscillator is area.
ビル・ウィリアムズのインジケーター

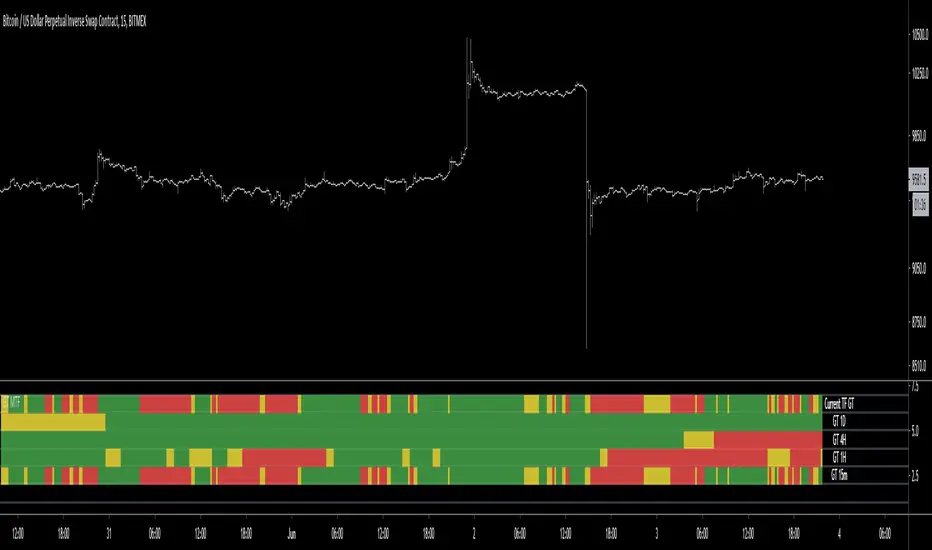
Gator Trend MTF HeatmapThe Gator Trend MTF heatmap checks multiple timeframes to the current trend based on a derivative of Bill William's Alligator.
Green = Bullish Trend
Red = Bearish Trend
Yellow = Sleeping (No Trend)
Use the link below to obtain access to this indicator
Williams Fractals One// It is same as William fractal default one. I have just modified to provide the fractal UP or DOWN considering one handle on each side other than default two.
// It will help in ICT methods to find the Market structure.

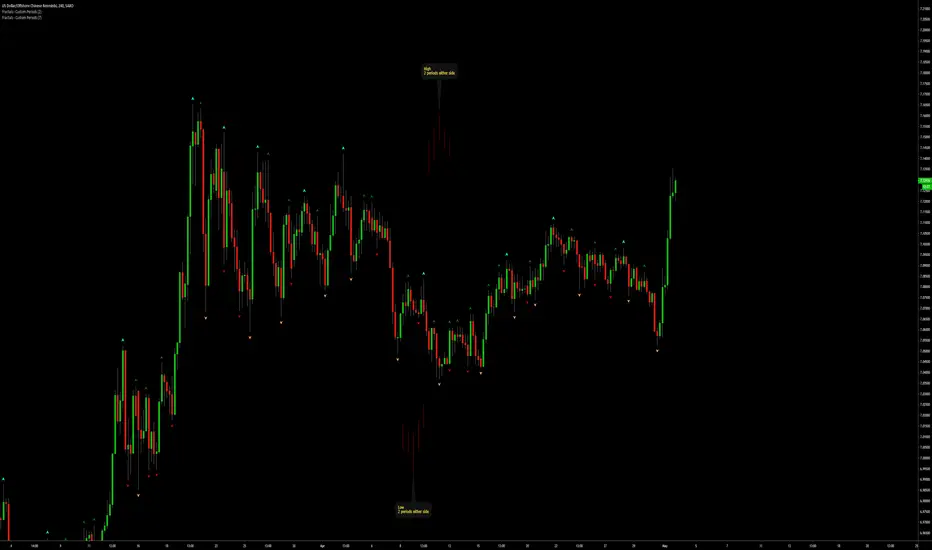
Fractals | Swing Points | Highs & Lows | Custom PeriodsSimple script which marks out key swing highs & lows.
One of the only indicators I have on the chart most days
- perfect for naked charting
- quickly helps you to visually identify key areas of interest
An extension of Bill Williams fractals
- aka short term swing points
Allows you to filter for only the most prominent swing points
- you can even overlay multiple swingpoint filters in different colours (as per example chart)
The number ( Fractal Periods) is simply:
- the number of less prominent points either side of your swing high/low
- example shown on the chart
Otherwise make a fist
- look at your 5 knuckles
- swing high is your middle knuckle
- 2 lower points either side
Bill Williams Original Fractal:
Fractal Periods = 2
Your Fractal Period for Filtering:
3, 4, 5, 30, 365, etc
Allows you to find swing points down to:
Fractal Periods = 1
Simple, easy, shared to enjoy =)

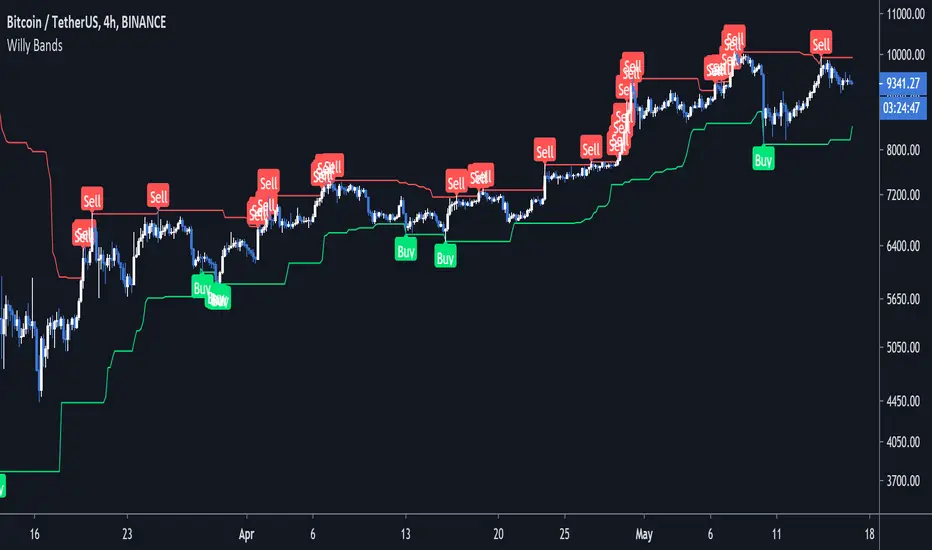
Williams + BB Buy Sell signal
Williams %R with Bollinger Bands
This script can help traders to determine if there is a buy or sell signal.
It indicates when the Williams %R crosses the Bollingers bands levels at the overbought and oversold areas.
Red cross: when the Williams crosses the upper level of BB in the overbought area, that can be considered as a double confirmation to sold.
Green cross: when the Williams crosses the lower level of BB in the oversold area, that can be considered as a double confirmation to buy.
Configuration:
This indicator gives accurate signals with this configuration:
Williams %R: period length 12
MA period: period length 8
Bollinger bands: period length 6

Price Action ScalperThis strategy is H1 timeframe only. No indicators used. No volumes, just price action. The trend is determined by a candlestick pattern, entry points are fractals.
Takeprofit is ATR(14), stoploss is 3*ATR(14) (yess, bad maths, we can discuss if you want) but you can use only entries and close when you want.
This is my second script here, so I didn't tested for kinda repainting. If you see repainting, please write in comments, I will try to fix it.

AIMS Gator TVThe Alligator is a very good indicator; it reveals the fractal geometric nature of the market.
To understand AIMS Gator we must first understand Bill Williams Alligator.
There is scientific research behind it and Bill Williams used supercomputers to arrive at this trend-confirming indicator.
The Alligator is our “compass” - it shows us the direction of the trend and is very much in tune with the structure of the market.
Anatomy of the Alligator
The Alligator is made of three smooth moving averages, shifted into the future.
The picture below shows an open gator with its three-line not touching each other.
BLUE LINE:
Interpretation and Use of Information Provided by the Blue Line
Alligator's Jaw (the Blue Line) – is a 13 period smooth moving average, at the mid price (High+Low)/2, offset 8 bars into the future.
The Blue line is the Balance Line for price on the current time frame. Price will come to the Blue Line when there is no new incoming information. This means when the volatility goes down, the momentum will fall and price will stop travelling up and down; it starts going sideways and the Alligator catches up with price. When price is close to the Blue Line, it is said to be at its Balance Line. When price goes sideways, with all three lines intertwined we say, the Alligator is sleeping and that the market has reached its Balance Line. When there is new incoming information, price starts going away from the Balance Line and the Alligator opens its mouth. The rise and fall of momentum is also represented in the form of a histogram by AIMS AO (explained below). The Blue Line mimics AIMS AO as well. You must pay attention to relationship of the Blue Line and AIMS AO.
The Blue Line is the trend and the Balance Line of the current time frame.
RED LINE:
Interpretation and Use of Information Provided by the Red Line
Alligator's Teeth (the Red Line) – is an 8-period smooth moving average, at the mid-price (High+Low)/2, offset 5 bars into the future.
The Red Line is the Balance Line of the significant lower time frame. When price is above the Red Line on M5 we start looking for a buy Setup on M1. When price is below the Red Line on M5 we start looking for a sell Setup on M1. We have a mechanism to display the Red Line of M5 on M1 – it’s called the Purple Line.
Red Line is the trend and the Balance Line of a certain lower time frame.
Alligator's Lips (The Green Line) – 5-period smooth moving average, at the mid-price (High+Low)/2, offset 3 bars into the future.
GREEN LINE:
Interpretation and Use of Information Provided by the Green Line
The Green Line is the Balance Line of a significant lower time frame, even lower than the Red Line. Just like the Blue Line, it also has a relationship with AO but with AO of the 5 times lower time frame.
GreenLine is the trend and Balance Line of a lower time frame than the Red Line.
What is the AIMS Gator?
Now that you know about the Alligator and the relationship of the lines it should be easy for you to understand that the AIMS Gator is the “Multi-Dimensional Alligator”. We trade in the direction of 5 times higher time frame. Wouldn’t it be nice to know what the Alligator of the five times higher time frame telling us? In order to do so, we have chosen to display on M1, the information provided by the Red Line on M5.
AIMS Gator together with the Purple Magic Line, shows us the Red Line of M5 (5xHTF) on M1 (Current Time Frame).
Alligator is our Compass whereas AIMS Gator is our Map.
PURPLE Magic Line: Script Link
Interpretation and Use of Information Provided by the Purple Line
The Purple Line is the trend of a 5 times higher time frame.
The Purple Line – is a derivative of the Red Line of 5 times higher time frame. On M1, it is the Red Line of M5.
What is the Sleeping Alligator?
We generally want the Alligator to ‘sleep’ before we start looking for a trading opportunity.
The Alligator is considered asleep when the three lines are intertwined and horizontal.
When the Alligator is sleeping and purple magic is hovering below it like in the picture below, we get excited, looking for a range breakout, in this example buy only because gator and price is above the Purple Magic.

AIMS Wave TVUsing the Logic of the 10 Seconds Elliott Wave
You can Count Elliott Wave on the Histogram of this indicator instead of Price.
This is simpler and more accurate (subjectivity)
Please follow the link below to download FREE EBook which explains how to use this super duper indicator.

MTF Trend Scanner v2The MTF Trend Scanner searches multiple timeframes to identify the outlook for that particular timeframe. The overall trend becomes stronger with confluence between the timeframes.
However, the individual timeframe can be used on their own. When the colour switches red/green for the first, that mean it's the start of a new trend for that particular timeframe. It'll stay in trend until it switches off (this doesn't mean price can't reverse the opposite way so just keep that in mind!)
Use the link below to obtain access to this indicator

Fractal SL OverlayThis Fractal Stop-Loss Overlay sets a trailing fractal top and bottom to help identify the support and resistances for the current candle.
Use the link below to obtain access to this indicator

Fibonacci RainbowThis indicator is inspired by Bill William's Alligator .
Taken 7 Fibonacci numbers, painted in the colors of the rainbow and highlighted when the rainbow fan is up or down.

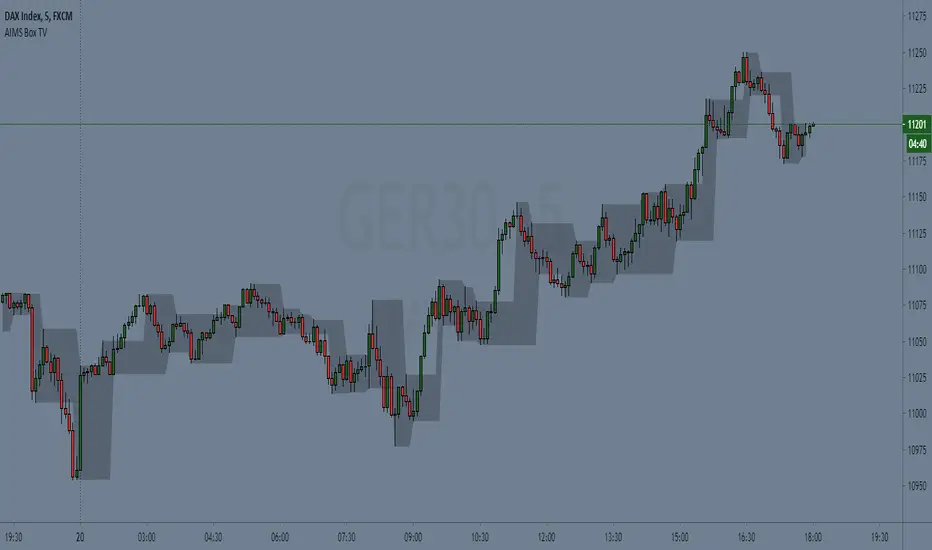
AIMS Box TV [ Trade in line with the Structure of the Market] Introduction to AIMS Box
The Market has an underlying Unseen Structure that can be revealed by using this indicator.
The underlying structure of the Market is Elliott Wave. And the Underlying Structure of Elliott Wave is the Fractals. This BOX is based on the Fractals.
The AIMS Box is created using the fractals. The Upper and Lower Levels require a minimum of five bars with the top of the box being the upper Fractal; the bottom of the box, the lower Fractal
The AIMS Levels are the high and low of the AIMS Box – the upper and lower Fractals.
This indicator, by itself, provided the concept that revolutionised my trading.
AIMS Box can be used for
1. Calculating Risk Per Trade
2. To Find the Trend of the Market i.e. Stepping Up is Uptrend and Stepping Down is Down Trend.
3. The box lower levels are used for Trailing Stops for Buy Orders and Box High levels are used for Trailing Stop for Sell Trades.
Anatomy of the AIMS Box and the AIMS Levels
As mentioned earlier, the AIMS Boxes are formed using high and low Fractals. A new AIMS Box will be created whenever price makes a new high or low Fractal.
The bottom of the AIMS Box – the Lower AIMS Level - is created when a low Fractal is formed i.e. the low of a candle is lower than two candles to the left and two candles to the right.
The AIMS Level clearly shows support and resistance – where price approached a level and could not go further, forcing it to retrace on itself.
Pending Sell Order is set 1 pip below the lower AIMS Level (provided it’s a correct Setup).
The top of the AIMS Box – the Upper AIMS Level - is created when a high Fractal is formed i.e. the high of a candle is higher than two candles to the left and two candles to the right.
Pending Buy Order is set 1 pip + spread above the AIMS Box (provided it’s a correct Setup).
Benefits of this Indicator:
Objective information generated by the AIMS Box and its Levels
Crystal clear entry levels.
Stop-loss levels – clear support and resistance levels.
Money management information.
Position/lot size information.
Trailing stop-loss mechanism.
AIMS Box also generates the following additional information about the market:
The market always creates an AIMS Box before it turns around.
Every trend starts and ends with an AIMS Level.
Entries are always taken on the breakout of the AIMS Box.
We don’t take entries inside the AIMS Box on the timeframe that produced the Setup.
When price is inside the grey shaded zone, it is inside the AIMS Box; it is within the AIMS
How to Get Access to This Script?
Contact me using the link below to gain access.
Captain Jack Williams %R EMA/SMAWilliams% R / EMA / SMA
This oscillator is designed from a different perspective. You can show the current price trend (EMA / SMA) in the background based on its transition. You can mix or split the background.
Investor behavior
Williams% R (% R) is a momentum-based oscillator used primarily in technical analysis to define overbought and oversold conditions. % R is based on the comparison between the current closing and the highest amount for a retrospective period defined by the investor. The% R (note negative values) between 0 and -100 indicates that the arrows show more purchase conditions when close to zero and over-sold when close to -100. In general,% R can create installations based on overbought and oversold conditions and general changes in momentum.
I wish good luck to the friends who will use it.
You can support and follow to see different machines.
Williams% R / EMA / SMA
Bu osilatör farklı bir perspektiften tasarlanmıştır. Geçerli fiyat eğilimini (EMA / SMA) geçişine göre arka planda gösterebilirsiniz. Arka planı karıştırabilir veya bölebilirsiniz.
Yatırımcı davranışı
Williams% R (% R), aşırı alım ve aşırı satım koşullarını tanımlamak için öncelikle teknik analizde kullanılan momentum tabanlı bir osilatördür. % R, mevcut kapanış ile yatırımcı tarafından tanımlanan geriye dönük bir döneme ilişkin en yüksek tutar arasındaki karşılaştırmaya dayanmaktadır. 0 ve -100 arasındaki% R (negatif değerleri not edin), okların sıfıra yakın olduğunda daha fazla satın alma koşulu gösterdiğini ve -100'e yakın olduğunda aşırı satıldığını gösterir. Genel olarak,% R aşırı alım ve aşırı satım koşullarına ve momentumdaki genel değişikliklere dayalı kurulumlar oluşturabilir.
Kullanacak arkadaşlara iyi şanslar diliyorum.
Farklı makineleri görmek için destekleyebilir ve takip edebilirsiniz.

1337 StrategyThis is a WIP strategy based on the 1337 Oscillator. It seems to catch some of the nice trending moves on the 1H but needs work to filter the choppy signals after a move and during consolidation.

Fractals | Swing Points | Highs & Lows | Custom PeriodsSimple script which marks out key swing highs & lows.
One of the only indicators I have on the chart most days
- perfect for naked charting
- quickly helps you to visually identify key areas of interest
An extension of Bill Williams fractals
- aka short term swing points
Allows you to filter for only the most prominent swing points
- you can even overlay multiple swingpoint filters in different colours (as per example chart)
The number (Fractal Periods) is simply:
- the number of less prominent points either side of your swing high/low
- example shown on the chart
Otherwise make a fist
- look at your 5 knuckles
- swing high is your middle knuckle
- 2 lower points either side
Bill Williams Original Fractal:
Fractal Periods = 2
Your Fractal Period for Filtering:
3, 4, 5, 30, 365, etc
Simple, easy, shared to enjoy =)
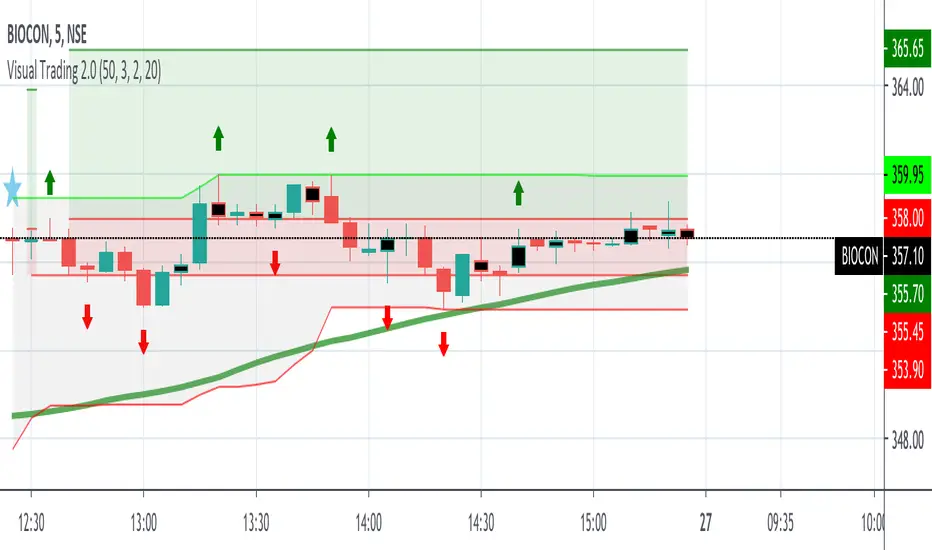
VT SMA 50 DC with FractalsBuying or Selling levels are identified with SMA 50 along with Fractals for breakouts and reversals.
SMA will be green when the trend is Bullish
SMA will be red when the trend is Bearish
The color is set GREEN and RED for Bullish and Bearish trend
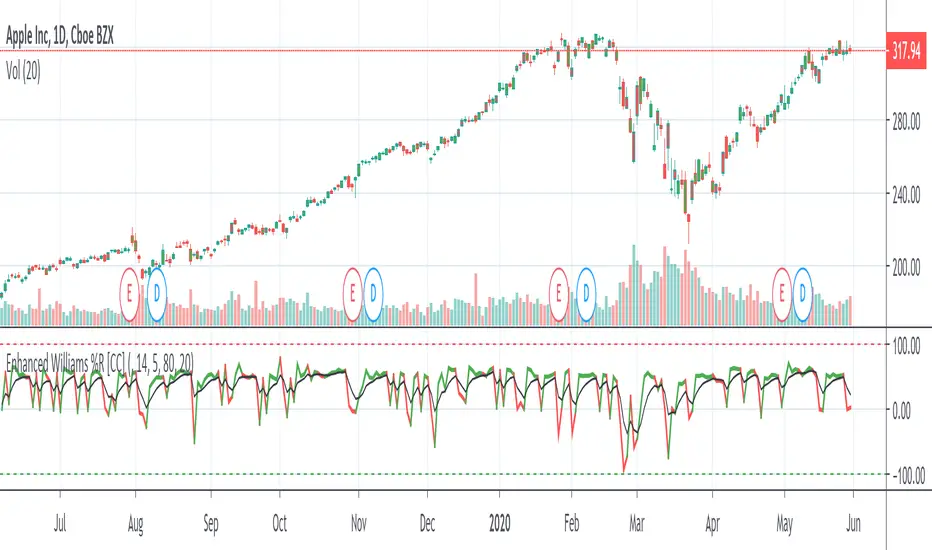
Enhanced Williams %RThe Enhanced Williams %R Indicator was created by Robert J Kinder Jr (Stocks & Commodities V5:5 (180-182)) and is based on the Williams %R Indicator. It takes volume into account and the buy and sell signals are pretty much the same. I would recommend to buy when the indicator is over the signal and if you want a confirmation then also make sure the signal is above 0. Sell if it falls below the signal or if the signal goes below 0 or of course buy or sell when the indicator goes into overbought or oversold territory.
I'm still tinkering with this indicator and it is the first time I have seen this indicator script published so let me know if you have any suggestions for me.
And of course let me know if you would like me to write indicators for you or anything else you would like to see!
Ribbon_Arshiin this indicator
moving average 20-25-30-35-40-50-100-200 with fractal added to the chart.

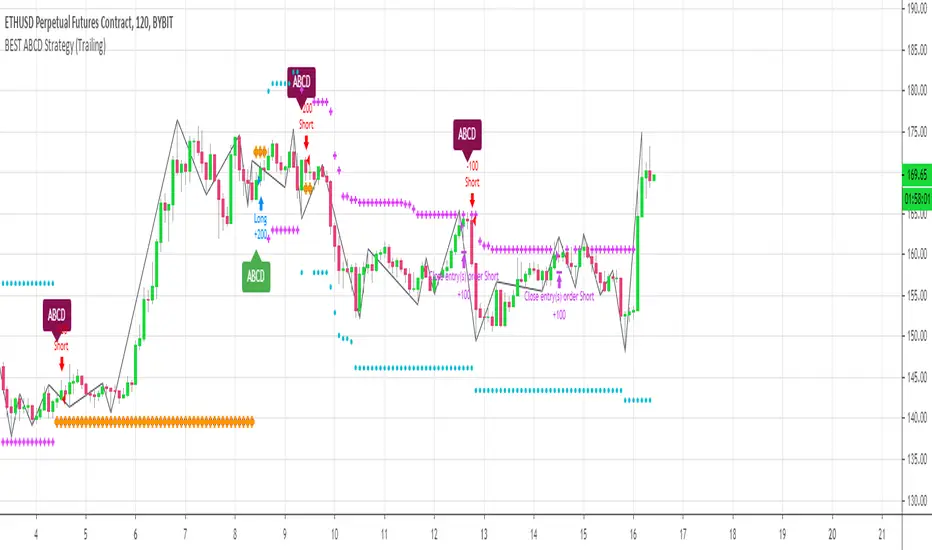
[Daveatt] BEST ABCD Pattern Strategy (Trailing SL + TP)Hello traders
This is the strategy version of my ABCD pattern. I added the Trailing Stop and Trailing Profit upon a follower request
I - Concept
I present to you, ladies and gentlemen, the first screener for harmonic patterns .
Starting with an ACBD pattern screener this time!!
I used the calculations from Ricardo Santo's script
In short, he's using fractals (regular or Bill Williams ) for the pattern calculations. A masterpiece !!!
II - Definitions
The ABCD pattern ( AB=CD ) is one of the classic chart patterns which is repeated over and over again.
The ABCD pattern shows perfect harmony between price and time.
The Williams Fractal is an indicator, developed by Bill Williams , that aims to detect reversal points (highs and lows) and marks them with arrows.
Up fractals and down fractals have specific shapes. The Williams Fractal indicator helps users determine in which direction price will develop
💎Strategy filters💎
I included some cool backtest filters:
- Trailing stop with trigger concept coming from this Trailing Stop Strategy
- Trailing profit with trigger coming from this Trailing Profit Strategy
Last words
It works for all asset classes (Forex, crypto, indices, etc...) and does not repaint
All the BEST
Dave
Accelerator Oscillator DivergencesDiscover divergences found by the Accelerator Oscillator indicator.

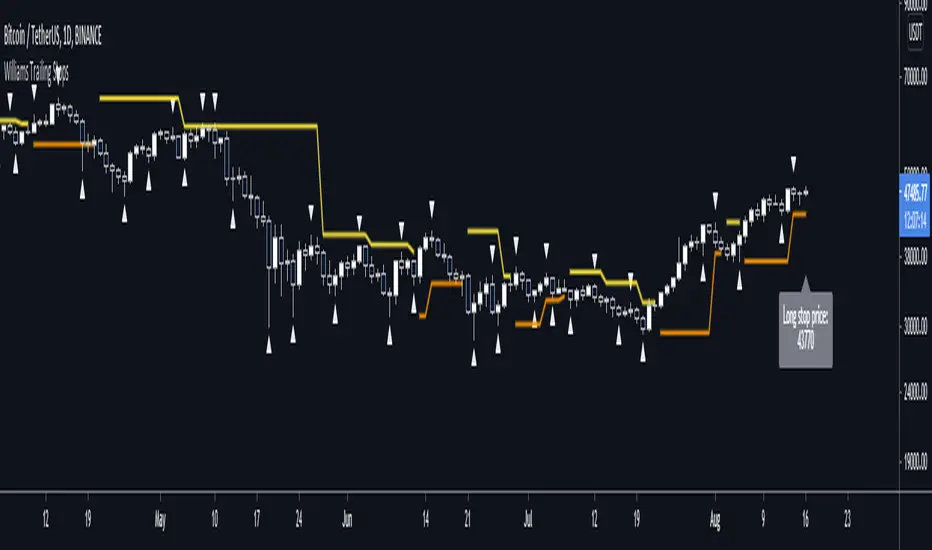
Williams Fractal Trailing StopsUnlike the built-in version, you can configure how many bars it takes to confirm a fractal. This indicator plots all Williams high and low fractals, and a stop line that trails the fractals up and down. Includes long and short stop alerts. You can choose whether the trail flips long-short based on the price being exceeded within a candle or on candle close. This indicator deals only with fractals and doesn't get into the Alligator or anything else.
I've commented it extensively, so that it might be useful for people learning Pinescript. Enjoy!