VW EMA CCI + TTM Volume Weighted EMA CCI + TTM squeeze in one indicator Credit goes to SpreadEagle 71 for the CCI and Greeny for the TTM インジケーターDaDudeの投稿アップデート済 10194
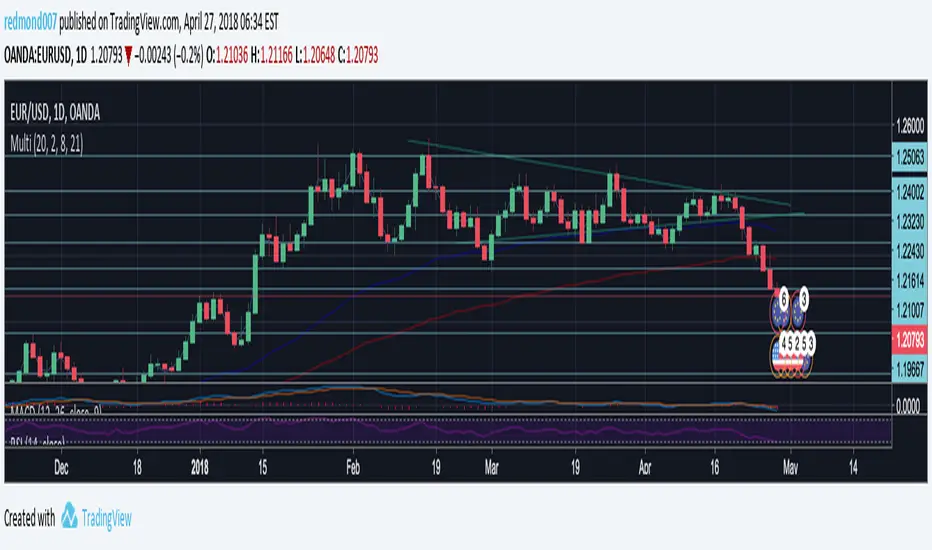
Multi Indicators v1 - 20 50 200 EMA/SMA, Bollinger Bands, VWAPMulti Indicators v1 20 50 200 EMA/SMA, Bollinger Bands, VWAP These can be turned on and off I'll be adding to this multi indicator in future updatesインジケーターrjthegreatxxの投稿アップデート済 7724
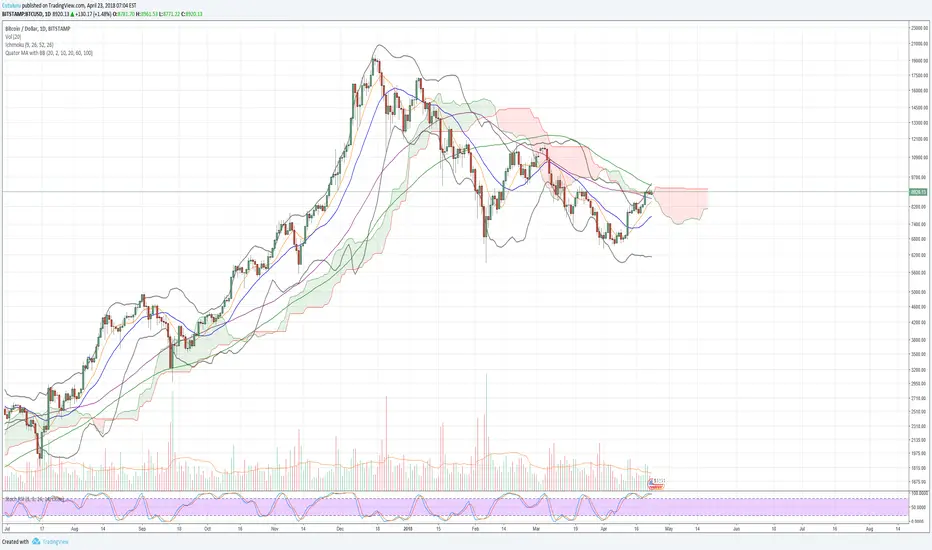
Quadro Bollinger BandsBB1 - Period 120, range 2 BB1 - Period 120, range 1 BB1 - Period 2, range 2インジケーターterapevt1981の投稿118
RSI Bollinger BandsThis RSI indicator has a Bollinger Bands indicator around it, and a simple moving average. I still haven't decided yet if the Bollinger Bands should be at 20 (like normal) or at 14 (like the RSI). Experiment with it and have fun :)インジケーターsndwavの投稿1871
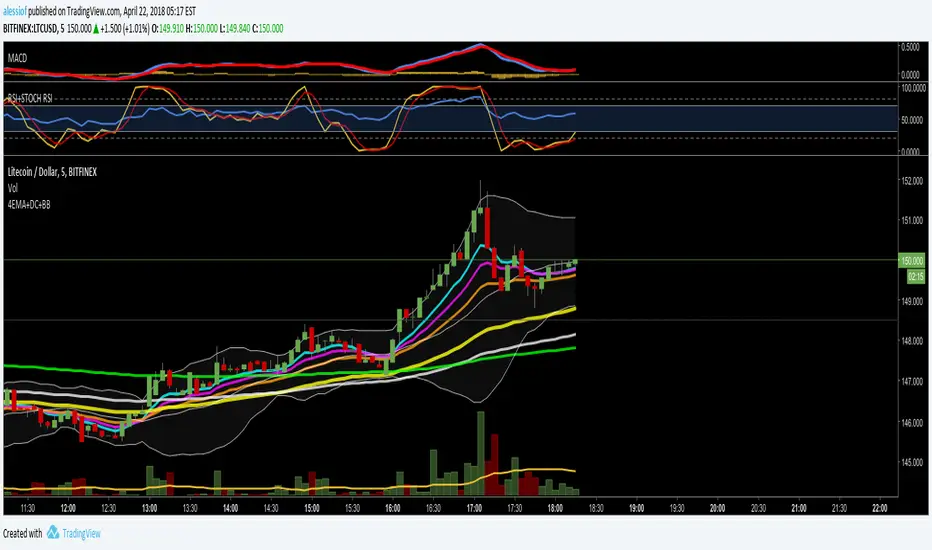
4EMA (8,13,21,55) + Bollinger BandsFive indicators in one. 4 Moving Average Exponential : 8, 13, 21, 55 - as per @Philakone strategy Bollinger Bands Check out my other scripts for RSI and Stoch RSI all in one, and 4EMA + Death Cross + Bollinger Bands.インジケーターa1234567890aaaの投稿2769
4EMA (8,13,21,55) + Death Cross (100,200) + Bollinger BandsUnited three indicators in one. 4 Moving Average Exponential: 8, 13, 21, 55 - as per @Philakone strategy Moving Average Exponential - Death Cross: 100, 200 Bollinger Bands Check out my other script for RSI and Stoch RSI all in one. インジケーターa1234567890aaaの投稿2630
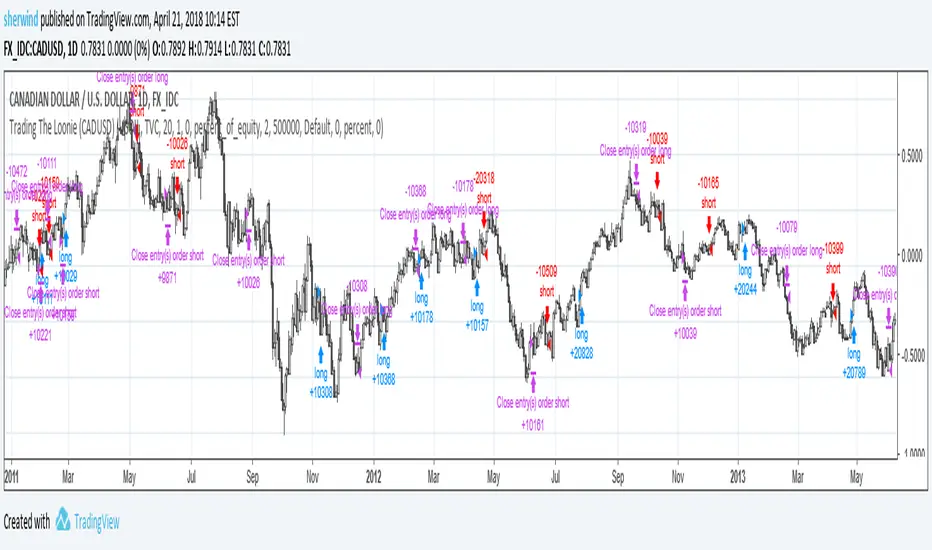
Trading The Loonie (CADUSD)A port of the trading strategy described at technical.traders.com "In “Trading The Loonie,” which appeared in the December 2015 issue of STOCKS & COMMODITIES, author Markos Katsanos explains the heavy correlation between the Canadian dollar and crude oil. He then goes on to describe how one could trade this correlation. Using similar logic as that employed in Bollinger Bands, Katsanos has built a study to provide buy and sell signals for trading the Canadian dollar future." See Also: - Bacストラテジーsherwindの投稿42
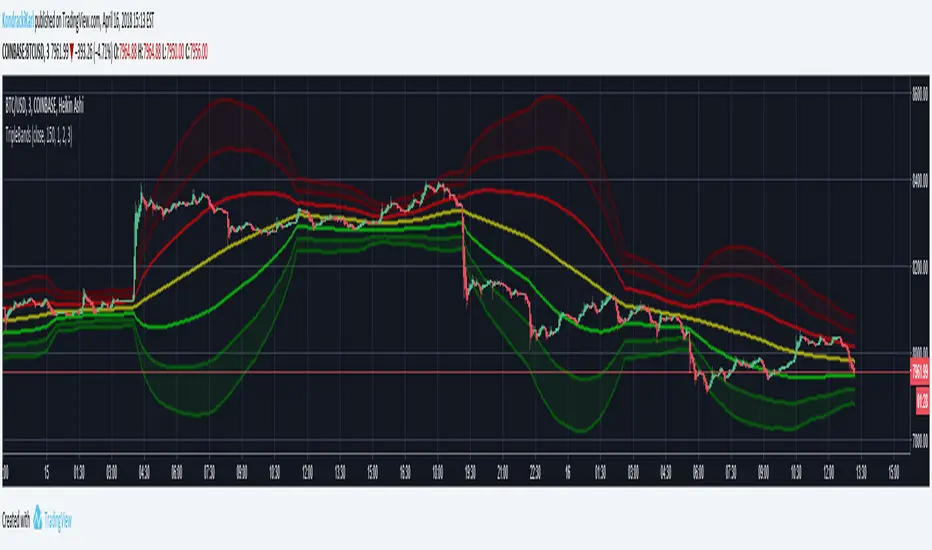
Triple Bollinger BandsTriple Bollinger Bands by Karl Kondracki Hopefully this script can be of use. Personally I really enjoy the reliability of Bollinger Bands set to a longer moving average. Adding two extra deviation settings on the set of bands with the longer ma setting helps to easily show trends. I tried to make the set as easy to see without drawing attention from other information. The settings are intended to be as adjustable as possible while keeping things basic.インジケーターKondrackiKarlの投稿3158
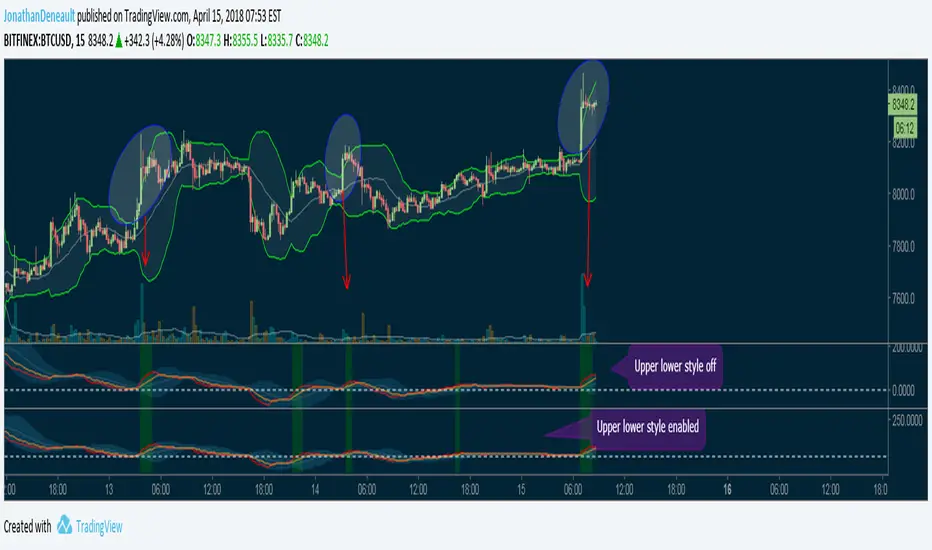
MacD + Bollinger BandsI made this simple script to use the MacD's EMA tapes with bollinger bands to leave the board free to better visualize the marked features, can be noticed that when the candlesticks come out of the bollinger bands, the EMA strips of the MAcD are also coming out, so it's still useful and they are indicated by the green breaches. I also advise to disable the Upper / Lower in the style tab, this gives a crushing effect. You can turn off the breach too !インジケーターjod17の投稿アップデート済 124
XBTUSD for BitMEX [ BB Long term strategy ]XBTUSD for BitMEX 『おすすめストラテジーSS1』(BitMEXビットコイン用Pineスクリプト)自動売買のアイデアに!ストラテジーtono112121の投稿1136
Multiple EMA, VWMA, BB and CCIThis is a combination of Multiple EMA, VWMA, BB and CCI on one script.インジケーターczarlieronの投稿194
Doube BB and RSI IndicatorSimple but interesting combo with Bollinger Bands, RSI and Volumes cut off Make sure to check my other scripts :)インジケーターcyatophilumの投稿184
VWMA Bollinger BandsHey there fellow bollinger band fans! The main point of this script is to give bollinger bands with a vwma basis rather than a sma basis. It is important to note that the default setting is to average the opening price rather than closing price of previous candles (just my personal preference). Also by default this script shows bands based on one, two and three standard deviations from the vwma basis. Play with the settings and change them to what you like. インジケーターGlassHalfFullの投稿370
(Alerts+Strategy)Noro's Bands Scalper Strategy v1.6Alerts for @noro strategy Using with autoview.with.pinkインジケーター4budab1の投稿5168
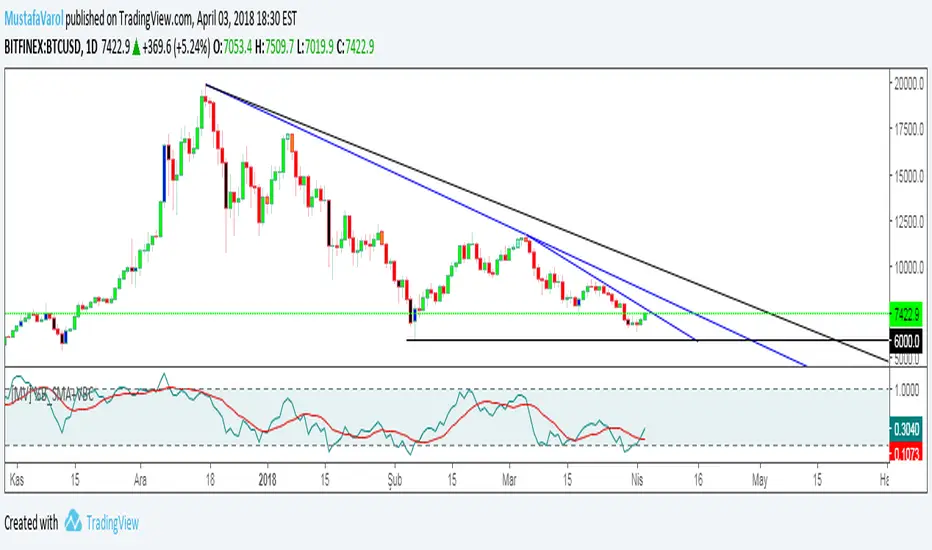
[MV] %B with SMA + Volume Based Colored Bars Entry Signal when %B Crosses with SMA and this is more meaningful if it supports colored bars. Black Bar when prices go down and volume is bigger than 150% of its average, that indicates us price action is supported by a strong bearish volume Blue Bar when prices go up and volume bigger than 150% of its average, that indicates us price action is supported by a strong bullish volume VBC author @KIVANCfr3762 インジケーターMustafaVarolの投稿3406
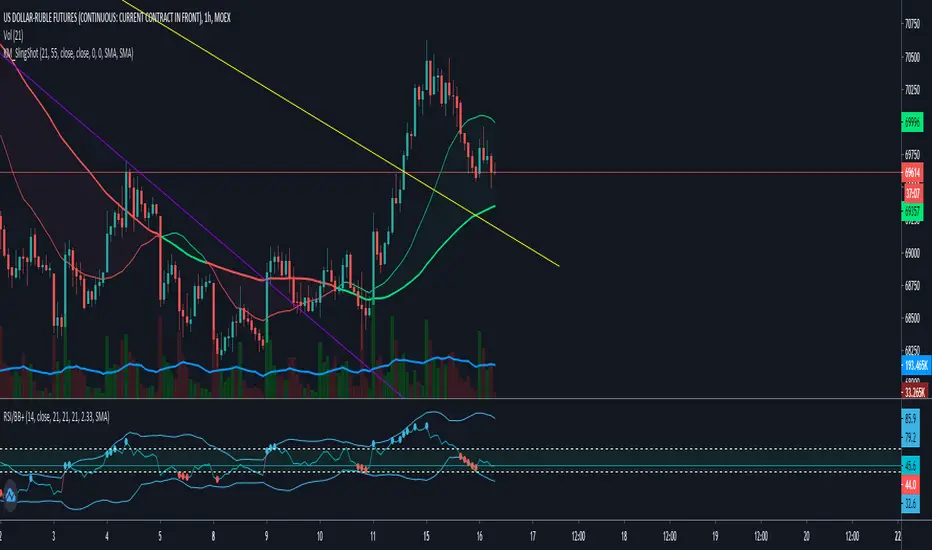
RSI+ with Bollinger BandsRelative Strenght Index + SMA on RSI + Bollinger Bands on it - very good solution to see reversals and see lows and highs. Use different timeframe. StdDev is 2.17 by default to get 97% probability. RSI + SMA с наложенными Bollinger Bands - прекрасное решение для поиска разворотных точек и аномального поведения цены. Используйте разные таймфреймы одновременно. StdDev = 2.17 по умолчанию для обеспечения попадания в диапазон в 97% случаев.インジケーターKostiaMininの投稿アップデート済 1311
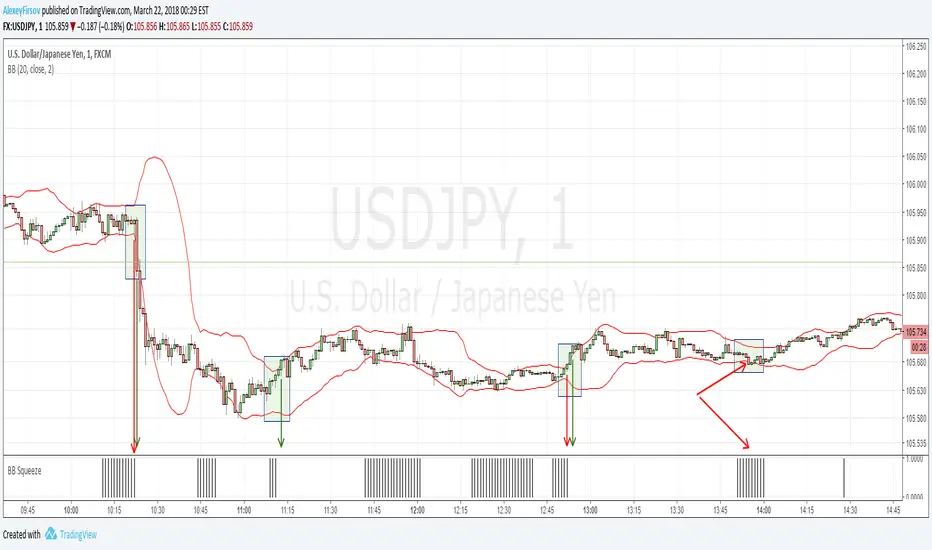
Bollinger Bands SqueezeEnglish: Simple histogram, showing Squeeze of Bollinger Bands. Usage is simple - when price is in Squeeze, no entries in any direction. For using with Bollinger Bands indicator, including binary options. Russian Простой индикатор, наглядной отображающий стадию Сжатия лент Боллинджера. Простой в использовании - когда цена в Сжатии - не входим в сделку. Особенно эффективен при связке с индикатором лент Боллинджера и входе в сделку при раскрытии лент. Также применим для бинарных опционов ExamインジケーターAlexeyFirsovの投稿8 1.1 K
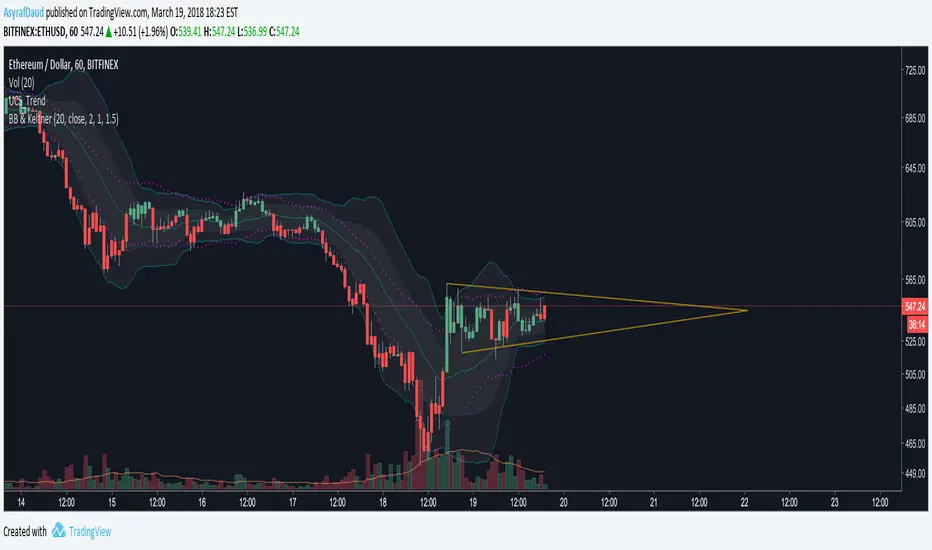
Bollinger Bands and Keltner Channel (BB and KC)Script that combines 2 Bollinger Bands (Std Dev = 1 and Std Dev = 2) with Keltner Channel (Std Dev = 1.5)インジケーターAsyrafDaudの投稿383
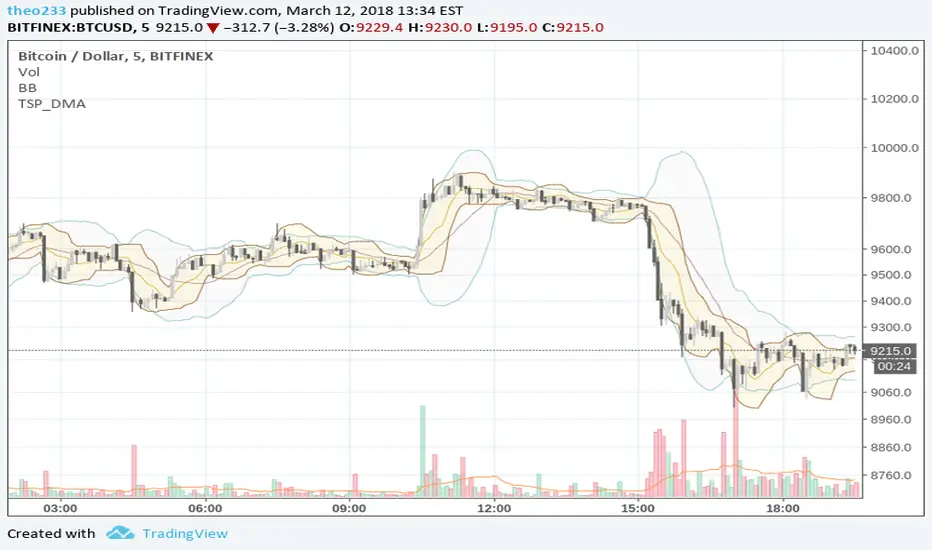
TSP Donchian EMADonchian with EMA This show EMA of Donchain Channel (Highs and Lows) It is nice to identify Support and Resistance, in range period Should work well for scalp This is a complement to Bollinger Bandsインジケーターtheo233の投稿131
TEMA/hullMA Ribbon with Bollinger BandsDesigned for shorted time frames. Bollinger bands based off of TEMA as source. Ribbon based off TEMA and hullMA divergence. RMA used to signal Bollinger bands. Ribbon: pinch -> reversal blue -> sign of possible uptrend red -> sign of possible downtrend Bollinger bands background: blue -> sign of continuing uptrend red -> sign of continuing downtrend インジケーターNeoButaneの投稿アップデート済 4805
OHLC Daily Resolution BandsShout out to nPE- for the idea. Bands made with stdev from 10 day OHLC. Keeps resolution to daily, so you can use bands as daily pivots for day trading. Upper band 1=yesterday close + 0.5 std(ohlc,10) Upper band 1=yesterday close + 1 std(ohlc,10) Mid=yesterday close Lower band 1=yesterday close - 0.5 std(ohlc,10) Lower band 2=yesterday close - 1 std(ohlc,1インジケーターsmartyntonの投稿2187
EMAx4 + BollingerEl indicador incluye 4 EMAs (de 14, 34, 50 y 200) y Bandas de BollingerインジケーターNandoxanの投稿117