Global Bond Yields Monitor [MarktQuant]Global Bond Yields Monitor
The Global Bond Yields Monitor is designed to help users track and compare government bond yields across major economies. It provides an at-a-glance view of short- and long-term interest rates for multiple countries, enabling users to observe shifts in global fixed-income markets.
Key Features:
Multi-Country Coverage: Includes major advanced and emerging economies such as the United States, China, Japan, Germany, United Kingdom, Canada, Australia, and more.
Multiple Maturities: Displays yields for the 2-year, 5-year, 10-year, and 30-year maturities (20-year for Russia).
Dynamic Yield Data: Plots real-time yields for the selected country directly from TradingView’s data sources.
Weekly Change Tracking: Calculates and displays the yield change from one week ago ( ) for each maturity.
Table Visualization: Option to display a compact data table showing current yields and weekly changes, color-coded for easier interpretation.
Visual Yield Curve Comparison: Plots yield lines for short- and long-term maturities, with shaded areas between curves for visual clarity.
Customizable Display: Choose table placement and whether to show or hide the weekly change table.
Use Cases
This script is intended for analysts, traders, and investors who want to monitor shifts in sovereign bond markets. Changes in yields can reflect adjustments in monetary policy expectations, inflation outlook, or broader macroeconomic trends.
❗Important Note❗
This indicator is for market monitoring and educational purposes only. It does not generate trading signals, and it should not be interpreted as financial advice. All data is sourced from TradingView’s available market feeds, and accuracy may depend on the source data.
Bonds

OverUnder Yield Spread🗺️ OverUnder is a structural regime visualizer , engineered to diagnose the shape, tone, and trajectory of the yield curve. Rather than signaling trades directly, it informs traders of the world they’re operating in. Yield curve steepening or flattening, normalizing or inverting — each regime reflects a macro pressure zone that impacts duration demand, liquidity conditions, and systemic risk appetite. OverUnder abstracts that complexity into a color-coded compression map, helping traders orient themselves before making risk decisions. Whether you’re in bonds, currencies, crypto, or equities, the regime matters — and OverUnder makes it visible.
🧠 Core Logic
Built to show the slope and intent of a selected rate pair, the OverUnder Yield Spread defaults to 🇺🇸US10Y-US2Y, but can just as easily compare global sovereign curves or even dislocated monetary systems. This value is continuously monitored and passed through a debounce filter to determine whether the curve is:
• Inverted, or
• Steepening
If the curve is flattening below zero: the world is bracing for contraction. Policy lags. Risk appetite deteriorates. Duration gets bid, but only as protection. Stocks and speculative assets suffer, regardless of positioning.
📍 Curve Regimes in Bull and Bear Contexts
• Flattening occurs when the short and long ends compress . In a bull regime, flattening may reflect long-end demand or fading growth expectations. In a bear regime, flattening often precedes or confirms central bank tightening.
• Steepening indicates expanding spread . In a bull context, this may signal healthy risk appetite or early expansion. In a bear or crisis context, it may reflect aggressive front-end cuts and dislocation between short- and long-term expectations.
• If the curve is steepening above zero: the world is rotating into early expansion. Risk assets behave constructively. Bond traders position for normalization. Equities and crypto begin trending higher on rising forward expectations.
🖐️ Dynamically Colored Spread Line Reflects 1 of 4 Regime States
• 🟢 Normal / Steepening — early expansion or reflation
• 🔵 Normal / Flattening — late-cycle or neutral slowdown
• 🟠 Inverted / Steepening — policy reversal or soft landing attempt
• 🔴 Inverted / Flattening — hard contraction, credit stress, policy lag
🍋 The Lemon Label
At every bar, an anchored label floats directly on the spread line. It displays the active regime (in plain English) and the precise spread in percent (or basis points, depending on resolution). Colored lemon yellow, neither green nor red, the label is always legible — a design choice to de-emphasize bias and center the data .
🎨 Fill Zones
These bands offer spatial, persistent views of macro compression or inversion depth.
• Blue fill appears above the zero line in normal (non-inverted) conditions
• Red fill appears below the zero line during inversion
🧪 Sample Reading: 1W chart of TLT
OverUnder reveals a multi-year arc of structural inversion and regime transition. From mid-2021 through late 2023, the spread remains decisively inverted, signaling persistent flattening and credit stress as bond prices trended sharply lower. This prolonged inversion aligns with a high-volatility phase in TLT, marked by lower highs and an accelerating downtrend, confirming policy lag and macro tightening conditions.
As of early 2025, the spread has crossed back above the zero baseline into a “Normal / Steepening” regime (annotated at +0.56%), suggesting a macro inflection point. Price action remains subdued, but the shift in yield structure may foreshadow a change in trend context — particularly if follow-through in steepening persists.
🎭 Different Traders Respond Differently:
• Bond traders monitor slope change to anticipate policy pivots or recession signals.
• Equity traders use regime shifts to time rotations, from growth into defense, or from contraction into reflation.
• Currency traders interpret curve steepening as yield compression or divergence depending on region.
• Crypto traders treat inversion as a liquidity vacuum — and steepening as an early-phase risk unlock.
🛡️ Can It Compare Different Bond Markets?
Yes — with caveats. The indicator can be used to compare distinct sovereign yield instruments, for example:
• 🇫🇷FR10Y vs 🇩🇪DE10Y - France vs Germany
• 🇯🇵JP10Y vs 🇺🇸US10Y - BoJ vs Fed policy curves
However:
🙈 This no longer visualizes the domestic yield curve, but rather the differential between rate expectations across regions
🙉 The interpretation of “inversion” changes — it reflects spread compression across nations , not within a domestic yield structure
🙊 Color regimes should then be viewed as relative rate positioning , not absolute curve health
🙋🏻 Example: OverUnder compares French vs German 10Y yields
1. 🇫🇷 Change the long-duration ticker to FR10Y
2. 🇩🇪 Set the short-duration ticker to DE10Y
3. 🤔 Interpret the result as: “How much higher is France’s long-term borrowing cost vs Germany’s?”
You’ll see steepening when the spread rises (France decoupling), flattening when the spread compresses (convergence), and inversions when Germany yields rise above France’s — historically rare and meaningful.
🧐 Suggested Use
OverUnder is not a signal engine — it’s a context map. Its value comes from situating any trade idea within the prevailing yield regime. Use it before entries, not after them.
• On the 1W timeframe, OverUnder excels as a macro overlay. Yield regime shifts unfold over quarters, not days. Weekly structure smooths out rate volatility and reveals the true curvature of policy response and liquidity pressure. Use this view to orient your portfolio, define directional bias, or confirm long-duration trend turns in assets like TLT, SPX, or BTC.
• On the 1D timeframe, the indicator becomes tactically useful — especially when aligning breakout setups or trend continuations with steepening or flattening transitions. Daily views can also identify early-stage regime cracks that may not yet be visible on the weekly.
• Avoid sub-daily use unless you’re anchoring a thesis already built on higher timeframe structure. The yield curve is a macro construct — it doesn’t oscillate cleanly at intraday speeds. Shorter views may offer clarity during event-driven spikes (like FOMC reactions), but they do not replace weekly context.
Ultimately, OverUnder helps you decide: What kind of world am I trading in? Use it to confirm macro context, avoid fighting the curve, and lean into trades aligned with the broader pressure regime.

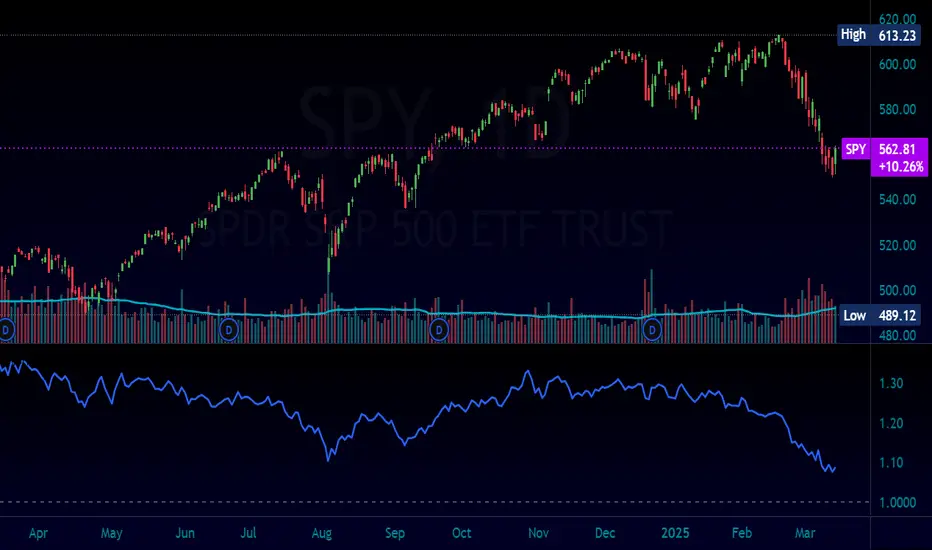
Normalized Equity/Bond RatioThis indicator calculates a normalized equity-to-bond ratio over a 252-day lookback (~1 trading year) to assess risk-on vs. risk-off sentiment. It addresses the issue of direct ratios (e.g., SPY/TLT) being visually dominated by high nominal stock prices, which can obscure bond price movements.
A rising ratio indicates equities are outperforming bonds, suggesting risk-on conditions, while a declining ratio signals a shift toward bonds, often associated with risk-off behavior. The normalization ensures better visibility and comparability of the trend over time.
A ratio > 1 means the equity (e.g., SPY) is outperforming the bond (e.g., AGG) since the lookback. A ratio < 1 means bonds are outperforming.
US10Y Yield Range Percentile | JeffreyTimmermansUS10Y Yield Range Percentile
The "US10Y Yield Range Percentile" Indicator provides insights into the relative positioning of the U.S. 10-Year Treasury Yield (US10Y) within a specified lookback period. It highlights key valuation style conditions, helping traders assess market sentiment based on yield movements.
Why is the US 10-Year Treasury Yield Important?
The U.S. 10-Year Treasury Yield (US10Y) is one of the most critical benchmarks in global finance. It reflects the cost of borrowing for the U.S. government and serves as a risk-free rate that influences interest rates across the economy.
Macroeconomic Indicator:
Rising yields suggest strong economic growth or inflationary pressures, often leading to tighter monetary policy.
Falling yields indicate economic slowdown, deflationary risks, or increased demand for safe-haven assets.
Impact on Financial Markets:
Stock Market: Higher yields reduce the attractiveness of equities, while lower yields support risk assets.
Credit Markets: A rising 10-year yield increases borrowing costs, impacting corporate debt and mortgage rates.
Global Capital Flows: US10Y is a key driver of capital allocation worldwide, affecting currency valuations and capital flows into emerging markets.
Correlation with Risk Assets (Especially Crypto):
Crypto markets, particularly Bitcoin and Ethereum, have shown a strong inverse correlation with US10Y yields.
When yields rise, risk assets tend to sell off due to tighter financial conditions.
When yields decline, liquidity flows into speculative assets, boosting stocks, crypto, and growth sectors.
Key Functions of the Indicator
Range Calculation:
Computes the highest high and lowest low over a user-defined period (default: 63 days).
Measures the current yield’s position within this range.
Range Percentile Calculation:
Determines the percentile rank of the current yield within its range.
A higher percentile indicates higher yields, often associated with Risk OFF conditions.
A lower percentile suggests lower yields, signaling Risk ON sentiment.
Optional Smoothing:
Enable/Disable: Users can enable Simple Moving Average (SMA) smoothing to reduce noise.
Default smoothing length : 10 periods (can be customized).
Threshold Levels & Background Coloring:
The background color represents the current market regime (valuation based), based on the US10Y yield percentile:
Risk ON (Bullish): When the percentile falls below the lower threshold (default: 20).
Neutrally Positive Zone (also Risk ON): Between 20 and 80 percentile.
Risk OFF (Bearish): When the percentile rises above the upper threshold (default: 80).
Important : Background Coloring is NOT a Leading Signal.
The background color provides a visual representation of valuation periods, but it is not a leading indicator for price movements. Instead, traders should focus on the orange US10Y Range Percentile line, which is the key signal within this indicator. The colors behind the line below the chart are leading. The background colors behind the price chart are more of a valuation style indications.
When the orange line enters the Danger Zone (above 80 percentile), it signals that yields are elevated, and risk assets (such as stocks and crypto) are at increased risk of reversing downward.
While the background coloring helps to visualize market conditions, price reversals tend to occur when the percentile line is in extreme zones rather than when the background color changes.
Traders should monitor the percentile line closely, as it provides a clearer signal of potential shifts in market sentiment.
Visual Elements
Range Percentile Plot:
Displays the smoothed or raw percentile value over time.
Helps identify shifts in yield positioning.
Threshold Markers & Fill Zones:
Key percentile thresholds (0, 20, 80, 100) are marked with horizontal lines.
The area between 20-80 percentile is filled to indicate the neutral zone.
Extreme zones are highlighted to emphasize significant shifts in risk sentiment.
Dynamic Labeling:
A real-time percentile label appears next to the latest data point.
Alerts & Notifications
Risk OFF to Risk ON Transition:
Alert triggers when the percentile falls below the lower threshold (yields decreasing).
Risk ON to Risk OFF Transition:
Alert triggers when the percentile rises above the upper threshold (yields increasing).
Conclusion
The crypto market is highly sensitive to macroeconomic conditions, with Bitcoin often behaving like a high-beta tech stock.
A declining US10Y yield signals looser financial conditions, increasing demand for risk assets like crypto.
A rising US10Y yield tightens liquidity, leading to sell-offs in Bitcoin, Ethereum, and altcoins.
Tracking the US10Y percentile position helps traders anticipate market shifts before they occur.
This indicator serves as a leading signal for understanding market risk appetite by tracking Treasury yield movements. A decline in yields typically favors equities and risk assets, while rising yields indicate a shift toward safety and risk aversion.
Credits
This indicator was inspired by and builds upon the work of TomasOnMarkets . While incorporating significant enhancements, it acknowledges the foundational concepts provided by this original source. Thank you for sharing your input on this important indicator. We are honored to use it and to further improve upon it.
-Jeffrey

SPY/TLT Strategy█ STRATEGY OVERVIEW
The "SPY/TLT Strategy" is a trend-following crossover strategy designed to trade the relationship between TLT and its Simple Moving Average (SMA). The default configuration uses TLT (iShares 20+ Year Treasury Bond ETF) with a 20-period SMA, entering long positions on bullish crossovers and exiting on bearish crossunders. **This strategy is NOT optimized and performs best in trending markets.**
█ KEY FEATURES
SMA Crossover System: Uses price/SMA relationship for signal generation (Default: 20-period)
Dynamic Time Window: Configurable backtesting period (Default: 2014-2099)
Equity-Based Position Sizing: Default 100% equity allocation per trade
Real-Time Visual Feedback: Price/SMA plot with trend-state background coloring
Event-Driven Execution: Processes orders at bar close for accurate backtesting
█ SIGNAL GENERATION
1. LONG ENTRY CONDITION
TLT closing price crosses ABOVE SMA
Occurs within specified time window
Generates market order at next bar open
2. EXIT CONDITION
TLT closing price crosses BELOW SMA
Closes all open positions immediately
█ ADDITIONAL SETTINGS
SMA Period: Simple Moving Average length (Default: 20)
Start Time and End Time: The time window for trade execution (Default: 1 Jan 2014 - 1 Jan 2099)
Security Symbol: Ticker for analysis (Default: TLT)
█ PERFORMANCE OVERVIEW
Ideal Market Conditions: Strong trending environments
Potential Drawbacks: Whipsaws in range-bound markets
Backtesting results should be analyzed to optimize the MA Period and EMA Filter settings for specific instruments

Risk Matrix [QuantraSystems]Risk Matrix
The Risk Matrix is a sophisticated tool that aggregates a variety of fundamental inputs, primarily external (non-crypto) market data is used to assess investor risk appetite. By combining external macroeconomic factors and proxies for liquidity data with specific signals from the cryptomarket - the Risk Matrix provides a holistic view of market risk conditions. These insights are designed to help traders and investors make informed decisions on when to adopt a risk-on or risk-off approach.
Core Concept
The Risk Matrix functions as a dynamic risk assessment tool that integrates both fundamental and technical market indicators to generate an aggregated Z-score. This score helps traders to identify where the market is in a risk-off or risk-on state, The system provides both binary risk signals and a more nuanced “risk seasonality” mode for deeper analysis.
Key Features
Global Liquidity Aggregate - The Liquidity score is a custom measure of global liquidity, built by combining a variety of traditional financial metrics. These include data from central bank balance sheets, reverse repo operations and credit availability. This data is sourced from organizations such as the U.S. Federal Reserve, the European Central Bank, and the People’s Bank of China. The purpose of this aggregate is to gauge how much liquidity is available in the global financial system - which often correlates with risk sentiment. Rising liquidity tends to boost risk-on appetite, while liquidity contractions signal increased caution (risk-off) in the markets. The data sources used in this global liquidity aggregate include:
- U.S. Commercial Bank Credit data
- Federal Reserve balance sheet and reverse repo operations
- Liquidity from major central banks including the Fed, Bank of Japan, ECB, and PBoC
- Asset performance from major global financial indices such as the S&P 500, TLT, DXY (U.S. Dollar Index), MOVE (bond market volatility), and commodities like gold and oil.
Other key Z-scores (measured individually) - The Risk Matrix also incorporates other major Z-scores that represent different facets of the financial markets:
- Collateral Risk - A measure of US bond volatility, where higher values indicate higher interest rate risk - leading to potential market instability and cautious market behaviors.
- Stablecoin Dominance - The dominance of stablecoins in the crypto markets - which can signal risk aversion the total capital allocated to stables increases relative to other cryptocurrencies.
- US Currency Strength - The U.S. Dollar Index Z-score reflects currency market strength, with higher values typically indicating risk aversion as investors sell more volatile assets and flock to the dollar.
- Trans-pacific Monetary Bias - Signals capital flow and monetary trends that link between the East and West, heavily influencing global risk sentiment.
- Total - A measure of the total cryptocurrency market cap, signaling broader risk sentiment with the crypto market.
Neural Network Synthesis - The NNSYNTH component adds a machine learning inspired layer to the Risk Matrix. This custom indicator synthesizes inputs from various technical indicators (such as RSI, MACD, Bollinger Bands, and others) to generate a composite signal that reflects the health of the cryptomarket. While highly complex in its design, the NNSYNTH ultimately helps detect market shifts early by synthesizing multiple signals into one cohesive output. This score is particularly useful for gauging momentum and identifying potential turning points in market trends. Because the NNSYNTH is a closed source indicator, and it is included here, the Risk Matrix by extension is a closed source indicator.
How it Works
Z-score Aggregation - The Risk Matrix computes a final risk score by aggregating several Z-scores from different asset classes and data sources, all of which contribute proportionally to the overall market risk assessment. Each input is equally weighted - normalization allows for direct comparisons across global liquidity trends, currency fluctuations, bond market volatility and crypto market conditions. Furthermore, this system employs multi-calibration aggregation - where each individual matrix is itself an aggregate of multiple Z-scores derived from various timeframes. This ensures that each matrix captures a distinct average across different time horizons before being combined into the overall Risk Matrix. This layered, multi timeframe approach enhances the precision and robustness of the final Z-score.
Risk-On / Risk-Off Mode - The system’s binary mode provides a clear Risk On and Off signal. This nature of this signal is determined by the behavior of the Z-score relative to the midline, or Standard Deviation Bands, depending on specific conditions:
Risk-On is signaled when the aggregated final Z-score crosses above 0. However, in extreme oversold conditions, Risk-On can trigger early if the upper standard deviation band falls below the zero line. In such cases, the Risk-On signal is triggered when the z-score crosses the upper standard deviation band - without waiting to cross the midline.
Risk-Off is signaled when the final Z-score moves below 0. Similarly, Risk-Off can also be triggered early if the lower standard deviation band rises above the midline. In this instance, Risk-Off is triggered when the Z-score crosses below the lower band.
Risk Seasonality Mode - This mode offers a more gradual transition between risk states, measuring the change in the Z-score to visualize the shifts in risk appetite over time. It's useful for traders seeking to understand broader market cycles and risk phases. The seasonality view breaks down the market into the following phases:
Risk-On - High risk appetite where risk/cyclical markets are generally bullish.
Weakening - Markets showing signs of cooling off, here the higher beta assets tend to sell off first.
Risk-Off - Investors pull back, and bearish sentiment prevails.
Recovery - Signs of bottoming out, potential for market re-entry.
Component Matrices - Each individual Z-score is visualized as part of the component matrices - scaled to a 3 Sigma range. These component matrices allow traders to view how each data source is contributing to the overall risk assessment in real time - offering transparency and granularity.
Visuals and UI
Main Risk Matrix - The aggregated Z-Score is displayed saliently in the main risk matrix. Traders and investors can quickly see what season the Risk Matrix is signaling and adjust their strategies accordingly.
Overview Table - A detailed overview table shows the current confirmed Z-scores for each component, along with values from 2, and 3 bars back. This helps traders spot trends and the rate of change (RoC) between signals, offering additional insights for shorter-term risk management.
Customizability - Users can customize the visual elements of the matrix, including color palettes, table sizes, and positions. This allows for optimal integration into any trader’s existing workspace.
Usage Summary
The Risk Matrix is an incredibly versatile tool. It is especially valuable as a means of achieving a cross-market view of risk, incorporating both crypto-specific and macroeconomic factors. Some key use cases include:
Adjusting Capital Allocation Based on Risk Seasons - Traders can use the Risk Matrix to adjust their capital allocation dynamically. During Risk-On periods, they might increase exposure to long positions, capitalizing on stronger market conditions. Conversely, during Risk-Off periods, traders could reduce or hedge long positions and potentially scale up short positions or move into safer assets.
Complementing Other Trading Systems - The Risk Matrix can work alongside other technical systems to provide context to market moves. For instance, a trend-following strategy might suggest an entry, but the Risk Matrix could be used to verify whether the broader market conditions support this trade. If the Matrix is in a Risk-Off period, a trader might opt for more conservative trade sizes or avoid the trade entirely.
This flexibility allows traders to adjust their strategies and portfolio risk dynamically, enhancing decision making based on broader market conditions - as indicated by external macroeconomic factors, liquidity, and risk sentiment.
Important Note
The Risk Matrix always uses the most up-to-date data available, ensuring analysis reflects the latest market conditions and macroeconomic inputs. In rare cases, governments or financial institutions revise past data - and the Risk Matrix will adjust accordingly. This behavior can only be seen in the Liquidity Matrix. and can affect the final score. While this is uncommon, it highlights the benefit of using a system that adapts in real-time, incorporating the most accurate and current information to enhance decision making processes.

Yield Spread (10Y - 2Y)Yield Spread
The green line shows the difference between the 10-Year and 2-Year yields.
Positive Spread: When the green line is above zero, the 10-Year yield is higher than the 2-Year yield. This is normal and indicates an upward-sloping (normal) yield curve, which typically suggests a healthy economy with expectations of future growth.
Flattening Curve: If the green line approaches zero, the yield curve is flattening, indicating that investors are uncertain about future economic growth. They are demanding similar yields for both short and long-term bonds.
Negative Spread (Inverted Yield Curve): If the green line goes below zero, this means the 2-Year yield is higher than the 10-Year yield, creating an inverted yield curve. An inverted curve is often seen as a predictor of a recession, as it indicates that investors expect weaker economic conditions in the future.
Short Explanation of the Chart layout:
This chart tracks U.S. Treasury yields for 2-year (blue), 10-year (white), and 30-year (orange) bonds, along with the yield spread (green) between the 10-year and 2-year bonds. A positive spread suggests a normal yield curve and economic growth, while a negative spread (inversion) often signals a potential recession.

PUMP IndicatorsPUMP Indicator Description
★ Supported Markets and Assets
The PUMP indicator is a versatile tool that can be effectively applied to various markets and assets, including:
▶ Korean Stocks: KOSPI, KOSDAQ, etc.
▶ U.S. Stocks: NYSE, NASDAQ, etc.
▶ Cryptocurrencies: Major cryptocurrencies such as Bitcoin (BTC), Ethereum (ETH), etc.
▶ Futures: Major futures contracts like gold, silver, crude oil, etc.
▶ ETFs: SPY, QQQ, etc.
★ Indicator Description
The PUMP indicator is designed to analyze price divergence and volatility.
It is provided with minimal representation on the chart, allowing users to use it in conjunction with other indicators, such as classical RSI, TRIX, CCI, ADX, BWI, Bollinger Bands, etc.
Everything displayed on the chart can be turned on or off in the options, allowing users to customize their setup.
The PUMP indicator is based on the concept of the MACD indicator, which calculates the difference between the leading line and the lagging line to generate signals.
GOOD, UP, and CR signals predict price increases.
DOWN and BAD signals predict price decreases.
WARN emphasizes that the buy position is not certain, regardless of price increases or decreases.
Therefore, the PUMP indicator is good to use with other indicators. It visually displays divergence and volatility signals along with the MACD movements below, and users can receive alerts for movements in their interested stocks using the alarm function.
It can be used as an indicator for viewing buy and sell signals, as well as predicting the price flow.
▶ (Drawback) Unlike typical TRIX, RSI, TRIX, CCI, ADX, BWI indicators, which are implemented in a new lower window, the PUMP indicator displays both signals and the leading and lagging lines simultaneously, so it is not implemented in a new window, meaning the baseline may vary depending on the daily chart appearance.
★ The PUMP indicator consists of the following components:
▶ PUMP Indicator Leading and Lagging Lines
PUMP t: Leading line (yellow)
PUMP p: Lagging line (blue)
The MACD displayed at the bottom of the chart calculates the divergence between the PUMP t leading line and the PUMP p lagging line.
▶ EA Formula
The core calculation of the PUMP indicator is as follows:
EA (Exponential Average): 100 * (eavg1 / eavg2)
Where eavg1 is the short-term EMA, and eavg2 is the long-term EMA.
It calculates the divergence of the index.
▶ The PUMP indicator is a fixed indicator (cannot be arbitrarily modified).
▶ Highlights: The method of calculating the interval or number of uses is an important part of the index calculation and is therefore private.
★ Signal Description
The PUMP indicator provides a total of six major signals:
▶ UP Signal: Occurs when the divergence between the MACD PUMP t leading line and PUMP p lagging line narrows, and the divergence of the exponential moving average widens compared to before.
▶ DOWN Signal: Occurs when the MACD PUMP t leading line crosses above the PUMP p lagging line.
▶ GOOD Signal: Represents an UP signal with added volume.
(The GOOD signal is not necessarily better than the UP signal. If a GOOD signal appears in a stock that has sufficiently fallen in price, it helps understand that a rebound has started. Therefore, the GOOD signal is made to find a rebound in stocks that have continuously declined, rather than finding signals in consistently rising prices.)
▶ BAD Signal: Occurs when the PUMP t leading line crosses above the 0 baseline, indicating a potential sell signal.
▶ WARN Signal: A warning signal occurring at high levels, indicating that buying is not recommended (regardless of buy or sell).
▶ CR Signal: Occurs in all sections where the PUMP t leading line crosses below the PUMP p lagging line.
★ Lower MACD Horizontal Baseline
The PUMP indicator provides three horizontal baselines from the MACD indicator for additional analysis:
▶ Pump H
▶ PUMP M
▶ PUMP L
It visually provides the divergence of the lower MACD indicator for rising and falling changes, with the default set to 0, and users can change the numbers in the options as needed.
★ Moving Averages
The PUMP indicator provides three basic moving averages:
▶ Buzz 7: 7-day moving average
▶ Buzz 26: 26-day moving average
▶ Buzz 120: 120-day moving average
The number of moving averages is fixed, but users can use them in conjunction with the moving averages provided by TradingView as needed.
★ Alert Function
Using the Alert function of TradingView, you can set alerts for various signals generated by the PUMP indicator.
▶ GOOD Signal Alert
▶ UP Signal Alert
▶ CR Signal Alert
▶ DOWN Signal Alert
▶ BAD Signal Alert
▶ WARN Signal Alert
★ Usage
1. The PUMP indicator is not focused on buy and sell signals but calculates the current price movement and divergence and is designed to express it through MACD leading and lagging lines and signals.
2. The PUMP indicator can be used alone or in conjunction with other indicators for technical analysis.
3. You can analyze buy and sell using the signals of the PUMP indicator along with fundamental analysis, such as news, issues, national policies, company profits, and sales increases.
4. The MACD leading and lagging lines at the bottom of the chart move inversely to the price, ensuring that the PUMP indicator does not interfere when used with other indicators.
5. You can receive real-time alerts using the alarm function.
Below, we attach pictures to help users understand.
============================================
PUMP 인디케이터 설명(한글)
★ 지원되는 시장 및 자산
PUMP 표시기는 다음과 같은 다양한 시장 및 자산에 효과적으로 적용할 수 있는 다용도 도구입니다:
▶ 한국주식: KOSPI, KOSDAQ 등.
▶ 미국주식: NYSE, NASDAQ 등.
▶ 암호화폐: 비트코인(BTC), 이더리움(ETH) 등 주요 암호화폐.
▶ 선물 : 금, 은, 원유 등 주요 선물 계약.
▶ 상장지수펀드(ETF) : SPY, QQQ 등.
★ 지표 설명
PUMP 지표는 가격 이격과 변동성을 분석하도록 설계되었습니다.
사용자가 만든 지표 또는 고전 RSI, TRIX, CCI, ADX, BWI, Bollinger Bands 등과 함께 사용할 수 있게 차트에 최소한의 표현으로 제공됩니다.
그리고 차트에 표현되는 모든 것들을 옵션에서 on / off 가능하게 하였기에 사용자가 커스텀 할 수 있게 하였습니다.
PUMP 지표 신호를 생성하기 위해 선행 라인과 후행 라인 간의 차이를 계산하는 MACD 지표의 개념을 기반으로 합니다.
GOOD, UP, CR 신호는 가격 상승을 예측합니다.
DOWN, BAD 신호는 가격 하락을 예측합니다.
WARN은 가격 상승과 하락에 관계없이, 매수 자리는 확실히 아님을 강조한 신호입니다.
그러므로 PUMP 지표는 다른 지표와 함께 사용하기 좋고, 이격과 변동성을 신호와 하단 MACD 움직임을 눈으로 볼 수 있으며, 알람 기능을 활용하여 관심 있는 종목의 움직임을 알람으로 받아 볼 수 있는 지표입니다.
매수와 매도를 보는 지표로 사용할 수 있으며, 가격의 흐름을 예상하는 지표로 사용할 수 있습니다.
▶ (단점) 보통의 TRIX, RSI, TRIX, CCI, ADX, BWI 지표들은 하단의 새로운 창에서 구현됩니다. 하지만 PUMP 지표는 신호와 하단 선행과 후행을 동시에 표현하기 때문에 새로운 창에서 구현되지 않기에 기준 축이 일봉의 모습에 따라 달라질 수 있습니다.
★ PUMP 지표는 다음과 같은 구성요소로 구성됩니다
▶ PUMP 지표 선행과 후행
PUMP t : 선행라인 (노란색)
PUMP p : 후행라인 (파란색)
차트 하단에 나타나는 MACD는 PUMP t선행라인과 PUMP p 후행라인의 이격도를 계산합니다.
▶ EA공식
PUMP 지표의 핵심 계산식은 다음과 같습니다:
EA(지수평균): 100 * (eavg1 / eavg2)
여기서 eavg1은 단기 EMA이고 eavg2는 장기 EMA입니다.
지수의 이격도를 계산합니다.
▶ PUMP 지표는 고정 지표입니다. (임의 수정 불가)
▶ 강조 : 이격의 계산법이나 사용하는 숫자는 지표 계산의 중요한 부분이므로 비공개입니다.
★ 신호 설명
PUMP 표시등은 총 6개의 주요 신호를 제공합니다:
▶ UP 신호: MACD PUMP t 선행과 PUMP p 후행의 이격이 줄어들 때, 지수 이동 평균의 이격도가 이전 보다 넓어지면 발생합니다.
▶ DOWN 신호: MACD PUMP t 선행이 PUMP p 후행을 상향 교차할 때 발생합니다.
▶ GOOD 신호: 거래량이 추가된 UP 신호를 나타냅니다.
(GOOD 신호가 UP 신호보다 좋다기 보다, 충분히 가격 하락한 종목에서 GOOD 신호가 나온다면 반등이 시작되는 것을 이해할 수 있게 만든 지표입니다. 그러므로 GOOD 신호는 가격이 꾸준히 상승하는 곳에서 신호를 찾기보다, 지속 하락하다 반등을 찾는 신호로 만들었습니다.)
▶ BAD 신호: PUMP t 선행이 0 기준선 이상으로 교차할 때 발생하며, 이는 잠재적인 판매 신호를 나타냅니다.
▶ 경고 신호: 높은 수준에서 발생하는 경고 신호로, 매수가 권장되지 않음을 나타냅니다(매수, 매도와 무관함).
▶ CR 신호: PUMP t 선행 라인이 PUMP p 후행 라인 아래로 교차하는 모든 구간에서 발생합니다.
★ 하단 MACD 가로 기준선
PUMP 표시기는 추가 분석을 위해 MACD 지표에서 3가지 가로 기준을 제공합니다:
▶ pump H
▶ PUMP M
▶ PUMP L
하단의 MACD 지표의 이격도를 상승 및 하강의 변화를 시각적으로 기준을 만들 수 있게 제공하며, 기본은 0으로 제공하고, 사용자의 필요에 따라 옵션에서 숫자를 변경할 수 있게 하였습니다.
★ 이동 평균
PUMP 표시기는 세 가지 기본 이동 평균을 제공 합니다:
▶ Buzz 7: 7일 이동 평균
▶ Buzz 26: 26일 이동 평균
▶ Buzz 120 : 120일 이동 평균
이동 평균의 수는 고정되어 있지만, 사용자는 필요에 따라 TradingView에서 제공하는 이동 평균과 함께 사용할 수 있습니다.
★ 알림 기능
TradingView의 Alert 기능을 사용하여 PUMP 지표 생성되는 다양한 신호에 대한 Alert를 설정할 수 있습니다.
▶ GOOD 신호 알림
▶ UP 신호 알림
▶ CR 신호 알림
▶ DOWN 신호 알림
▶ BAD 신호 알림
▶ WARN 신호 알림
★ 사용법
1.PUMP 지표는 매수와 매도에 중점을 둔 지표가 아니며 현재 가격의 움직임과 이격도를 계산하며 MACD 선행과 후행 그리고 신호로 표현하기 위해 만들어진 지표입니다.
2. PUMP 지표는 단일로 사용할 수 있고, 또는 다른 지표와 함께 기술적분석으로 사용할 수 있습니다.
3. 뉴스와 이슈, 국가의 정책, 회사의 이익, 매출의 상승 등 기본적분석과 함께 PUMP 지표의 신호를 이용하여 매수와 매도 분석을 할 수 있습니다.
4. 차트 하단의 MACD 선행과 후행은 가격의 움직임을 반대로 움직이며, 가격과 반대로 움직이게 함으로써 다른 지표와 함께 사용하였을 때, PUMP 지표가 방해가 되지 않게 하였습니다.
5. 알람을 사용하여 실시간으로 알람을 받아 보실 수 있습니다.
아래 사진을 첨부하여 사용자 이해를 돕습니다.
============================================
UP신호는 이격을
▶ The UP signal indicates horizontal divergence.
CR신호는 선행이 후행을 아래로 돌파
▶ The CR signal indicates vertical divergence when the leading line crosses below the lagging line.
WARN 신호를 확인
▶ Check the WARN signal.
BAD와 DOWN 신호
▶ BAD and DOWN signals.
PUMP 지표의 기준 3개
3 criteria for PUMP indicators
따로 그림을 그리지 않은 차트
▶ A chart without separate drawings.
============================================
다른 지표와 + 조합
+ Combination with other indicators

Yield Curve SpaghettiDisplays the difference in yield between multiple bond pairs for a given country.
Currently supports US, DE, and GB bonds

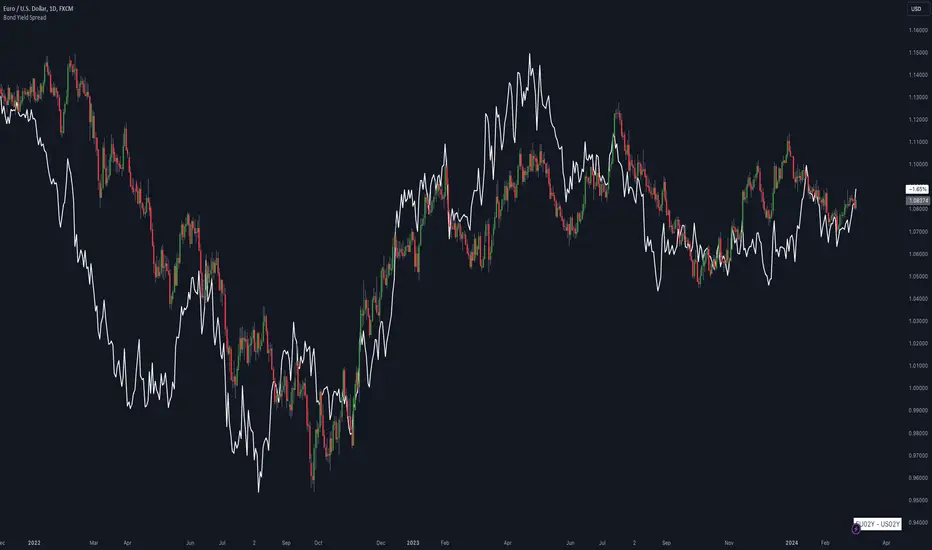
Bond Yield SpreadThe Bond Yield Spread Script is developed for forex traders, offering an automated tool to calculate the bond yield spread between two countries associated with the forex pair displayed on the chart.
Functionality:
The script starts by identifying the base and quote currencies of the current forex pair and aligns them with their corresponding national bond symbols based on user-selected maturity, with options ranging from 01Y to 30Y. It calculates the yield spread by subtracting the bond yield associated with the quote country from that of the base country, following the formula:
Yield Spread = Yield(Base Country) − Yield(Quote Country)
which is then displayed as a plot line on the chart.
This script relies solely on TradingView's internal yield symbols, with the following calculation:
"currency" => "first two letters" + maturity
And maturity, in this case, is the value that is configured in the indicator settings, for example:
"EUR" => "EU" + "02Y" will result in EU02Y -> which will be used in the formula, depending on the quote or base currency.
Application in Trading:
This indicator is invaluable for traders employing carry trading strategies or assessing currency strength based on traded interest rates as an indicator. A higher yield spread typically indicates a stronger currency, because the return obtained for holding the currency is higher.
Originality and Practicality:
This script is self-developed, aiming to fill the gap in automatic bond yield comparisons within the TradingView environment. It is particularly beneficial for traders focusing on macroeconomic factors affecting forex markets. Unlike other scripts, it integrates various bond maturities into one tool, enhancing its utility and application range.
Conclusion:
Designed for traders incorporating macroeconomics in their strategy, this script will be useful to calculate the bond yield differences automatically without having to enter a new formula for every new currency pair.
Compliance and Limitations:
The script complies with TradingView scripting standards, ensuring no lookahead bias and maintaining real-time data integrity. However, its utility depends on the comprehensive availability of bond yield data within TradingView. As not all countries issue bonds for each listed maturity, this may limit the script’s application for certain currency pairs or specific maturities.
Treasury Yields Heatmap [By MUQWISHI]▋ INTRODUCTION :
The “Treasury Yields Heatmap” generates a dynamic heat map table, showing treasury yield bond values corresponding with dates. In the last column, it presents the status of the yield curve, discerning whether it’s in a normal, flat, or inverted configuration, which determined by using Pearson's linear regression coefficient. This tool is built to offer traders essential insights for effectively tracking bond values and monitoring yield curve status, featuring the flexibility to input a starting period, timeframe, and select from a range of major countries' bond data.
_______________________
▋ OVERVIEW:
______________________
▋ YIELD CURVE:
It is determined through Pearson's linear regression coefficient and considered…
R ≥ 0.7 → Normal
0.7 > R ≥ 0.35 → Slight Normal
0.35 > R > -0.35 → Flat
-0.35 ≥ R > -0.7 → Slight Inverted
-0.7 ≥ R → Inverted
_______________________
▋ INDICATOR SETTINGS:
#Section One: Table Setting
#Section Two: Technical Setting
(1) Country: Select country’s treasury yields data
(2) Timeframe: Time interval.
(3) Fetch By:
(3A) Date: Retrieve data by beginning of date.
(3B) Period: Retrieve data by specifying the number of time series back.
Enjoy. Please let me know if you have any questions.
Thank you.

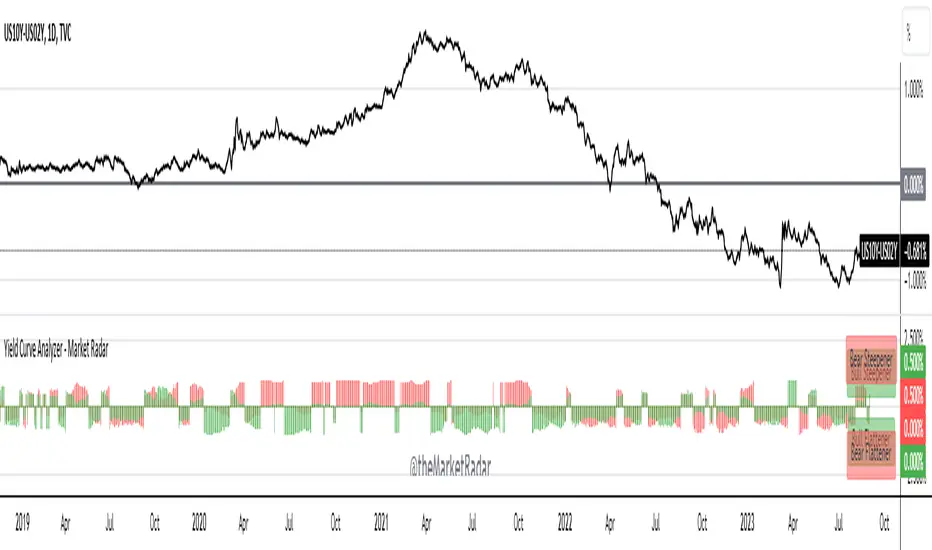
Yield Curve Analyzer - Market RadarThis is a script that gives insight into the types of moves that are happening across the yield curve. It helps in identifying both bull/bear steepeners and flatteners between two tenors.
The indicator displays data as a percentage of the steepeners and flatteners that have occurred over a short-term trailing window. This gives a reading that is more digestible with less noise.
Currently, the indicator only displays data for the 10Y-2Y US Treasury yield spread.
We intend to add additional spreads in the near future; such as 10Y-3M, 30Y-5Y, and 30Y-2Y.
CE - 42MACRO Fixed Income and Macro This is Part 2 of 2 from the 42MACRO Recreation Series
However, there will be a bonus Indicator coming soon!
The CE - 42MACRO Fixed Income and Macro Table is a next level Macroeconomic and market analysis indicator.
It aims to provide a probabilistic insight into the market realized GRID Macro regimes,
track a multiplex of important Assets, Indices, Bonds and ETF's to derive extra market insights by showing the most important aggregates and their performance over multiple timeframes... and what that might mean for the whole market direction.
For traders and especially investors, the unique functionalities will be of high value.
Quick guide on how to use it:
docs.google.com
WARNING
By the nature of the macro regimes, the outcomes are more accurate over longer Chart Timeframes (Week to Months).
However, it is also a valuable tool to form an advanced,
market realized, short to medium term bias.
NOTE
This Indicator is intended to be used alongside the 1nd part "CE - 42MACRO Equity Factor"
for a more wholistic approach and higher accuracy.
Methodology:
The Equity Factor Table tracks specifically chosen Assets to identify their performance and add the combined performances together to visualize 42MACRO's GRID Equity Model.
For this it uses the below Assets:
Convertibles ( AMEX:CWB )
Leveraged Loans ( AMEX:BKLN )
High Yield Credit ( AMEX:HYG )
Preferreds ( NASDAQ:PFF )
Emerging Market US$ Bonds ( NASDAQ:EMB )
Long Bond ( NASDAQ:TLT )
5-10yr Treasurys ( NASDAQ:IEF )
5-10yr TIPS ( AMEX:TIP )
0-5yr TIPS ( AMEX:STIP )
EM Local Currency Bonds ( AMEX:EMLC )
BDCs ( AMEX:BIZD )
Barclays Agg ( AMEX:AGG )
Investment Grade Credit ( AMEX:LQD )
MBS ( NASDAQ:MBB )
1-3yr Treasurys ( NASDAQ:SHY )
Bitcoin ( AMEX:BITO )
Industrial Metals ( AMEX:DBB )
Commodities ( AMEX:DBC )
Gold ( AMEX:GLD )
Equity Volatility ( AMEX:VIXM )
Interest Rate Volatility ( AMEX:PFIX )
Energy ( AMEX:USO )
Precious Metals ( AMEX:DBP )
Agriculture ( AMEX:DBA )
US Dollar ( AMEX:UUP )
Inverse US Dollar ( AMEX:UDN )
Functionalities:
Fixed Income and Macro Table
Shows relative market Asset performance
Comes with different Calculation options like RoC,
Sharpe ratio, Sortino ratio, Omega ratio and Normalization
Allows for advanced market (health) performance
Provides the calculated, realized GRID market regimes
Informs about "Risk ON" and "Risk OFF" market states
Visuals - for your best experience only use one (+ BarColoring) at a time:
You can visualize all important metrics:
- GRID regimes of the currently chosen calculation type
- Risk On/Risk Off with background colouring and additional +1/-1 values
- a smoother GRID model
- a smoother Risk On/ Risk Off metric
- Barcoloring for enabled metric of the above
If you have more suggestions, please write me
Fixed Income and Macro:
The visualisation of the relative performance of the different assets provides valuable information about the current market environment and the actual market performance.
It furthermore makes it possible to obtain a deeper understanding of how the interconnected market works and makes it simple to identify the actual market direction,
thus also providing all the information to derive overall market health, market strength or weakness.
Utility:
The Fixed Income and Macro Table is divided in 4 Columns which are the GRID regimes:
Economic Growth:
Goldilocks
Reflation
Economic Contraction:
Inflation
Deflation
Top 5 Fixed Income/ Macro Factors:
Are the values green for a specific Column?
If so then the market reflects the corresponding GRID behavior.
Bottom 5 Fixed Income/ Macro Factors:
Are the values red for a specific Column?
If so then the market reflects the corresponding GRID behavior.
So if we have Goldilocks as current regime we would see green values in the Top 5 Goldilocks Cells and red values in the Bottom 5 Goldilocks Cells.
You will find that Reflation will look similar, as it is also a sign of Economic Growth.
Same is the case for the two Contraction regimes.
******
This Indicator again is based to a majority on 42MACRO's models.
I only brought them into TV and added things on top of it.
If you have questions or need a more in-depth guide DM me.
GM

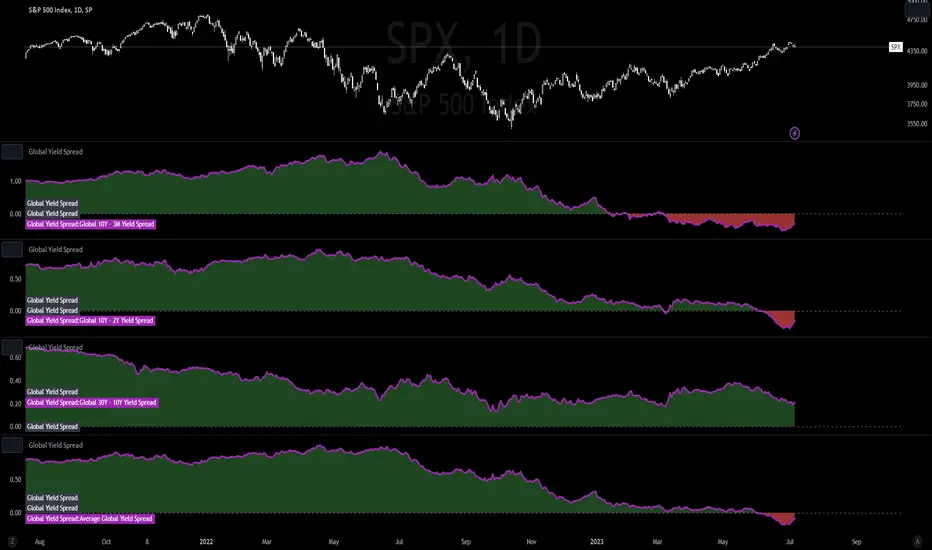
Global Yield SpreadThe Global Yield Spread is a simple indicator that can help to identify economic wellbeing and thus allows traders and investors alike to derive a rough estimation onto where the market is likely to go.
----------
Please note that things like Yield Spread generally influence the market only over longer time horizons of a couple weeks to many months.
Also be aware that the Yield Spread is only capable of measuring the Yields on Bonds and is thus limited to only changes that are reflected in the interest rates on the Bonds.
----------
The Normal Yield Spread is widely recognized for it's signal abilities for recessions or general economic well being...
However, since the rates have decreased drastically in the US something else has been proposed: The Global Yield Spread
As the normal US Yield Spread is loosing signal capacity because the US government can easily borrow money from overseas,
thus reducing the need to increase interest rates.
By monitoring and analyzing the Global Yield spread, traders and investors can gain insights into relative valuations, economic movements, market sentiment, and opportunities.
It can help inform their investment decisions and strategies, allowing them to allocate capital more effectively and potentially generate better returns.
You have options to visually represent a diversity of Countries and their according Yield Spreads.
Furthermore there are Global Yield Spreads for:
10Y-03MY
10Y-02Y
30Y-10Y
The Average Global Yield Spread encompasses the 3 options above to get an average reading.
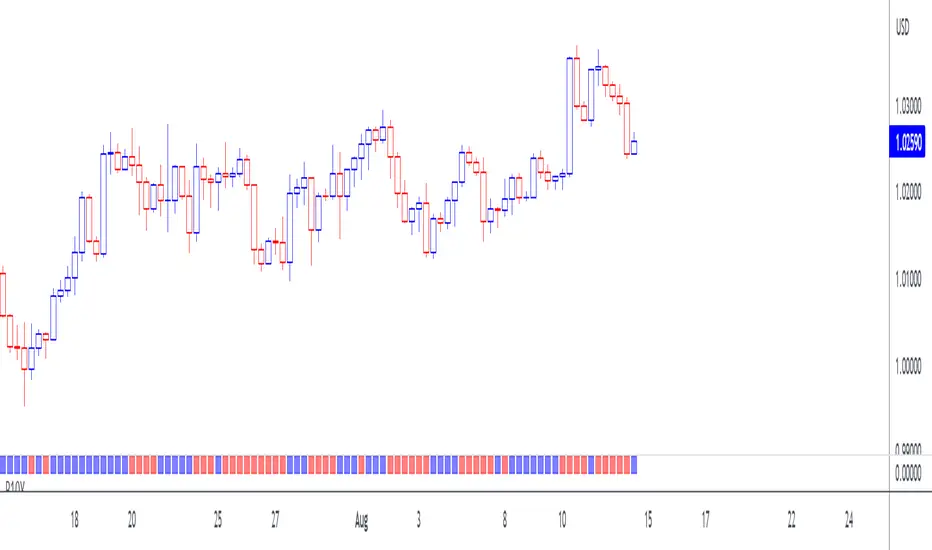
Market Relative Candle Ratio ComparatorIntroducing the Market Relative Candle Ratio Comparator, a visually captivating script that eases the way you compare two financial assets, such as cryptocurrencies and market indices. Leveraging a distinctive calculation method based on percentage changes and their averages, this tool presents a crystal-clear view of how your chosen assets perform in relation to each other, both for individual candles and over a range of previous candles.
Tailoring the script to your preferences is a walk in the park, as it allows you to easily adjust input symbols, moving average lengths, and other parameters to match your analytical approach. The visually arresting column chart it creates employs vivid red and green colors to underscore the differences between the two assets on each candle. Simultaneously, the lower-opacity columns depict the accumulated differences over a specified lookback period. This vibrant blend of colors and opacities results in a dynamic visual experience, enabling you to better grasp market trends relative to each other.
The reverse bool input is a handy feature that lets you invert the effect of the input symbol (DXY by default) in the comparison. When you set the reverse input to true, the script multiplies the calculated DXY percentage change by -1, effectively reversing the comparison. This is particularly useful when examining assets with an inverse relationship or when you'd like to analyze the input symbol's impact in the opposite direction.
For instance, if the input symbol represents a market index that generally moves in the opposite direction of the selected cryptocurrency, enabling the reverse input will help you better visualize and understand the relationship between the two assets by inverting the input symbol's effect on the comparison.
In the accompanying chart, you can observe the comparison of Bitcoin's movement relative to the Dollar, Gold, Bonds, and the S&P 500. The indicator reveals that in the last day, Bitcoin outperformed Bonds, Gold, and the Dollar but not the S&P 500!

Bonds: US Yields for 3Y, 5Y, 7Y, 10Y, 30Y, 10Y-2YDisplays US Bond Yields for 3Y, 5Y, 7Y, 10Y, 30Y, 10Y-2Y.
Best used on a cart that has a similar Y-Axis... for example, using this indicator on the TVC:US10Y chart works.
Added some bells and whistles such as a tabular chart for current rate as well as ability to turn on off specific yields (in the settings cog)
This is my first publish!
So please let me know what you think... or if something is wrong :)

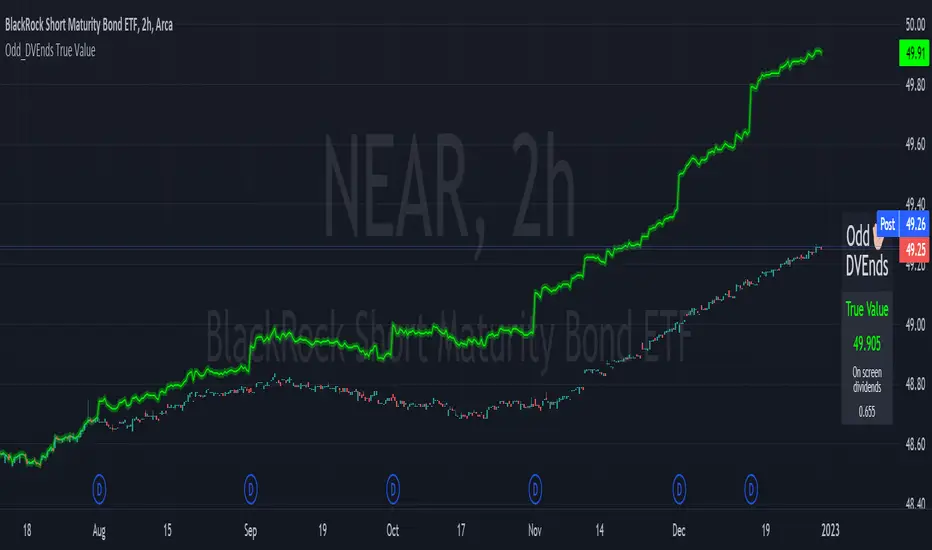
Odd_DVEnds Dividend True Value💸 True Value = Close Price + Accumulated Dividends
◆ Using only the time displayed on screen of the chart, the script will calculate the True Value of the symbol. (Calculations start from first bar you can see to the last bar you can see.)
Why do you need the true value?
Anytime an asset pays a dividend the current market price doesn't reflect the actual value you would have received over time from holding said asset. Without this price information fairly comparing assets is difficult.
🗻 Selectable themed legend
🎨 Highly Customizable
⚠️ As of the first release moving multiple charts on the same layout using sync will not always update all charts. Its recommended to use the bottom toolbar to move times if using indicator on multiple charts. Check for updates to see if this has been resolved.
Integrated Implied Volatility C/FThe integrated version of IV CAP/FLOOR Premium and Bitcoin IV C/F.
Illustrating Cap-Floor bands based on statistical calculations using the implied volatility of Bitcoin, foreign currency pairs, commodities, bonds, and indexes.

Yield Curve (1-10yr)Yield curve of the 1-10 year US Treasury Bonds, with over 60 years of history.
The Yield Curve is the interest rate on the 10 year bond minus the 1 year bond.
When it inverts (crosses under 0) a recession usually follows 6-12 months later.
It's a great leading indicator to identify risk in the macroeconomic environment.
Yield curves can be constructed on varying durations. Using a 1-year as the short-term bond provides a slightly faster response than the 2-year bond; and the 1-year has more historical data on TradingView.

Yield Curve (2-10yr)Yield curve of the 2-10 year US Treasury Bonds, with over 50 years of history.
The Yield Curve is the interest rate on the 10 year bond minus the 2 year bond.
When it inverts (crosses under 0) a recession usually follows 6-12 months later.
It's a great leading indicator to identify risk in the macroeconomic environment.

10-Year Bond Yields (Interest Rate Differential)With this little script, I have attempted to incorporate fundamental data (in this case, 10-year bond yields) into technical analysis . When pairing two currencies, the one with a higher bond interest rate usually appreciates when the interest rate differential widens, or, to use a simple example: in a currency pair A vs. B, with A showing a higher bond yield than B, a widening interest rate gap is likely to help A and create a buying opportunity (shown as a blue square at the bottom of the chart), while the opposite is true when the gap tightens (sell signal, red square).
While long-term investors know about and make use of the importance of bond yield fluctuations, most short-term traders tend to dismiss the idea of using fundamental data, mostly for lack of quantifiability and limited impact in an intraday environment. After extensive backtesting on daily and intraday charts (6-12 hours), however, I realized this indicator still managed to produce useful results (less useful than on monthly and yearly charts, to be fair, but still useful enough), especially when paired with simple price-driven indicators, such as Heikin Ashi or linear regression .
My personal (and thus subjective) thoughts: worth a try. Buy and sell signals frequently contradicted both more popular indicators and my gut feeling and managed to take out losing trades that I had considered trades with a high winning probability. In other words, when the market lures traders into seemingly promising trading decisions, this indicator might give you an early warning, especially when you manage to adjust period and continuity parameters to your trading strategy.
Currency pairs used in this script are all possible combinations of the eight majors. Each security has been assigned a name ("inst01" to "inst08" in the code) and a broker; if you make changes to the code, be sure not to mess with currency and broker names as this would render the entire script useless. Good luck trading, and feel free to suggest improvements!
Multi Yield CurveAn inversion between the 2 year and 10 year US treasury yield generally means a recession within 2 years. But the yield curve has more to it than that. This script helps analysis of the current and past yield curve (not limited to US treasury) and is very configurable.
"A yield curve is a line that plots yields (interest rates) of bonds having equal credit quality but differing maturity dates. The slope of the yield curve gives an idea of future interest rate changes and economic activity." (Investopedia)
When the slope is upward (longer maturity bonds have a higher interest rate than shorter maturity bonds), it generally means the economy is doing well and is expanding. When the slope is downward it generally means that there is more downside risk in the future.
The more inverted the curve is, and the more the inversion moves to the front, the more market participants are hedging against downside risk in the future.
The script draws up to 4 moments of a yield curve, which makes it easy to compare the current yield curve with past yield curves. It also draws lines in red when that part of the curve is inverted.
The script draws the lines with proper length between maturity (which most scripts do not) in order to make it more representative of the real maturity duration. The width cannot be scaled because TradingView does not allow drawing based on pixels.
This script is the only free script at time of writing with proper lengths, showing multiple yield curves, and being able to show yield curves other than the US treasury.
█ CONFIGURATION
(The following can be configured by clicking "Settings" when the script is added to a chart)
By default the script is configured to show the US treasury (government bond) yields of all maturities, but it can be configured for any yield curve.
A ticker represents yield data for a specific maturity of a bond.
To configure different tickers, go to the "TICKERS" section. Tickers in this section must be ordered from low maturity to high maturity.
• Enable: draw the ticker on the chart.
• Ticker: ticker symbol on TradingView to fetch data for.
• Months: amount of months of bond maturity the ticker represents.
To configure general settings, go to the "GENERAL" section.
• Period: used for calculating how far back to look for data for past yield curve lines. See "Times back" further in this description for more info.
• Min spacing: minimum amount of spacing between labels. Depending on the size of the screen, value labels can overlap. This setting sets how much empty space there must be between labels.
• Value format: how the value at that part of the line should be written on the label. For example, 0.000 means the value will have 3 digits precision.
To configure line settings per yield curve, each has its own "LINE" section with the line number after it.
• Enable: whether to enable drawing of this line.
• Times back: how many times period to go back in time. When period is D, and times value is 2, the line will be of data from 2 days ago.
• Color: color of the line when not inverted.
• Style: style of the line. Possible values: sol, dsh, dot
• Inversion color: color of the line when the curve inverses between the two maturities at that part of the curve.
• Thickness: thickness of the line in pixels.
• Labels: whether to draw value labels above the line. By default, this is only enabled for the first line.
• Label text color: text color of value label.
• Label background color: background color of value label.
To configure the durations axis at the bottom of the chart, go to the "DURATIONS" section.
• Durations: whether to show maturity term duration labels below the chart.
• Offset: amount to offset durations label to be below chart.
█ MISC
Script originally inspired by the US Treasury Yield Curve script by @longfiat but has been completely rewritten and changed.

US/CA Bond Yield CurveEasy Viewing of 4 different duration bond yields for US and Canada. Bond prices and bond yields are excellent indicators of the economy as a whole, and of inflation in particular. A bond's yield is the discount rate that can be used to make the present value of all of the bond's cash flows equal to its price. Good as part of a macro set.
