MAJOR PA Zones + Structure + Targets (Gray/Purple)This script highlights major price-action structure (HH/HL/LH/LL), marks BOS/CHOCH events, and draws key supply/demand zones to help visualize trend shifts and potential targets.Pine Script® インジケーターGoldminer10の投稿65
BALANCED Strategy: Intraday Pro + Smart DashboardWelcome to the BALANCED Strategy: Intraday Pro. This all-in-one indicator is designed for Intraday traders looking to capture trend movements while effectively filtering out sideways market noise. It combines the power of Supertrend for direction, EMA 100 for the baseline trend, and rigorous validation via RSI and ADX. The script also integrates a complete Risk Management system with targets based on the Golden Ratio (Fibonacci) and a real-time Dashboard. ⏳ Recommended Timeframes This algorithm is optimized for Intraday volatility: M5 (5 Minutes) ⭐️: Ideal for quick Scalping. The ADX filter is crucial here to avoid false signals. M15 (15 Minutes) 🏆: The "Sweet Spot." It offers the best balance between signal frequency and trend reliability. M30 / H1: For a "Swing Intraday" approach—calmer, fewer signals, but higher precision. Not recommended for M1 (1 Minute) with default settings (too much noise). 🚀 How It Works The algorithm follows a strict 3-step logic to generate high-quality signals: 1. Trend Identification (The Engine) Supertrend: Determines the immediate direction. EMA 100: Acts as a background trend filter. We only buy above and sell below the EMA. 2. Noise Filtering (Safety) ADX (Average Directional Index): The signal is only validated if there is sufficient volatility (Configurable threshold, default 12) to avoid "chop markets" (flat markets). RSI (Relative Strength Index): Strict momentum filter. Buy only if RSI > 50, Sell if RSI < 50. 3. Entry Confirmation (The Trigger) The script doesn't just rely on a crossover. It waits for "Price Action" confirmation: the candle must close higher than the previous one (for Long) or lower (for Short) to validate the entry. 🛡️ Risk Management (Money Management) This is the core strength of this tool. Upon signal validation, the script automatically calculates and plots: Stop Loss (SL): Based on volatility (ATR). It places the stop at the recent Low/High with a safety padding. Take Profit (TP): Two modes available: Fibonacci Mode (Default): Targets the 1.618 extension (Golden Ratio) of the risk taken. Fixed Ratio Mode: Targets a manual Risk/Reward ratio (e.g., 2.0). 📊 The Dashboard Located at the bottom right, the smart dashboard provides vital info at a glance: Signal Time: To check if the alert is fresh. Type (LONG/SHORT): Color-coded (Green/Pink). Tech Data: RSI and ADX values at the moment of the signal. Exact Prices: Entry Level, Target (TP), and Stop Loss (SL). ⚙️ Configurable Settings Sensitivity: Adjust the Supertrend factor (Default 2.0). Filters: Toggle the RSI filter ON/OFF or adjust the ADX threshold. Execution: Choose between Fibonacci Target (1.618) or a Manual Ratio. ⚠️ Disclaimer: This tool is a technical decision aid and does not constitute financial investment advice. Always use prudent risk management and backtest the indicator on your preferred assets before live use.Pine Script® インジケーターmanolodesの投稿121
MACD ultimate with EMA overrideOverview This Pine Script v5 indicator combines MACD zero-cross signals, SuperTrend trend validation, an EMA(50/200) trend filter and an EMA-crossover override to produce clean, session-constrained entry signals and robust exit logic. It draws labels and lines on the chart (entries, exits, SL lines) and supports alerts. Stop-losses use percentage-based sizing and are evaluated on bar close only to avoid intrabar noise. Key features Primary entry rule (MACD zero-cross): Buy when MACD line crosses above zero (current bar MACD > 0 and previous bar MACD < 0). Sell when MACD line crosses below zero (current bar MACD < 0 and previous bar MACD > 0). Session-only entries: Entries are generated only inside a user-defined session (e.g., 09:30-11:30). Exits are evaluated at all times. SuperTrend validation: Optional SuperTrend filter for entries and exits. Can be configured so exits require both MACD exit and SuperTrend flip (AND mode) or use OR mode. EMA trend filter for entries: Optional EMA(50) vs EMA(200) filter — when enabled the indicator will only open buys in EMA-up trend and sells in EMA-down trend. EMA crossover override (priority rule): If EMA fast crosses the slow: EMA50 crosses above EMA200 → forced BUY override (bypasses session, SuperTrend, MACD). Exits any active short and opens long. EMA50 crosses below EMA200 → forced SELL override (bypasses other validations). Exits any active long and opens short. Overrides respect same-direction protection (won’t reopen an existing same-side position). Opposite-entry immediate exit: When an opposite-direction raw entry (MACD zero-cross) occurs, any active opposite trade is exited immediately (then the script may open the opposite entry subject to entry validation). Same-direction repeated signals do not force an exit. Stop-Loss (percentage): Parameterized SL (%) applied at entry; SL is checked and triggered only on bar close (e.g., long SL triggers if barstate.isconfirmed and close <= SL). Labels & SL lines: Single-line, non-repainting labels for entries/exits; SL horizontal line drawn on open positions and greys out after closing. Plots & visuals: MACD panel (histogram, MACD, signal) optional. SuperTrend plotted as a single color-coded line: green for bullish, red for bearish (no dots). Optional EMA( fast / slow ) plots. Entry markers (triangles) shown only for session-filtered entries. Alerts: Entry and exit alerts are included and can be toggled on/off. Inputs (high level) MACD: fast, slow, signal lengths. SL (%) and toggle to enable/disable SL. SuperTrend: ATR length, multiplier; toggles: require for entry, allow/require for exit, show/hide. EMA trend: enable/disable filter; fast/slow lengths; show/hide EMAs. EMA override (built-in) — crossover detection triggers forced entry/exit. Session: time range (HHMM-HHMM) — applies to entry generation only. Misc: allow multiple entries flag, enable alerts, show/hide MACD panel. Behavioral notes & caveats The indicator is an overlay indicator (not a strategy()), so it draws visual signals and alerts but does not place real trades — use strategy() conversion to backtest trade P&L. EMA override bypasses all validations by design — it forcibly exits the opposite side and opens the override side immediately (on the same bar). This is intentional to capture major trend flips. SL is checked on bar close only. That reduces false SL triggers from intrabar spikes but means realized fills can differ in live trading depending on execution and slippage. Opposite-entry exits are immediate (no SuperTrend/MACD requirement) except when a crossover override is the cause — the script guards so EMA overrides take precedence. Pine Script runs on bar close for most accurate signals; intrabar behavior depends on your chart settings (realtime vs historical) — expect small differences between indicator labels and broker fills. Plot/label density: many labels and SL lines can clutter the chart on lower timeframes. Consider hiding SL lines after N bars (optional enhancement) or use higher timeframe charts for less clutter. Suggested default settings MACD: 12, 26, 9 SL: 1.0 (%) with Use SL = on SuperTrend: ATR 10, Multiplier 3.0, require for entry = true, require for exit = true (AND mode) EMA trend filter: enabled (50/200) Session: 0930-1130 (adjust to your exchange/timezone) Alerts: on How to use Paste the full Pine v5 script into TradingView’s Pine Editor and add to chart. Set the trade_session to the market hours you want entries in (chart timezone should match your intended exchange). Toggle Use EMA trend / Require SuperTrend / Require ST for exit depending on how tight you want validation. Use strategy() conversion before backtesting to verify the rules produce acceptable historical returns (indicator-only won’t generate P&L). Recommended next steps Convert to a strategy() script to backtest and measure win rate, drawdown, profit factor, and to validate the SL-on-close logic with realistic fills. Add an input to auto-hide SL lines after N bars or compress labels to a compact trade status box. Consider adding ATR- or volatility-based SL as an alternative to percentage SL.Pine Script® インジケーターebi1405の投稿3
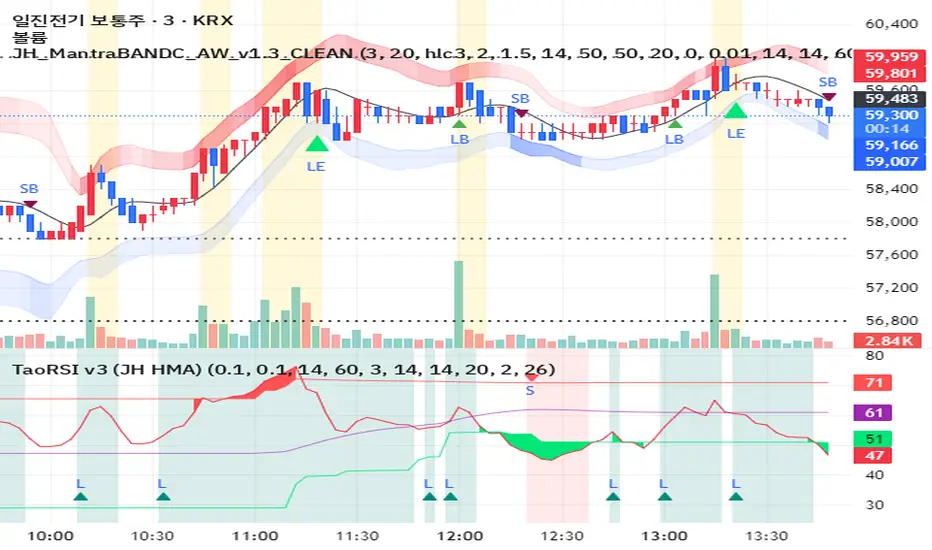
JH MantraBAND-C + AlphaWave Signals v1.3 (Clean)AlphaWave는 추세 + 눌림 + 반전을 하나의 흐름으로 묶은 트레이딩 시그널입니다. • 20 HMA 기반 추세 판단 • 변동성 밴드 구간(상·하단)에서의 눌림/되돌림 포착 • 과도한 신호를 줄이고 확률 높은 구간만 표시 권장 타임프레임: - 3분 / 5분 (단타, 스캘핑) - 일봉 (추세 확인용) ※ 이 지표는 신호 남발을 피하고, ‘기다렸다가 들어가는 매매’를 목표로 설계되었습니다. AlphaWave is a trend-following indicator designed to capture pullbacks and reversals within volatility zones. • 20 HMA based trend structure • Upper / lower volatility bands for context • Filtered signals to reduce noise Best used on: - 3m / 5m intraday charts - Daily charts for trend confirmation This indicator focuses on patience and high-probability setups.Pine Script® インジケーターhyun6606の投稿6
CM Indicator매매에 중요한 여러 지표를 묶어 7개로 만들었습니다. 단기 매매라면 7번째 거래량 지표가 중요하며 손절가 익절가는 모든 지표를 켜셔서 확인하시면 좋습니다 Several important indicators for trading were grouped into seven. If it's a short-term trade, the 7th volume indicator is important, and the sell-off price is You can check all the indicators by turning them onPine Script® インジケーターCMholdingsの投稿3
CODEX OB V1CODEX OB V1 is a multi-purpose Smart Money Concepts (SMC) indicator that automatically detects and visualizes key institutional trading elements such as Order Blocks, Fair Value Gaps, Rejection Blocks, Break of Structure, Pivots, High Volume Bars, and several qualitative SMC signals. This tool helps traders identify institutional footprints and displacement-based setups with high clarity.Pine Script® インジケーターpadencodexの投稿19
LL-HL PivotThis indicator scans for the bullish structure known as a Higher Low (HL) across multiple lengths simultaneously, automatically selects the most suitable pattern, and plots it on the chart. Below is a detailed explanation of how it works. 1. Basic Calculation Method (Definition of LL and HL) This indicator is built on TradingView’s ta.pivotlow function. Detecting Pivot Lows For a given length, a Pivot Low is identified as the lowest point among the candles within the specified range to the left and right. LL and HL Determination LL (Lowest Low): The most recent Pivot Low is treated as the previous low. HL (Higher Low): When a new Pivot Low forms above the previous LL, it is recognized as an HL, and the setup is considered “complete.” Identifying the Pivot Line During the LL–HL structure, the highest high between them is identified and used as the breakout level (Pivot Line / resistance), where a horizontal line is drawn. 2. Multi-Length Scanning Unlike standard indicators that use only one length (e.g., Length = 5), this indicator evaluates a full range of lengths. Min Length to Max Length Example: Min = 2, Max = 10 Internally, it functions as if nine separate indicators (Length 2, 3, 4 … 10) are running simultaneously. This allows the indicator to capture: Small waves (short-term pullbacks) Larger waves (broader structural moves) 3. Priority Mode System Because multiple lengths are calculated at the same time, different LL–HL patterns may appear simultaneously.Priority Mode determines which setup is selected and displayed. A. Lowest LH Selects the pattern with the lowest pivot line (intermediate high). Advantages: Produces the lowest possible entry price B. Longest Length Selects the pattern with the longest length. Advantages: Focuses on larger structures and broader waves Filters out noise C. Shortest Length Selects the pattern with the shortest length. Advantages: Reacts quickly to small moves Useful for scalping or fast trend-following Captures very short-term pullbacks 4. Additional Behavior and Features Real-Time Invalidation If price breaks below the confirmed HL, the structure is immediately considered invalid. All previously drawn lines and labels are removed instantly, preventing outdated structures from remaining on the chart. Pivot Line Extension As long as the HL remains intact, the Pivot Line (breakout level) continues extending to the right. Alerts An alert can be triggered the moment price breaks above the Pivot Line on a closing basis.Pine Script® インジケーターoratnekの投稿22670
FVG vertical Created by Alphaomega18 🎯 What is an FVG (Fair Value Gap)? A Fair Value Gap is a price imbalance created by a mismatch between buyers and sellers, formed by 3 consecutive candles where: Bullish FVG: The low of the current candle is above the high of the candle 2 periods ago Bearish FVG: The high of the current candle is below the low of the candle 2 periods ago ⚙️ Indicator Settings Display Group: Show Bullish vertical FVG: Display bullish vertical FVGs (green) ✅ Show Bearish vertical FVG: Display bearish vertical FVGs (red) ✅ Box Extension (bars): Zone extension duration (1-50 bars, default: 10) Show Labels: Display labels with gap size 🏷️ Remove When Filled: Automatically remove filled zones ✅ 📊 Visual Elements FVG Zones: 🟢 Green = Bullish vertical FVG (potential support zone) 🔴 Red = Bearish vertical FVG (potential resistance zone) Labels: Show gap size in points Positioned at the beginning of each zone Dashboard (top right corner): Real-time count of active FVGs 🟢 = Number of bullish vertical FVGs 🔴 = Number of bearish vertical FVGs Candle Coloring: Light green background = Candle forming a bullish vertical FVG Light red background = Candle forming a bearish vertical FVG 🎯 How to Use the Indicator 1. Installation: Open TradingView Click "Indicators" at the top of the chart Search for "FVG Clean" or paste the code in the Pine Editor 2. Trading Strategies: Support/Resistance: Bullish vertical FVGs act as support zones Bearish vertical FVGs act as resistance zones Price tends to return to "fill" these gaps Position Entries: Long: Wait for a return to a bullish vertical FVG + confirmation Short: Wait for a return to a bearish vertical FVG + confirmation Position Management: Place stops below/above FVGs Use FVGs as price targets A filled FVG loses its validity 🔔 Alerts The indicator includes 2 configurable alert types: Bullish vertical FVG: Triggers when a new bullish vertical FVG forms Bearish vertical FVG: Triggers when a new bearish vertical FVG forms To configure: Right-click on chart → "Add Alert" → Select desired alert 💡 Usage Tips ✅ Do: Combine with other indicators (volume, momentum) Wait for confirmation before entering Use across multiple timeframes Respect your risk management ❌ Don't: Trade solely on FVGs without confirmation Ignore the overall market trend Overload your chart with too many zones 🔧 Parameter Optimization Scalping (1-5min): Box Extension: 5-10 bars Remove When Filled: Enabled Day Trading (15min-1H): Box Extension: 10-20 bars Remove When Filled: Enabled Swing Trading (4H-Daily): Box Extension: 20-50 bars Remove When Filled: As preferred 📈 Performance Maximum 100 FVGs of each type in memory Automatic removal of oldest ones Optimized to not slow down your chart Compatible with all markets and timeframesPine Script® インジケーターAlphaomega18の投稿2
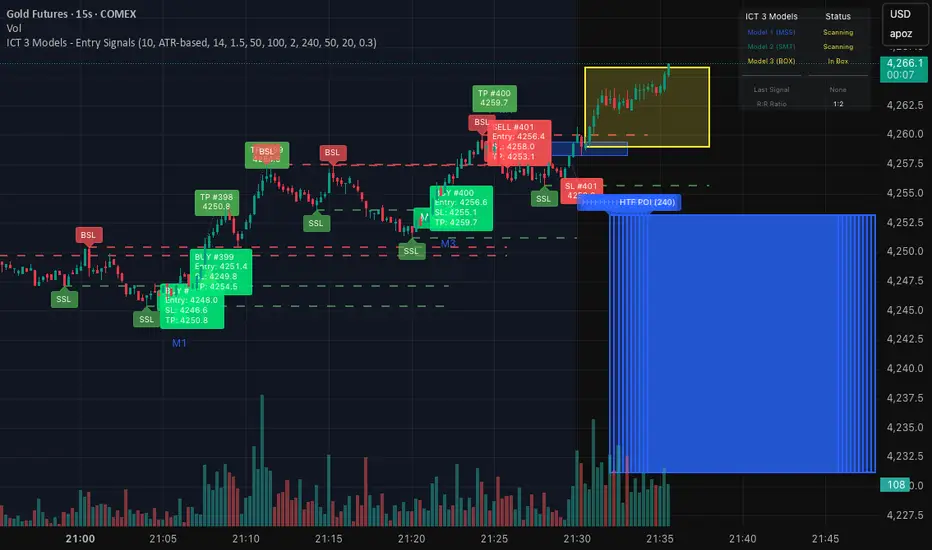
ICT 3 Models - Entry Signals 1.2This script combines 3 powerful ICT (Smart Money Concepts) Entry Models into one comprehensive strategy setup. It is designed to identify high-probability setups based on Higher Timeframe POIs and includes a fully functional Strategy Tester engine. 🔥 The 3 Entry Models: Model 1 (MSS + FVG): Classic reversal setup using HTF Order Blocks, Liquidity Sweep, Market Structure Shift (MSS), and entry at FVG. Model 2 (SMT / Sweep): Catches "Turtle Soup" or Failure Swing setups where price grabs liquidity and quickly reverses using FVG confirmation. Model 3 (AMD / Box): Accumulation, Manipulation, Distribution setup. Identifies consolidation boxes and trades the manipulation leg. ✨ Highlights: Full Backtesting Engine: Test the strategy with customizable Initial Capital and Order Sizing. Auto HTF POI: Automatically plots Higher Timeframe Order Blocks on your chart. Flexible Risk Management: Set SL/TP via Fixed Points or ATR Multiplier. Alerts Included: Ready for automation. Disclaimer: This tool is for educational purposes only. Trading involves risk.Pine Script® インジケーターthaungkmitlの投稿62
Volume Surge - First Candle Break (v6)thisisavolumesurgeindicator will help with trading. use it to identify on 5 minutes thisisavolumesurgeindicator will help with trading. use it to identify on 5 minutes thisisavolumesurgeindicator will help with trading. use it to identify on 5 minutesPine Script® インジケーターromaninetの投稿更新済 3
Pepite alerte Emilien & AxelCet indicateur a pour but de valoriser le Hammer sous toute time frame Pine Script® インジケーターAxelimitlessの投稿6
teril 1H EMA50 Harami Reversal Alerts BB Touch teril Harami Reversal Alerts BB Touch (Wick Filter Added + 1H EMA50) teril Harami Reversal Alerts BB Touch (Wick Filter Added + 1H EMA50) teril Harami Reversal Alerts BB Touch (Wick Filter Added + 1H EMA50) teril Harami Reversal Alerts BB Touch (Wick Filter Added + 1H EMA50)Pine Script® インジケーターaxiomAviators3の投稿9
Momentum & Flow PanelA lower-panel indicator for institutional flow analysis: RSI with automatic divergence detection Money Flow Index (MFI) - volume-weighted momentum Chaikin Money Flow (CMF) - accumulation/distribution OBV trend analysis Stochastic RSI Force Index Composite Scores: Momentum (0-100) + Flow (0-100) → Combined AssessmentPine Script® インジケーターbitzuistの投稿115
LETHINH Pinbar📌 PinBar Minimal Detector — Description (English) PinBar Minimal Detector is a clean and efficient tool designed to detect high-quality pin bars based purely on candle geometry. This script focuses on the core characteristics of a true pin bar: a long rejection wick and a small candle body, without adding unnecessary complexity. It is ideal for traders who want fast, reliable signal detection without noise. ⸻ ✨ Key Features • Detects both bullish and bearish pin bars. • Fully configurable wick/body ratio. • Optional filter for maximum opposite wick size. • Option to ignore candles with extremely small bodies. • Clean chart display with simple labels (“PIN”). • Includes alert conditions for automated notifications (webhook, popup, email, etc.). • Lightweight and optimized for fast execution on any timeframe. ⸻ 🔍 Detection Logic A candle qualifies as a bullish pin bar when: • The lower wick is at least X times larger than the body. • The upper wick is relatively small (optional filter). • The body is above the minimum body threshold. A candle qualifies as a bearish pin bar when: • The upper wick is at least X times larger than the body. • The lower wick is relatively small. • The body meets the minimum size requirement. This ensures that only candles showing strong rejection are highlighted. ⸻ ⚙️ Input Parameters 1. wick/body ratio Defines how many times longer the main wick must be compared to the candle body. For example: • 3.0 → wick must be at least 3× the body • 4.0–5.0 → only very strong pin bars 2. opposite wick max (factor) The maximum allowed size of the wick on the opposite side, relative to the body. Example: • 0.5 → opposite wick ≤ 50% of body • Lower values = stricter filtering 3. min body px Filters out candles with bodies that are too small (low volatility candles). 4. show labels Enable or disable the “PIN” labels on the chart. ⸻ 🚨 Alerts The script includes two built-in alert conditions: • Bullish PinBar Detected • Bearish PinBar Detected These alerts can be paired with: • TradingView notifications • Webhooks (for bots / automation) • Email or SMS alerts ⸻ 🎯 Use Cases • Identify high-probability reversal points • Enhance price action strategies • Combine with S/R zones, supply & demand, trendlines, or order blocks • Filter entries on lower timeframes while following higher-timeframe trend bias ⸻ 📘 Notes This is a minimalistic version by design. If you want a more advanced version (confirmation candle, volume filter, multi-timeframe filtering, trend direction filtering, etc.), this script can be expanded easilyPine Script® インジケーターLEDUCTHINH98の投稿16
Nasdaq Pressure IndexNasdaq Pressure Index Indicator The Nasdaq Pressure Index is a customizable technical indicator designed to measure market sentiment across multiple symbols by calculating a weighted average of their technical strength. The indicator outputs a normalized value between -100 and +100, making it easy to identify bullish or bearish pressure in your selected basket of stocks. Description This indicator calculates the relative strength of up to 10 user-defined symbols, typically tech stocks or other related instruments, and combines them into a single pressure index. The result provides insight into the overall market direction and strength. Key Features Multi-Symbol Analysis: Track up to 10 different symbols simultaneously Flexible Weighting Methods: Manual Market Caps: Define your own market cap weights 30-Day Volume: Weight by recent trading volume Equal Weight: All symbols contribute equally Customizable Parameters: Adjust EMA lengths and smoothing to suit your trading style Visual Cues: Color-coded output and background highlighting for extreme values Debug Information: Option to display detailed calculations How It Works The indicator: Calculates the strength of each symbol based on: Price relative to VWAP (50% weight) Price relative to Fast EMA (30% weight) Price relative to Slow EMA (20% weight) Normalizes these values using ATR to account for volatility Applies your chosen weighting method Combines the weighted values into a single index Normalizes the result to a -100 to +100 scale using a hyperbolic tangent function Applies final smoothing How To Use It Setup: Enter your symbols as a comma-separated list (default includes major tech stocks) Choose your preferred weighting method If using manual weights, enter market caps in billions (comma-separated) Adjust EMA lengths if needed (defaults: Fast EMA = 9, Slow EMA = 21) Interpretation: Positive Values (0 to +100): Bullish pressure - the higher the number, the stronger the bullish sentiment Negative Values (0 to -100): Bearish pressure - the lower the number, the stronger the bearish sentiment Extreme Zones: Values above +50 or below -50 indicate potentially overbought or oversold conditions Color Changes: Green for positive (darker when increasing), Red for negative (darker when decreasing) This is primarily a confluence indicator: Consider taking long positions only on positive values of the indicator Consider taking short positions only on negative values of the indicator Look for divergence between the index and price for potential reversals Extreme readings (+/-50) can signal potential market exhaustion Optimization: Try different symbol combinations to create sector-specific indicators Experiment with different weighting methods to find what works best for your trading style Adjust the EMA lengths to make the indicator more or less sensitive to price changes The indicator works on any timeframe but is particularly useful on daily and weekly charts for capturing broader market movements.Pine Script® インジケーターDrodzCipの投稿23
BitFinex Premium (Clean)Measure of BTC spot premium on Bitfinex vs. CoinbasePine Script® インジケーターmitchstuckeyの投稿12
HTF LiquidityThe ICT Liquidity Sweeps Indicator is designed to track liquidity zones in the market areas where stop-losses and pending orders are typically clustered. This indicator marks buyside liquidity (resistance) and sellside liquidity (support) from HTF (H4, H1 and M15), helping traders identify areas where price is likely to manipulate liquidity before making a significant move. This tool is based on Inner Circle Trader (ICT) Smart Money Concepts, which emphasize how institutional traders, or “Smart Money,” manipulate liquidity to fuel price movements. By identifying these zones, traders can anticipate liquidity sweeps and position themselves accordingly. ⚙️ How It Works 1️⃣ Detects Key Liquidity Zones The script automatically identifies significant swing highs and swing lows in price action using a pivot-based method. A swing high (buyside liquidity) is a peak where price struggles to break higher, forming a resistance level. A swing low (sellside liquidity) is a valley where price struggles to go lower, creating a support level. These liquidity points are prime targets for liquidity sweeps before a true trend direction is confirmed. 2️⃣ Draws Liquidity Lines Once a swing high or low is identified, a horizontal line is drawn at that level. The lines extend to the right, serving as future liquidity targets until they are broken. The indicator allows customization in terms of color, line width, and maximum number of liquidity lines displayed at once. 3️⃣ Handles Liquidity Sweeps When price breaks a liquidity level, the indicator reacts based on the chosen action setting: Dotted/Dashed: The line remains visible but changes style to indicate a sweep. Delete: The line is completely removed once price has interacted with it. This feature ensures that traders can easily spot where liquidity has been taken and determine whether a reversal or continuation is likely. 4️⃣ Prevents Chart Clutter To maintain a clean chart, the script limits the number of liquidity lines displayed at any given time. When new liquidity zones are formed, the oldest lines are automatically removed, keeping the focus on the most relevant liquidity zones.Pine Script® インジケーターcattientkの投稿30
Adaptive Volatility Stop by Pedro Paulo de MeloStop ATR is a clean and reliable volatility-based trailing stop system, built to adapt dynamically to market conditions using the Average True Range (ATR). It identifies trend direction, adjusts the stop level using stair-step logic, and automatically flips the stop when price reversals occur. How it works Uses ATR × Multiplier to calculate an adaptive volatility buffer Tracks trend direction internally Recomputes and repositions the stop when a trend flip is detected Plots separate lines for bullish and bearish stop states Works on any market and timeframe (crypto, forex, commodities, indices, stocks) Why it’s useful This Stop ATR implementation is extremely stable and visually clean. It is particularly effective for: Trend following Position management Swing and position trading Systematic stop placement Unlike many ATR-based stop versions, this script uses a corrected flip-handling method that prevents stop misalignment and ensures consistent trend state tracking. Inputs Period — ATR length Multiplier — ATR factor that defines stop distance Author Developed by Pedro Paulo de Melo, open-source version.Pine Script® インジケーターpedro_demeloの投稿更新済 27
ALT Risk Metric StrategyHere's a professional write-up for your ALT Risk Strategy script: ALT/BTC Risk Strategy - Multi-Crypto DCA with Bitcoin Correlation Analysis Overview This strategy uses Bitcoin correlation as a risk indicator to time entries and exits for altcoins. By analyzing how your chosen altcoin performs relative to Bitcoin, the strategy identifies optimal accumulation periods (when alt/BTC is oversold) and profit-taking opportunities (when alt/BTC is overbought). Perfect for traders who want to outperform Bitcoin by strategically timing altcoin positions. Key Innovation: Why Alt/BTC Matters Most traders focus solely on USD price, but Alt/BTC ratios reveal true altcoin strength: When Alt/BTC is low → Altcoin is undervalued relative to Bitcoin (buy opportunity) When Alt/BTC is high → Altcoin has outperformed Bitcoin (take profits) This approach captures the rotation between BTC and alts that drives crypto cycles Key Features 📊 Advanced Technical Analysis RSI (60% weight): Primary momentum indicator on weekly timeframe Long-term MA Deviation (35% weight): Measures distance from 150-period baseline MACD (5% weight): Minor confirmation signal EMA Smoothing: Filters noise while maintaining responsiveness All calculations performed on Alt/BTC pairs for superior market timing 💰 3-Tier DCA System Level 1 (Risk ≤ 70): Conservative entry, base allocation Level 2 (Risk ≤ 50): Increased allocation, strong opportunity Level 3 (Risk ≤ 30): Maximum allocation, extreme undervaluation Continuous buying: Executes every bar while below threshold for true DCA behavior Cumulative sizing: L3 triggers = L1 + L2 + L3 amounts combined 📈 Smart Profit Management Sequential selling: Must complete L1 before L2, L2 before L3 Percentage-based exits: Sell portions of position, not fixed amounts Auto-reset on re-entry: New buy signals reset sell progression Prevents premature full exits during volatile conditions 🤖 3Commas Automation Pre-configured JSON webhooks for Custom Signal Bots Multi-exchange support: Binance, Coinbase, Kraken, Bitfinex, Bybit Flexible quote currency: USD, USDT, or BUSD Dynamic order sizing: Automatically adjusts to your tier thresholds Full webhook documentation compliance 🎨 Multi-Asset Support Pre-configured for popular altcoins: ETH (Ethereum) SOL (Solana) ADA (Cardano) LINK (Chainlink) UNI (Uniswap) XRP (Ripple) DOGE RENDER Custom option for any other crypto How It Works Risk Metric Calculation (0-100 scale): Fetches weekly Alt/BTC price data for stability Calculates RSI, MACD, and deviation from 150-period MA Normalizes MACD to 0-100 range using 500-bar lookback Combines weighted components: (MACD × 0.05) + (RSI × 0.60) + (Deviation × 0.35) Applies 5-period EMA smoothing for cleaner signals Color-Coded Risk Zones: Green (0-30): Extreme buying opportunity - Alt heavily oversold vs BTC Lime/Yellow (30-70): Accumulation range - favorable risk/reward Orange (70-85): Caution zone - consider taking initial profits Red/Maroon (85-100+): Euphoria zone - aggressive profit-taking Entry Logic: Buys execute every candle when risk is below threshold As risk decreases, position sizing automatically scales up Example: If risk drops from 60→25, you'll be buying at L1 rate until it hits 50, then L2 rate, then L3 rate Exit Logic: Sells only trigger when in profit AND risk exceeds thresholds Sequential execution ensures partial profit-taking If new buy signal occurs before all sells complete, sell levels reset to L1 Configuration Guide Choosing Your Altcoin: Select crypto from dropdown (or use CUSTOM for unlisted coins) Pick your exchange Choose quote currency (USD, USDT, BUSD) Risk Metric Tuning: Long Term MA (default 150): Higher = more extreme signals, Lower = more frequent RSI Length (default 10): Lower = more volatile, Higher = smoother Smoothing (default 5): Increase for less noise, decrease for faster reaction Buy Settings (Aggressive DCA Example): L1 Threshold: 70 | Amount: $5 L2 Threshold: 50 | Amount: $6 L3 Threshold: 30 | Amount: $7 Total L3 buy = $18 per candle when deeply oversold Sell Settings (Balanced Exit Example): L1: 70 threshold, 25% position L2: 85 threshold, 35% position L3: 100 threshold, 40% position (final exit) 3Commas Setup Bot Configuration: Create Custom Signal Bot in 3Commas Set trading pair to your altcoin/USD (e.g., ETH/USD, SOL/USDT) Order size: Select "Send in webhook, quote" to use strategy's dollar amounts Copy Bot UUID and Secret Token Script Configuration: Paste credentials into 3Commas section inputs Check "Enable 3Commas Alerts" Save and apply to chart TradingView Alert: Create Alert → Condition: "alert() function calls only" Webhook URL: api.3commas.io Enable "Webhook URL" checkbox Expiration: Open-ended Strategy Advantages ✅ Outperform Bitcoin: Designed specifically to beat BTC by timing alt rotations ✅ Capture Alt Seasons: Automatically accumulates when alts lag, sells when they pump ✅ Risk-Adjusted Sizing: Buys more when cheaper (better risk/reward) ✅ Emotional Discipline: Systematic approach removes fear and FOMO ✅ Multi-Asset: Run same strategy across multiple altcoins simultaneously ✅ Proven Indicators: Combines RSI, MACD, and MA deviation - battle-tested tools Backtesting Insights Optimal Timeframes: Daily chart: Best for backtesting and signal generation Weekly data is fetched internally regardless of display timeframe Historical Performance Characteristics: Accumulates heavily during bear markets and BTC dominance periods Captures explosive altcoin rallies when BTC stagnates Sequential selling preserves capital during extended downtrends Works best on established altcoins with multi-year history Risk Considerations: Requires capital reserves for extended accumulation periods Some altcoins may never recover if fundamentals deteriorate Past correlation patterns may not predict future performance Always size positions according to personal risk tolerance Visual Interface Indicator Panel Displays: Dynamic color line: Green→Lime→Yellow→Orange→Red as risk increases Horizontal threshold lines: Dashed lines mark your buy/sell levels Entry/Exit labels: Green labels for buys, Orange/Red/Maroon for sells Real-time risk value: Numerical display on price scale Customization: All threshold lines are adjustable via inputs Color scheme clearly differentiates buy zones (green spectrum) from sell zones (red spectrum) Line weights emphasize most extreme thresholds (L3 buy and L3 sell) Strategy Philosophy This strategy is built on the principle that altcoins move in cycles relative to Bitcoin. During Bitcoin rallies, alts often bleed against BTC (high sell, accumulate). When Bitcoin consolidates, alts pump (take profits). By measuring risk on the Alt/BTC chart instead of USD price, we time these rotations with precision. The 3-tier system ensures you're always averaging in at better prices and scaling out at better prices, maximizing your Bitcoin-denominated returns. Advanced Tips Multi-Bot Strategy: Run this on 5-10 different altcoins simultaneously to: Diversify correlation risk Capture whichever alt is pumping Smooth equity curve through rotation Pairing with BTC Strategy: Use alongside the BTC DCA Risk Strategy for complete portfolio coverage: BTC strategy for core holdings ALT strategies for alpha generation Rebalance between them based on BTC dominance Threshold Calibration: Check 2-3 years of historical data for your chosen alt Note where risk metric sat during major bottoms (set buy thresholds) Note where it peaked during euphoria (set sell thresholds) Adjust for your risk tolerance and holding period Credits Strategy Development & 3Commas Integration: Claude AI (Anthropic) Technical Analysis Framework: RSI, MACD, Moving Average theory Implementation: pommesUNDwurst Disclaimer This strategy is for educational purposes only. Cryptocurrency trading involves substantial risk of loss. Altcoins are especially volatile and many fail completely. The strategy assumes liquid markets and reliable Alt/BTC price data. Always do your own research, understand the fundamentals of any asset you trade, and never risk more than you can afford to lose. Past performance does not guarantee future results. The authors are not financial advisors and assume no liability for trading decisions. Additional Warning: Using leverage or trading illiquid altcoins amplifies risk significantly. This strategy is designed for spot trading of established cryptocurrencies with deep liquidity. Tags: Altcoin, Alt/BTC, DCA, Risk Metric, Dollar Cost Averaging, 3Commas, ETH, SOL, Crypto Rotation, Bitcoin Correlation, Automated Trading, Alt Season Feel free to modify any sections to better match your style or add specific backtesting results you've observed! 🚀Claude is AI and can make mistakes. Please double-check responses. Sonnet 4.5Pine Script® ストラテジーnakphananの投稿更新済 30
HSS Price Action v1based on price action and SMC concepts this indicator will give you trade entry and also guide on order blocks and liquidity .. good luckPine Script® インジケーターhanumanshekhawatの投稿2210
美股宽广度指标NH-NLThe NH–NL breadth indicator is used to measure the underlying strength or weakness of the market (Market Breadth). It tracks how many stocks are making 52-week new highs (New Highs) and 52-week new lows (New Lows), and calculates the difference between them. This is one of the most widely followed institutional indicators of market health, helping traders observe: • Whether an uptrend has real breadth support (i.e., whether most stocks are participating in the advance) • Whether weakness is spreading during pullbacks (e.g., new lows expanding rapidly) • Whether the medium-term structure is shifting (NH–NL often reveals trend changes earlier than price) The core purpose of this breadth indicator is to help traders assess whether the market environment is suitable for increasing risk exposure, or whether they should reduce exposure and stay cautious. NH–NL宽广度指标用于衡量市场内部的强弱结构(Market Breadth)。 它统计市场中有多少股票创 52 周新高(New Highs) 与 52 周新低(New Lows),并计算两者的差值 这是机构最常参考的市场健康度指标之一,用于观察: • 上涨行情是否具备广度支持(是否多数股票都参与上涨) • 回调过程中是否有恶化迹象(新低是否快速扩散) • 中期结构是否变化(NH–NL 案例中最常见的是趋势转折提前出现) 这个宽广度指标核心价值是让交易者判断市场是否适合提高风险敞口或是否需要降低风险并观察。Pine Script® インジケーターcm09の投稿更新済 11279
SMC Pro: Real-Time Final**Description:** This comprehensive SMC indicator is designed to automatically visualize major **Trading Sessions** and **Killzones**, alongside Fair Value Gaps (FVG). It helps traders identify high-probability setups by correlating time and price, specifically during key market hours (London, New York, Asia). **Key Features:** 1. **Trading Sessions & Killzones:** The indicator clearly highlights the open and duration of major sessions (Asia, London, New York), allowing traders to spot volatility injections and "Judas Swings." 2. **Automated FVG Detection:** Scans price action to locate valid Fair Value Gaps and Imbalances within these sessions. 3. **Entry Logic:** Marks potential entry zones at the 50% retracement level of the identified FVG. 4. **Risk Management:** Projects a fixed Risk-to-Reward ratio (e.g., 1:3) with automatic Stop Loss and Take Profit levels. 5. **Clean Visualization:** Color-coded boxes for sessions and gaps keep the chart organized. **How to Use:** * **Time Analysis:** Watch for price action as the London or NY session opens (highlighted by the indicator). * **Signal:** Wait for an Imbalance/FVG to form during these high-volume times. * **Entry:** Set a limit order at the 50% mark of the gap. * **Exit:** Use the projected TP levels. **Disclaimer:** This tool is for educational purposes and technical analysis assistance only. Past performance does not guarantee future results.Pine Script® インジケーターtimagold7の投稿65
Manual Zones SafeUse cases: Support and resistance levels Supply and demand zones Price action areas for manual trading strategies Pine Script® インジケーターkhetamhamed19の投稿5