QTi65 FORMULAFind low risk entry points with this momentum Indicator formula. Swing Trading using momentum and breakout idea.Pine Script® インジケーターQLEMACの投稿更新済 17
Scalping Sheriff Strategy TraderReceive alerts for Long and Short Scalp trades. Inspired by the RSI Sheriff Strategy Pine Script® インジケーターwith-careの投稿2227
Hoffman A/D BreakoutStudy based on Rob Hoffman's Accumulation/Distribution Breakout strategy. - Green circle on the top wick indicates a "Distribution" wick - Red circle on the bottom wick indicates an "Accumulation" wick - A distribution wick in an uptrend gets marked as a Key Resistance. This is marked with green crosses - An Accumulation wick in a downtrend gets marked as a Key Support. This is marked with red crosses - Breaking above the Key Resistance indicates a buy entry. This is marked by a green background. - Breaking below the Key Support indicates a sell entry. This is marked by a red backgroundPine Script® インジケーターParCornの投稿更新済 44317
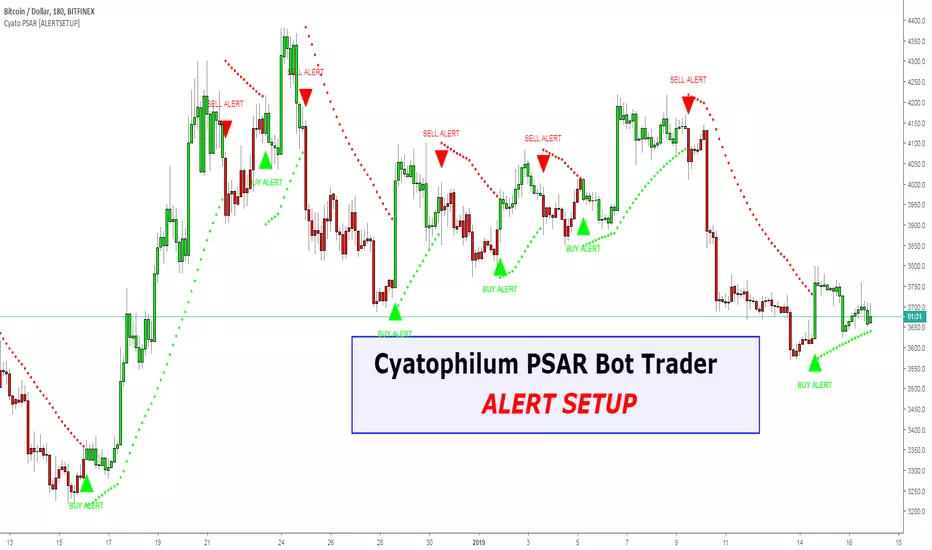
Cyatophilum Trend IndicatorHOW TO USE Step 1 : Adjust the Trend Parameter to the most profitable number. Step 2 : Create Automatic Alerts for Buy (L) and Sell (S) signals. BONUS : Trend horizontal Line: Use this line to avoid risky trades. Get This Indicator Today! Purchase at blockchainfiesta.com SAMPLE USE CASES BTCUSD 1 D BTCUSD 4 h ETHUSD 1 D ETH/BTC 1 D Get This Indicator Today! Purchase at blockchainfiesta.com View a video tutorial on how to use this indicator at the link above. Have Fun ! Pine Script® インジケーターcyatophilumの投稿更新済 141457
Power Trend by Atilla YurtsevenPower Trend is the indicator that i have developed for myself and would like to share with you. Power Trend automatically detects High / Low points and draw trend lines. If you have a look at the graph, you can simply draw a line over last 2 points to combine them and see the trends current state. You can also change High and Low points' sources. I often use Horizontal trend lines by selecting "close" for both High and Low sources. I also love to use Horizontal Trends. They usually shows breakouts. Expect a breakout when lines are close to each other. Remember; this is a lagging indicator. If there is a point in the current bar, indicator will draw it after 2 bars! Disclaimer: All the information in this article, including the algorithm/indicator, was provided and published for informational purposes only and should not be considered legal or financial advice. Happy trading :) Atilla YurtsevenPine Script® インジケーターAtillaYurtsevenの投稿更新済 1616416
Breakout Scalper (Session)This is a twist on my on my Breakout Scalper strategy that limits trading to a user-configurable session Find the original "Continuous" version of the scalper here: The breakout scalper is based on "slow" and "fast" donchian periods. In this version, the "slow" donchian is in fact the Day's high/low. This important difference means that we will always be entering our trades at the day's high or low, so you are exposed to the price making new highs/lows but not to oscillations within the day's range. Furthermore, the scalper is modified to only enter trades after the start of the user-configured session. Any open trades are closed at the end of the user-configured session. The default session is set to 10:00 AM to 3:30 PM because that's when I like to trade.Pine Script® ストラテジーParCornの投稿33393
Breakout Scalperfirst draft of a breakout scalper which uses a fast and slow window sets up some entry stops and then a trailing exit stop. performs a manual close when going sideways. Pine Script® ストラテジーParCornの投稿更新済 33743
Squeeze Breakout by HayemakerCustom squeeze indicator with alerts for breakouts and trailing stop loss.Pine Script® インジケーターHayeTradingの投稿323253
Volume w/ Threshold and Editable MA PeriodJust a simple script that tweaks the original Volume one. The purpose is creating a threshold which we'll use to put an alert on. This way, we can be notified whether Volume pumps. Useful for spotting breakouts, breakdowns and pumps. Threshold is simply a coeff * ma(volume,period). Coeff is editable as well. Hope this helps!Pine Script® インジケーターlukescreamの投稿11350
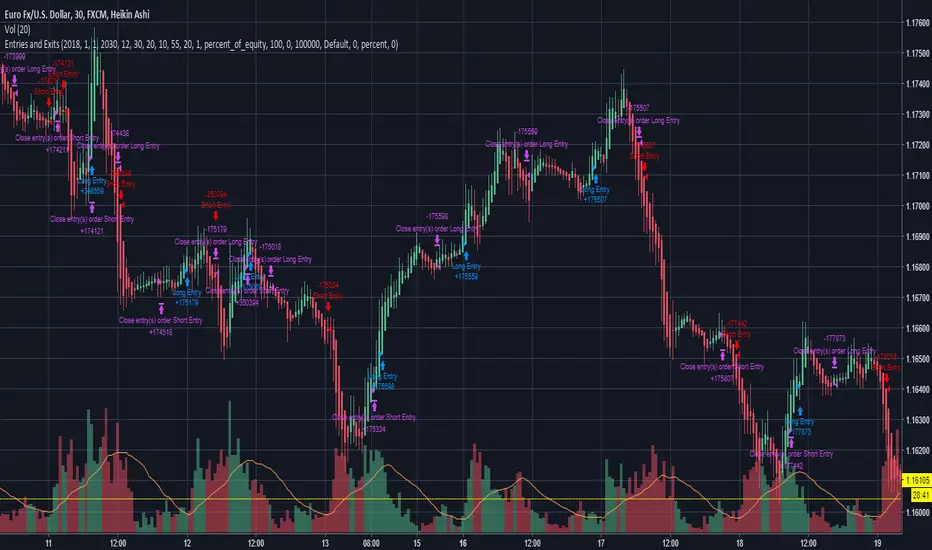
Entries and Exits (plus alerts)Simple breakout strategy that can be used for most equities, FOREX and cryptocurrencies. Inputs can be customized to suit your trading style and can be applied to any time frame chart. Comes with matching alert indicator which is useful for autotrading or just simply never missing a trade for manual trading. Please message me for access. Happy trading!Pine Script® ストラテジーRogue_Profit_Traderの投稿更新済 383871
Toby Crabel's narrow range with historical volatility1. Find bar with the smallest narrow range for a chosen period. Use hvol for filter. 2. Place stop-order for long position at previous high and stop-order for short at previous low to catch breakout in any direction. 3. Take profit on the next bar.Pine Script® ストラテジーTr0sTの投稿33241
QFT Crypto Bottom FeederQFT Crypto Bottom Feeder This indicator is intended to be used with alerts and Autoview for buy signals. I do not have sell signals enabled at the moment. The goal is to catch the bottoms of markets swings. I use this for 1,3 and 5 min charts for small %s. You can adjust the base sensitivity as well as how far down it's looking to buy. Defaults are 3 candles for bases/resistance, .20% below base for buys. The buy plots are absolute locations - so where they lie, is where the buy signal will execute. Pine Script® インジケーターKuklaphの投稿更新済 9942
BoSThis is a customized indicator that helps to confirm and identify breakouts displayed in the form of signals: The tool can be customised for all pivot strengths It can be applied on all timeframes but works best on the daily and weekly A “Buy” signal is displayed when a pivot high is broken A “Sell” signal is displayed when a pivot low is broken This tool also helps to identify fake breakouts Pine Script® インジケーターSublime_Tradingの投稿更新済 2727243
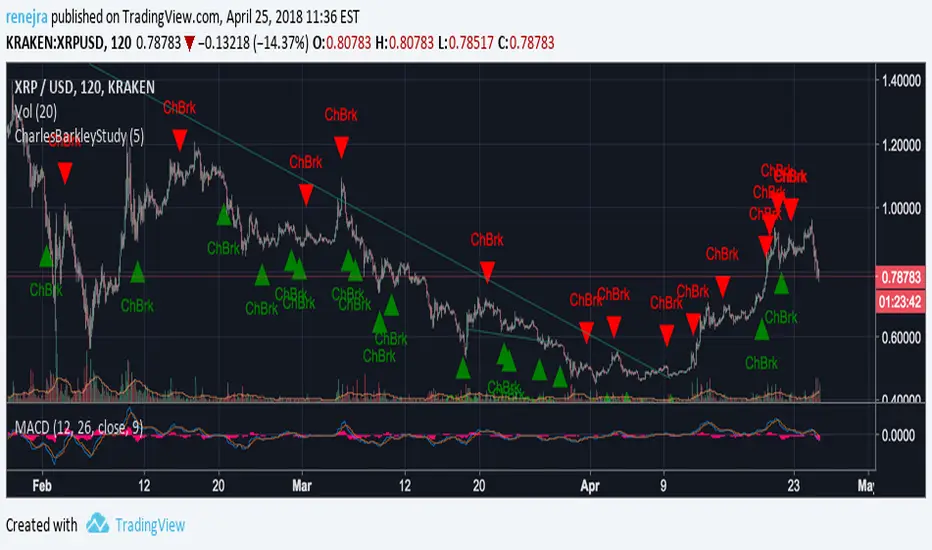
CharlesBarkleyStudyThis is a study to configure alarms based on the Channel Breakout indicator.Pine Script® インジケーターTradeSniperAIの投稿更新済 116
Charles BarkleyDestined for crypto trading, giving alerts on channel breakoutsPine Script® ストラテジーTradeSniperAIの投稿更新済 8
Support & Resistance FilterVisualize support and resistance levels with a high level of user control. Tired of meaningless, tightly clustered, support and resistance lines (shouldn't those just be considered bounces)? Just filter them out with the Bounce Filter. Want to visualize S&R in a crisp, clear new way? Use "Areas of S&R". Want to have a ridiculous amount of control over what counts for support and resistance in the first place? Use the Swing Filter (built-in). Perhaps most interesting... ...want to see support and resistance for (say) Bitfinex-BTC/USD on a Coinbase chart to see how they affect Coinbase candles? Then check out the advanced settings and have fun ;) Support & Resistance levels are determined by historic pivots (swings). If a price breaks through the first resistance level, it may really take off. If it breaks through the second level, or through all five resistance levels, you might be on your way to the moon (Lambos not included). The inverse is true when the price breaks-down, through support levels. 5 Levels of Support and 5 levels of Resistance are available. In a very bullish or bearish situation, searching back in time for the next highest Support or Resistance level can become quite demanding on TradingView's server. I've pushed it to the limit: R2 & S2 look back 1,000 candles R3 & S3 look back 2,250 candles R4 & S4 look back 3,500 candles R5 & S5 look back 4,999 candles When TradingView's servers are getting a little bogged down, you may get an error about "a loop being longer than 100ms". That just comes with the territory of searching so many candles back. To resolve it, just click "Force Reload" in the settings. I'd love to post the manual, the instructions for the settings, here in the description, but the publishing policy sets a limit as to how long these descriptions can be. So check the comments for a manual on how to use this indicator. And if you'd like to plug this kind of indicator into your scripts, just contact me for custom work. ~jdhadwinPine Script® インジケーターjdhadwinの投稿更新済 66156
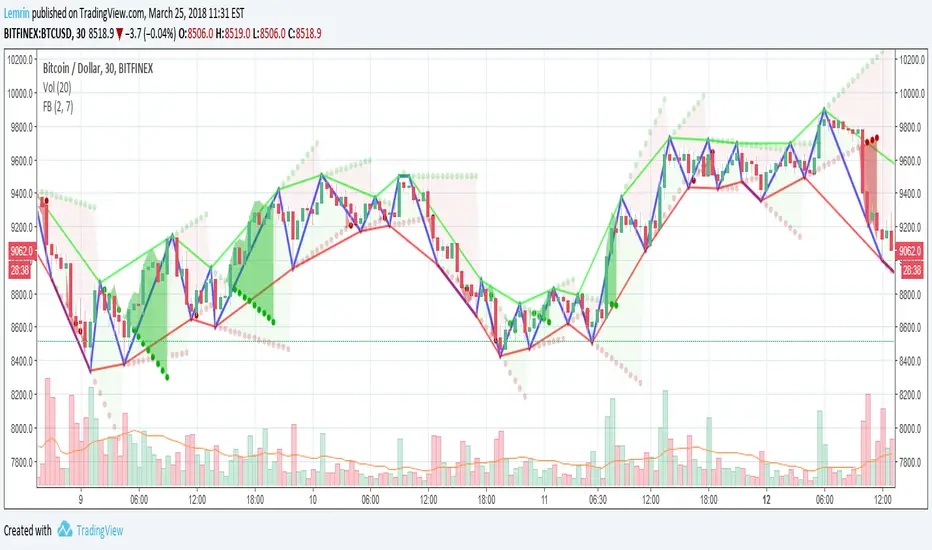
Fractal Breakout V2Version 2 of my fractal pattern aid ( Version 1 ). I added a bouncing line between the high and low trend lines, connecting consecutive extreme points. I also chased down a pesky bug in the slope calculation...and for now I have disabled the ability to change resolution basis for extreme detection (e.g. 30m on a 1hr chart). For fun, I added some shading to make it more apparent at a glance what is happening, but if you find it gimmicky, there's an option to turn that off. I am inexperienced with pattern recognition, so please send feedback if you have any ideas that would make this more useful. Thanks! LemrinPine Script® インジケーターLemrinの投稿更新済 1111 1.3 K
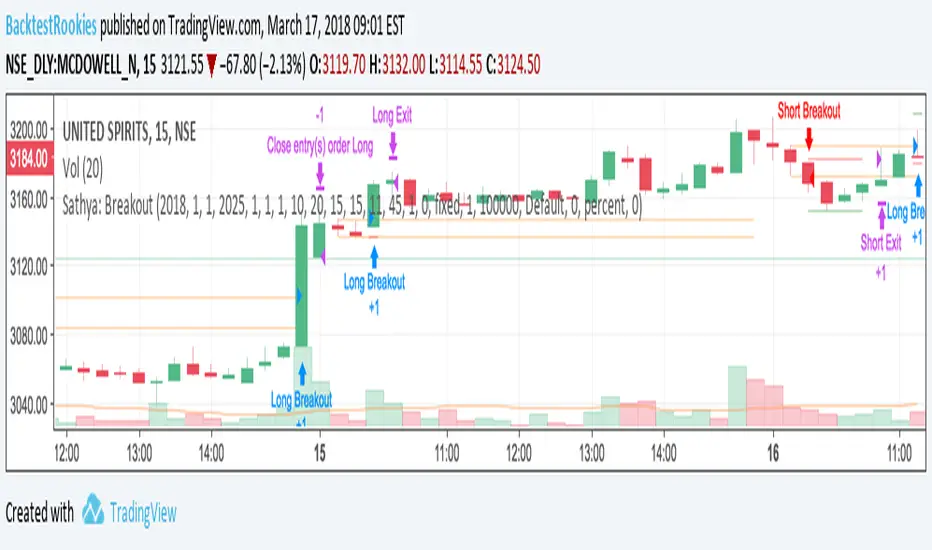
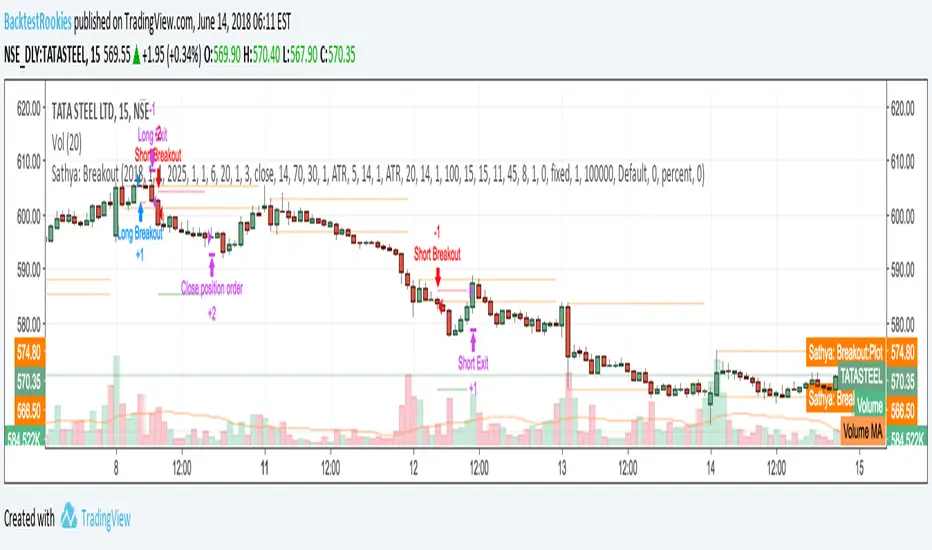
Sathya: Breakout AlternateAn alternate version of an existing strategy. Differences This version stops sending stop entry orders whilst already in a position. Pine Script® ストラテジーBacktestRookiesの投稿更新済 1129
Sathya: BreakoutIntra-day Breakout Strategy: Developed as a professional service and published for customer verification/acceptance. If you are interested in development services, please visit the backtest-rookies website. Features Entry on a breakout from second candle of the session Breakout tolerance zone to prevent false breaks Take profit Stop loss Timed exit (exit at a specific time of day) Pine Script® ストラテジーBacktestRookiesの投稿更新済 3342
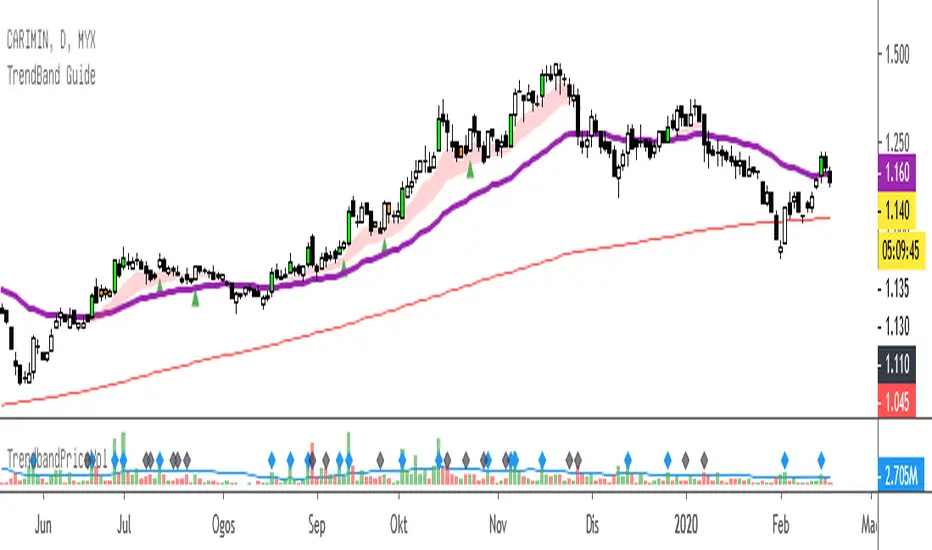
TrendBand GuideTrendBand Guide - simple way to analyse current chart trend. Basic of usage: 1. TrendBand Color Red : Chart in bullish condition Green : Chart in bearish condition Purple Line : Current trend direction Red Line : Long term trend direction 2. Candle Color Green Lime : Breakout 20 days high with more than average volume. Red : Oversold condition base on RSI (14) days - below 35. Note : All color can be change from format menu. When TrendBand in RED, find any breakout or pullback setup. When TrendBand in Green, it show weakness in trend..find any potential rebound setup.Pine Script® インジケーターBURSATRENDBANDCHARTの投稿更新済 1111692
Brandon FractalsCustom Indicator developed for a Backtest-Rookies customer. Published for verification and acceptance Dual Fractal indicator. Display fractals from an upper timeframe and provide alerts when price breaks above/below the upper timeframe fractal. Pine Script® インジケーターBacktestRookiesの投稿更新済 3327
Volume BreakoutsThe aim of this indicator is to indicate effective volume breakouts. Blue = Volume is at least 25% above the 20d moving average Purple = Volume is at least twice as much as the 20d moving average Red = Volume is at least three times the average My recommendation : Always watch for breakouts on large volume. That's a sign that big institutions are buying.Pine Script® インジケーターfyntradeの投稿更新済 1919575
Darvas BoxesExcerpt from TraderHQ: "Darvas Box is a great technical analysis indicator, with an interesting background and creator. Nicholas Darvas, a dancer by trade, made $2,000,000 in an 18-month period trading stocks using the Darvas Box method, while traveling the world on dance tours. The method is designed to capture emerging trends, and ride them for big potential profit, all while keeping risk contained." Excerpt from Investopedia: DEFINITION of 'Darvas Box Theory' Darvas box theory is a trading strategy that was developed in 1956 by former ballroom dancer Nicolas Darvas. Darvas' trading technique involves buying into stocks that are trading at new highs. A Darvas box is created when the price of a stock rises above the previous high but falls back to a price not far from that high. BREAKING DOWN 'Darvas Box Theory' The Darvas box theory is essentially a momentum strategy. It uses market momentum theory and technical analysis to determine when to enter and exit the market, and it uses fundamental analysis to determine what to buy or sell. If the price breaks out of the box, it is a sign of a breakout. In this way, the Darvas box helps traders determine what price to enter and exit the market. In 1956, Darvas turned an investment of $10,000 into $2 million over an 18-month period using this theory. While traveling as a dancer, Darvas obtained copies of The Wall Street Journal and Barron's, but he would only look at the stock prices to make his decisions. It has been said that Darvas was less happy about the profits that he made than he was about the ease and peace of mind that he got from implementing his system. Skeptics of Darvas' technique attribute his success to the fact that he was trading in a very bullish market. They also say that his results can't be attained if this technique is used in a bear market. The Philosophy: What to Buy The main idea behind Darvas' trading philosophy is to focus on growth industries. These are industries that are expected to outperform the market. Darvas selected a few stocks from these industries and monitored their prices every day. He looked for signs that the stock was ready to make a strong move. The main indicator he used to look for these signs was volume. A significant increase in volume increased the likelihood of a big move. Darvas looked for unusual volume on a handful of companies in industries he expected to grow. The Trading Strategy: When to Enter and Exit Once Darvas noticed unusual volume, he created a Darvas box with a narrow price range. The stock's low for the time period presents the floor of the box. The stock's high for the time period represents the ceiling of the box. When the stock breaks through the ceiling of the box, the trader is supposed to buy the stock. Likewise, when the stock goes below the floor of the Darvas box, it is time to sell." Great trading strategy, and an indicator never before seen on TradingView!Pine Script® インジケーターglennmercerの投稿更新済 151151659