Dual Pivot StructureDual Pivot Structure: Speed vs. Stability
Overview
This script is an experimental prototype designed to solve the most common frustration with Market Structure indicators: The Trade-off between Lag and Noise.
In traditional Price Action analysis, verifying a Pivot High or Low requires waiting for X number of candles to close.
High Lookback (e.g., 5 bars): Reliable structure, but the signal appears too late to trade.
Low Lookback (e.g., 1 bar): Fast signals, but prone to "fake-outs" and noise.
This indicator runs both logic systems simultaneously, allowing traders to see the "True" market structure while receiving "Early Warning" signals for potential entries.
How It Works
The script calculates two parallel layers of market data:
1. The "Structure" Layer (Slow & Reliable)
Uses a standard, higher lookback period (Default: 5 Left / 5 Right).
Purpose: Defines the macro trend. It labels confirmed Higher Highs (HH), Lower Lows (LL), etc.
Visual: Solid colored labels. These confirm the trend bias.
2. The "Signal" Layer (Fast & Actionable)
Uses a rapid, minimal lookback period (Default: 1 Left / 1 Right).
Purpose: Hunts for potential reversals within the macro trend.
Logic: If the Macro Trend is bullish, but price pulls back, this layer looks for a "Micro Pivot" that is higher than the previous Macro Low.
Visual: Orange "⚠ HL?" or "⚠ LH?" text.
How to Use This Script
This tool is best used to time entries within an established trend.
Identify the Trend: Look at the Solid Labels (Green/Red). Are we making HHs and HLs? The trend is Up.
Wait for the Pullback: Allow price to retrace.
Watch for the Early Warning: Look for the orange "⚠ HL?" text.
This appears bars before the structural pivot is confirmed.
The Signal: This is your aggressive entry trigger or alert to watch for a lower timeframe change of character.
Confirmation: If price continues in your direction, the script will eventually print a solid HL label, confirming your early entry was correct.
Settings
Structure Settings: Controls the sensitivity of the main trend (Default: 5/5). Increase this for higher timeframes to filter noise.
Signal Settings: Controls the sensitivity of the early warnings (Default: 1/1). Keep this low for maximum speed.
Visuals: Toggle the "Early Warning" labels on/off and customize colors to fit your chart theme.
Disclaimer
This script is a prototype for educational purposes. The "Early Warning" signals are, by definition, unconfirmed and carry higher risk. Always manage risk accordingly.
チャートパターン

ZigZag++ UltraAlgo EditionLagging indicator used to understand trends and entry / exit points. Suggest using at 4h - 1d intervals first, then 1-2h, to identify zones of opportunities and validate your position.

Asian Sweep Strat by MindEdgeThe idea with the indicator is to highlight the asian range, so when price goes below or above it during frankfurt and london open overlap, we can trade price to the opposite direction

Trendlines & SR ZonesIt's a comprehensive indicator (Pine Script v6) that represents two powerful technical analysis tools: automatic trendline detection based on pivot points and volume delta analysis with support/resistance zone identification. This overlay indicator helps traders identify potential trend directions and key price levels where significant buying or selling pressure has occurred.
Features: =
1. Price Trendlines
The indicator automatically identifies and draws trendlines based on pivot points, creating dynamic support and resistance levels.
Key Components:
Pivot Detection: Uses configurable left and right bars to identify significant pivot highs and lows
Trendline Filtering: Only draws downward-sloping resistance trendlines and upward-sloping support trendlines
Zone Creation: Creates filled zones around trendlines based on average price volatility
Automatic Management: Maintains only the 3 most recent significant trendlines to avoid chart clutter
Customization Options:
Left/Right Bars for Pivot: Adjust sensitivity of pivot detection (default: 10 bars each side)
Extension Length: Control how far trendlines extend past the second pivot (default: 50 bars)
Average Body Periods: Set the lookback period for volatility calculation (default: 100)
Tolerance Multiplier: Adjust the width of the trendline zones (default: 1.0)
Color Customization: Separate colors for high (resistance) and low (support) trendlines and their fills
2. Volume Delta % Bars
The indicator analyzes volume distribution across price levels to identify significant supply and demand zones.
Key Components:
Volume Profile Analysis: Divides the price range into rows and calculates volume delta at each level
Delta Visualization: Displays horizontal bars showing the percentage difference between buying and selling volume
Zone Identification: Automatically identifies the most significant supply and demand zones
Visual Integration: Connects volume delta bars with corresponding support/resistance zones on the price chart
Customization Options:
Lookback Period: Set the number of bars to analyze for volume (default: 200)
Price Rows: Control the granularity of the volume analysis (default: 50 rows)
Delta Sections: Adjust the number of horizontal delta bars displayed (default: 20)
Panel Appearance: Customize width, position, and direction of the delta panel
Zone Settings: Control the number of supply/demand zones and their extension (default: 3 zones)
How It Works-
Trendline Logic:
The script continuously scans for pivot highs and lows based on the specified left and right bars
When a pivot is detected, it creates a horizontal line at that price level
The script then looks for the previous pivot of the same type (high or low)
It connects these pivots with a trendline, extending it based on the user-specified setting
A parallel line is created to form a zone, with the distance based on average price volatility
The script filters out invalid trendlines (upward-sloping resistance and downward-sloping support). Only the 3 most recent trendlines are maintained to prevent chart clutter
Volume Delta Logic:
The script divides the price range over the lookback period into the specified number of rows
For each bar in the lookback period, it categorizes volume as bullish (close > open) or bearish (close < open). This volume is assigned to the appropriate price level based on the HLC3 price.
The price levels are grouped into sections, and the net delta (bullish - bearish volume) is calculated for each Horizontal bars are drawn to represent these delta percentages.
The most significant positive and negative deltas are identified and displayed as support and resistance zones. These zones are extended to the left on the price chart and connected to the delta panel with dotted lines.
Ideal Timeframes:
The indicator is versatile and can be used across multiple timeframes, but it performs optimally on specific timeframes depending on your trading style:
For Day Trading:
Optimal Timeframes: 15-minute to 1-hour charts
Why: These timeframes provide a good balance between noise reduction and sufficient volume data. The volume delta analysis is particularly effective on these timeframes as it captures intraday accumulation/distribution patterns while the trendlines remain reliable enough for intraday trading decisions.
For Swing Trading:
Optimal Timeframes: 1-hour to 4-hour charts
Why: These timeframes offer the best combination of reliable trendline formation and meaningful volume analysis. The trendlines on these timeframes are less prone to whipsaws, while the volume delta analysis captures multi-day trading sessions and institutional activity.
For Position Trading:
Optimal Timeframes: Daily and weekly charts
Why: On these higher timeframes, trendlines become extremely reliable as they represent significant market structure points. The volume delta analysis reveals longer-term accumulation and distribution patterns that can define major support and resistance zones for weeks or months.
Timeframe-Specific Adjustments:
Lower Timeframes (1-15 minutes):
Reduce left/right bars for pivots (5-8 bars)
Decrease lookback period for volume delta (50-100 bars)
Increase tolerance multiplier (1.2-1.5) to account for higher volatility
Higher Timeframes (Daily+):
Increase left/right bars for pivots (15-20 bars)
Extend lookback period for volume delta (300-500 bars)
Consider increasing the number of price rows (70-100) for more detailed volume analysis
Usage Guidelines-
For Trendline Analysis:
Use the trendlines as dynamic support and resistance levels
Price reactions at these levels can indicate potential trend continuation or reversal points
The filled zones around trendlines represent areas of price volatility or uncertainty
Consider the slope of the trendline as an indication of trend strength
For Volume Delta Analysis:
The horizontal delta bars show where buying or selling pressure has been concentrated
Green bars indicate areas where buying volume exceeded selling volume (demand)
Red bars indicate areas where selling volume exceeded buying volume (supply)
The highlighted supply and demand zones on the price chart represent significant price levels
These zones can act as future support or resistance areas as price revisits them
Customization Tips:
Trendline Sensitivity: Decrease left/right bars values to detect more pivots (more sensitive) or increase them for fewer, more significant pivots
Zone Width: Adjust the tolerance multiplier to make trendline zones wider or narrower based on your trading style
Volume Analysis: Increase the lookback period for a longer-term volume profile or decrease it for more recent activity
Visual Clarity: Adjust colors and transparency settings to match your chart theme and preferences
Conclusion:
This indicator provides traders with a comprehensive view of both trend dynamics and volume-based support/resistance levels. With these two analytical approaches, the indicator offers valuable insights for identifying potential entry and exit points, trend strength, and key price levels where significant market activity has occurred. The extensive customization options allow traders to adapt the indicator to various trading styles and timeframes, with optimal performance on 15-minute to daily charts depending on their trading horizon.
Chart Attached: NSE HINDZINC, EoD 12/12/25
DISCLAIMER: This information is provided for educational purposes only and should not be considered financial, investment, or trading advice. Please do boost if you like it. Happy Trading.

SMC IndicatorTitle: Smart Money Concepts Market Structure
Description: This is a technical analysis tool designed to map Market Structure using Smart Money Concepts (SMC) logic. Unlike standard ZigZag indicators that often clutter the chart with repainting lines, this script focuses on delivering a clean, objective view of Trend Structure (Highs/Lows) and Structural Breaks.
The Problem It Solves: Traders often struggle to identify the valid "Swing High" or "Swing Low" in real-time. This indicator automates that process using a non-repainting detection engine, helping traders objectively spot Trend Continuations (BoS) and Potential Reversals (CHoCH).
How It Works:
1. Pivot Detection (The ZigZag Engine): The script identifies Swing Points based on a user-defined Depth and Deviation %.
High (H): A peak is confirmed when price retraces by the deviation percentage.
Low (L): A trough is confirmed when price rallies by the deviation percentage.
Ghost Line: A dotted line connects the last confirmed pivot to the current live price, allowing you to visualize the developing structure before it locks in.
2. Structure Mapping: Once pivots are confirmed, the script analyzes price action relative to those points:
BoS (Break of Structure): Trend Continuation. Triggered when price breaks a confirmed pivot in the direction of the trend (e.g., breaking a Higher High in an uptrend).
CHoCH (Change of Character): Trend Reversal. Triggered when price breaks a major pivot in the opposite direction (e.g., breaking a Higher Low in an uptrend).
Visual Features:
Minimalist Design: Uses floating text labels (no background boxes) to keep price action visible.
Color Coded: Blue/Maroon for Continuation (BoS), Aqua/Orange for Reversal (CHoCH).
Settings Guide:
ZigZag Deviation %: Set this to 5.0 for Higher Timeframes (Daily/4H) or lower it to 0.2 - 0.5 for Intraday Scalping (1m/5m).
Ghost Line: Toggle on/off to see the real-time projection.
Alerts: Full alert support included for Bullish/Bearish BoS and CHoCH signals.
Credits: Logic based on standard Price Action and Market Structure theory.

7/19 EMA Crossover Alertsaskl hasodidu fuasdo asdfasdfiu sdfiuyiodafugoasdf fa sgyu dsgasdo asfo o asdf

MenthorQ Levels ConversionLevels Conversion helps traders accurately overlay price levels from spot/index ETFs and indices (like SPX, SPY, QQQ, NDX) onto futures charts (like ES, NQ, etc.).
Because futures and spot/index prices don’t trade at the same price, your levels will be misaligned if you plot them directly. Futures typically trade at a spread or ratio versus their related index/ETF. This indicator solves that by calculating the conversion ratio automatically, so your levels stay aligned on the futures chart.
How it works
This script calculates the ratio between Asset A and Asset B and applies it to convert levels from one instrument to the other (for example, SPX → ES, QQQ → NQ).
Ratio options (3 modes)
You can choose one of three ratio sources:
✅ T1 Ratio (Morning Snapshot)
Select a specific time to “lock” the ratio.
Default: 10:00 AM ET (morning session snapshot)
✅ T2 Ratio (Afternoon Snapshot)
Select a second time to “lock” the ratio.
Default: 3:30 PM ET (afternoon snapshot)
✅ Last Price Ratio (Live)
Uses the last traded price of both assets to compute the ratio.
Note: To refresh the “Last Price” baseline, simply remove and re-add the indicator.
Learn more about Levels Conversions: menthorq.com
Common levels conversions
Some popular use-cases include:
- SPX Gamma Levels → ES
- SPY Gamma Levels → ES
- QQQ Gamma Levels → NQ
- NDX Gamma Levels → NQ
- SPX Intraday Gamma Levels → ES
- QQQ Intraday Gamma Levels → NQ
- SPX Swing Trading Levels → ES
- QQQ Swing Trading Levels → NQ
- GLD Levels → GC
- DIA Levels → YM
- USO Levels → CL
- NVDA / MAG7 Levels → QQQ

POI Zones with Imbalance- Ahmed AwadHighlights Point of Interest (POI) zones on the chart where a significant price imbalance occurs between the candle’s open and close. The indicator draws semi-transparent orange zones to mark potential buy or sell areas, helping traders spot strong price moves and key levels. Adjustable imbalance threshold and transparency for flexibility.

Liquidity Entry Triggers (4-Model System) | WarRoomXYZLiquidity Entry Triggers is an open-source, price-action-based analytical framework designed to highlight recurring institutional liquidity behaviors that appear across all liquid markets.
The script focuses on how and where liquidity is taken, rather than attempting to predict direction using oscillators or lagging indicators.
It is optimized for XAUUSD, FX pairs, indices, and crypto , particularly on 1m–15m timeframes where session behavior and liquidity reactions are most visible.
This tool is not a buy/sell signal generator .
It provides contextual entry zones based on structural liquidity logic, allowing traders to apply their own execution rules.
Core Philosophy
Markets move because of:
•Trapped traders
•Forced liquidations
•Session-based liquidity cycles
•Reactions at prior institutional participation zones
This script visualizes four repeatable entry triggers that emerge from those mechanisms.
🔹 1. Failed Breakout / Trapped Trader Model
When price breaks a clearly defined range high or low, breakout traders often enter expecting continuation.
If price fails to hold outside the range and closes back inside, those traders become trapped.
The script detects:
•Breaks beyond recent highs/lows
•Immediate rejection back into the range
•Structural failure of momentum
These conditions frequently lead to mean reversion or reversal moves as trapped traders exit and fuel movement in the opposite direction.
Markers are plotted at the point of failure to highlight potential trap zones.
🔹 2. Liquidation Flush Detection
Sharp impulsive candles with abnormally large wicks often represent liquidation cascades rather than healthy trend continuation.
The script identifies liquidation behavior by measuring:
•Wick-to-body imbalance
•Sudden expansion followed by rejection
•Temporary price inefficiencies
These flushes commonly occur near:
•Session highs/lows
•Range extremes
•Trend exhaustion points
Such events often lead to rebalance moves , where price partially or fully fills the wick.
🔹 3. Orderblock Reaction Zones
Orderblocks represent areas where heavy participation occurred before a strong displacement move.
The script highlights:
•Clean bullish and bearish orderblock structures
•Zones formed during consolidation prior to expansion
•Areas likely to be defended when revisited
Orderblocks with minimal noise and clean departure are prioritized, as they often reflect institutional positioning rather than retail activity.
These zones are intended as reaction areas , not automatic entry signals.
🔹 4. London Session Liquidity Sweep Model
The London session frequently establishes the initial daily high or low.
Later in the session or during New York, price often:
•Sweeps internal liquidity around that level
•Rejects after the sweep
•Continues with the higher-timeframe bias
The script monitors London session behavior and marks:
•Liquidity runs above/below London highs and lows
•Rejections back inside the prior structure
This model is especially effective when combined with broader daily context.
🔹4. How the Components Work Together
The framework is designed as a context stack , not a checklist of signals:
Liquidity Event → Location → Timing → Trader Execution
Each model reinforces the others:
•Failed breakouts often occur after liquidity sweeps
•Liquidation wicks frequently form near orderblocks
•London sweeps often trigger failed momentum moves
•Confluence increases probability, not certainty
🔹 Practical Usage Guide
✔ Identify context
Determine whether price is approaching a range extreme, session level, or prior participation zone.
✔ Wait for a liquidity event
Look for a sweep, failed breakout, or liquidation wick.
✔ Observe reaction
Rejection, displacement, or reclaim behavior provides confirmation.
✔ Execute manually
Stops are commonly placed beyond the liquidity extreme.
Targets are typically internal liquidity, prior highs/lows, or imbalance zones.
The indicator does not manage trades or enforce rules.
Execution and risk management remain the trader’s responsibility.
🔹 5. Originality & Design Notes
This script does not replicate or bundle existing indicators.
It introduces:
•A multi-model liquidity entry framework
•Structural failed breakout detection
•Wick-based liquidation imbalance logic
•Session-aware liquidity sweep visualization
•A unified, minimal, non-lagging design
All concepts are based on observable market behavior and integrated into a single analytical tool.
🔹 6. Suitable Markets & Timeframes
Works best on:
•XAUUSD
•Major FX pairs
•Indices
•Liquid crypto markets
Recommended timeframes:
•1m
•5m
•15m
•30m
🔹7. Limitations & Notes
•This is an analytical framework , not a trading system
•All markings are confirmed at candle close (non-repainting)
•No open interest or order flow data is used
•Results depend on user interpretation and execution
•Best used alongside session bias and higher-timeframe structure
Disclaimer
This script is provided for educational and informational purposes only.
It does not constitute financial advice, investment advice, or a recommendation to buy or sell any instrument.
Trading involves risk, and losses can exceed initial deposits.
The author assumes no responsibility for trading decisions made using this tool.
Users are strongly encouraged to test this script in demo or simulation environments and to apply proper risk management, position sizing, and personal discretion at all times.
By using this script, you acknowledge and accept all associated risks.


ORB + FVG A+ PRO (All-in-One) [QQQ]Configurable ORB + FVG + filters (VIX, ORB range, relative volume) + A+ PRO (retest at the FVG edge + rejection) + anti-fakeout + orange reminder “CONFIRM POC/HVN (Volume Profile)” right when the A+ signal appears

True vs False Breakout (Vol + Body Shape) **Indicator Description: True vs. False Breakout Detector**
This indicator helps identify the quality of a breakout by analyzing price action and volume.
**★ Green Arrow: "True Breakout (Strong Candle)"**
This represents a high-confidence breakout signal.
* **Criteria:** Price Breakout + Volume Surge + Strong Candle Close (minimal to no upper wick).
* **Significance:** Indicates strong bullish momentum.
**● Grey Dot: "Weak Breakout"**
Appears when price breaks resistance but shows signs of weakness.
* **Criteria:** Breakout with low volume OR a long upper wick (rejection).
* **Meaning:** "Price made a new high, but the move is untrustworthy."
* **Action:** Do not chase the long position. Be cautious and look for potential reversals.
**▼ Red Label: "False Breakout (Reversal)"**
* **Signal:** Appears when a Weak Breakout (Grey Dot) is followed by bearish price action.
* **Action:** This indicates a confirmed False Breakout and presents a prime shorting opportunity.
-------------------------------------------------------------------------------------------
★指标描述:真假突破辨别。
★绿色箭头 "真突破 (强K线)":
这是你要的完美信号。
它意味着:价格破位 + 成交量放大 + K线收盘坚决(几乎没有上影线)。
对应刚才的行情: 刚才那根1H大阳线应该会触发这个信号。
灰色圆点 "弱势突破" (新增):
如果价格突破了阻力,但是没量,或者留了长上影线(像你之前描述的那几根15分钟线),指标会标记灰色圆点。
含义: “虽然价格破了新高,但我不信任它”。这时候千万不要追多,反而要准备做空。
红色标签 "假突破 (反转)":
当灰色圆点(弱势突破)出现后,紧接着出现红色标签,就是绝佳的做空点。

RRE ZonesLine Creation: Each FVG box now has a corresponding dashed line drawn through its center:
Uses a dashed style for clear visibility
Matches the FVG color (with 30% transparency)
Extends to the right like the box
Width of 1 pixel
Synchronized Cleanup: When FVG boxes are removed (either by reaching max count or being filled by price), their corresponding center lines are also deleted automatically.
The center lines help you:
Quickly identify the 50% level of each FVG
Use it as a potential target or entry level
Better visualize the gap's midpoint for trading decisions

3LL+Baby & 3HH+Baby Pattern3LL+Baby & 3HH+Baby Pattern Indicator
Overview
This indicator identifies powerful reversal patterns based on momentum exhaustion and inside bar formations. It detects two specific candlestick patterns that signal potential trend reversals: the bullish 3LL+Baby and the bearish 3HH+Baby.
Pattern Descriptions
📈 3LL+Baby Pattern (Bullish Reversal)
Conditions:
Three consecutive candles form lower lows (each low is lower than the previous)
The fourth candle is bullish/green (closes higher than it opens)
The fourth candle is completely contained within the third candle's range (both high and low)
Interpretation: After a downward momentum with three lower lows, a bullish inside bar (baby candle) suggests sellers are exhausted and buyers may be taking control. This pattern often precedes upward reversals.
📉 3HH+Baby Pattern (Bearish Reversal)
Conditions:
Three consecutive candles form higher highs (each high is higher than the previous)
The fourth candle is bearish/red (closes lower than it opens)
The fourth candle is completely contained within the third candle's range (both high and low)
Interpretation: After upward momentum with three higher highs, a bearish inside bar indicates buyers are losing strength and sellers may be gaining control. This pattern often signals potential downward reversals.
Features
Visual Signals
Green Triangle (↑): Appears below bars when 3LL+Baby pattern is detected
Red Triangle (↓): Appears above bars when 3HH+Baby pattern is detected
Labels: Clear text labels identifying each pattern type
Background Highlighting: Subtle background colors (green for bullish, red for bearish)
Customization Options
Toggle labels on/off
Toggle arrow signals on/off
Enable/disable bullish patterns independently
Enable/disable bearish patterns independently
How to Use
Add to Chart: Apply the indicator to any timeframe and instrument
Configure Settings: Adjust visibility options based on your preference
Set Alerts: Create alerts for immediate pattern notifications
Trading Strategy:
3LL+Baby : Consider long positions or closing shorts
3HH+Baby: Consider short positions or closing longs
Always confirm with additional analysis and risk management
Best Practices
Use in conjunction with support/resistance levels
Combine with volume analysis for confirmation
Works on all timeframes (higher timeframes generally more reliable)
Apply proper risk management and stop-loss orders
Consider the broader market context and trend

Golden hour 1130 1230 Session LinesGolden Hour 11:30–12:30 Session Lines
Overview :
Calculate the session high and low between 11:30 AM and 12:30 PM and mark the lines.
Trading Rule
Once the price breaks either side (high or low), it will continue to move further in that direction.
Session Time : 11:30 AM – 12:30 PM
Key Levels : Session High & Session Low
Strategy : Breakout continuation in the direction of the break

USOIL BOS Retest Overlay (HTF + Blocks + Profit Zone + Lot Size)This is a test overlay that should show entry positions and lot sizes to take based on R20 000 account. This was made purely for USOIL


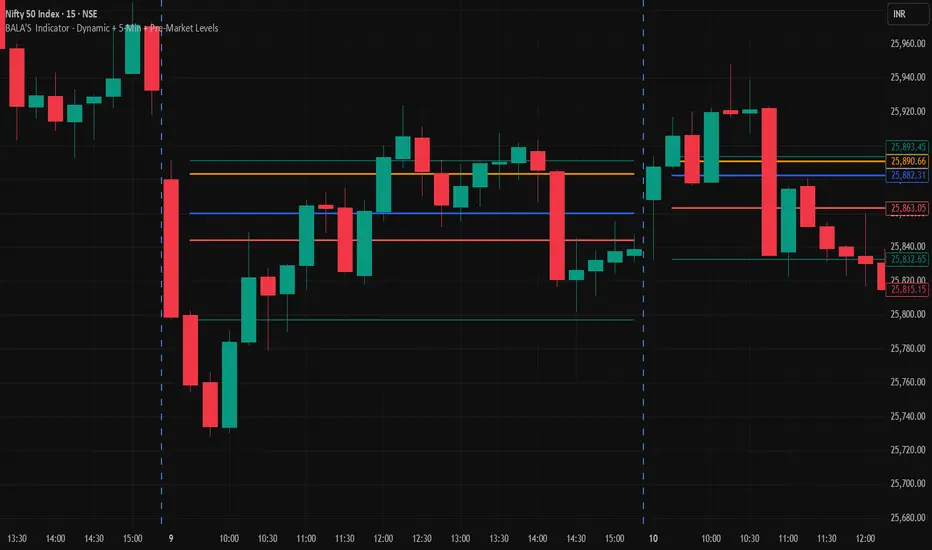
BALA'S Indicator - Dynamic + 5-Min + Pre-Market LevelsINTRADAY Strategy on Nifty with 15min Candle Setup.
ORB + FVG + PDH/PDL ORB + FVG + PDH/PDL is an all-in-one day-trading overlay that plots:
Opening Range (ORB) high/low with optional box and extension
Fair Value Gaps (FVG) with optional “unmitigated” levels + mitigation lines
Previous Day High/Low history (PDH/PDL) drawn as one-day segments (yesterday’s levels plotted across today’s session only)
Includes presets (ORB only / FVG only / Both) and optional alerts for ORB touches, ORB break + retest, FVG entry, and PDH/PDL touches.

Smart Money Alpha Signals (Performance Dashboard) Smart Money Alpha Signals: Identifying Market Leaders & Generating Alpha
GMP Alpha Signals (Global Market Performance Alpha) is a specialized analysis tool designed not merely to find stocks that are rising, but to identify "Alpha" assets—Market Leaders that defend their price or rise even under adverse conditions where the market index falls or consolidates.
This indicator visualizes the concept of Comparative Relative Strength (RS) and Smart Money accumulation patterns, helping traders capture profit opportunities even during bearish market phases.
Key Objectives (Purpose)
Alpha Capture: Identifying assets generating 'excess returns' that outperform the market Beta.
Smart Money Tracking: Detecting traces of 'institutional buying' and 'accumulation' that defend prices during index plunges.
Decoupling Identification: Spotting assets moving on independent catalysts or momentum, regardless of the broader market direction.
Stop Hunt Filtering: Distinguishing 'fake drops' where price dips temporarily, but Relative Strength remains intact.
Dashboard Guide
Interpretation of the information panel (Table) displayed on the chart.
Rel. Performance: Shows the excess return compared to the index over the set period. (Positive/Green = Stronger than the market).
Decoupling Strength: The correlation coefficient with the index. Lower values (0 or negative) indicate movement independent of market risk.
Bullish: The count/rate of rising or limiting losses when the index drops sharply (e.g., < -0.5%). (Gold = Market Crash Leader).
Defended: The count/rate of holding support levels when the index shows mild weakness (e.g., < -0.05%). (Gold = Strong Accumulation).
Bench. Defense: The defense rate of the comparison benchmark (e.g., TSLA, ETH). Your target asset must be higher to be considered the sector leader.
Input Options & Settings Guide
You can optimize settings according to your trading style and asset class (Stocks/Crypto).
(1) Main Settings
Major Index: The baseline market index for comparison.
(US Stocks: NASDAQ:NDX or TVC:SPX / Crypto: BINANCE:BTCUSDT)
Benchmark Symbol: A competitor within the sector.
(e.g., Set NVDA when analyzing Semiconductor stocks).
Correlation Lookback: The lookback period for judging decoupling. (Default: 30)
Performance Lookback: The number of bars to calculate cumulative returns and defense rates. (Default: 60)
(2) Dashboard Thresholds
These settings define the criteria for what qualifies as "Defended" or "Bullish".
Performance (Max %): Used to find assets that haven't pumped yet. Signals trigger only when Alpha is below this value.
Defended Logic:
Index Drop Condition: The index must drop by at least this amount to start checking. (e.g., -0.05%)
Asset Buffer: How much the asset must outperform the index drop.
(Example: If Index drops -1.0% and Buffer is 0.2%, the asset must be at least -0.8% to count as 'Defended').
Bullish Logic: Measures resilience during steeper market dumps (e.g., -0.5% drop) compared to the Defended Logic.
Volume Settings: Decides whether to count Defended/Bullish instances only when accompanied by volume above the SMA.
(3) Signal Logic Settings (Crucial)
Customize conditions to trigger alerts. The choice between AND / OR is crucial.
AND: Condition must be met SIMULTANEOUSLY with other active conditions (Conservative/High Certainty).
OR: Condition triggers the signal INDEPENDENTLY (Aggressive/Opportunity Capture).
Performance: Is the relative performance within the threshold? (Basic Filter).
Decoupling: Has the correlation dropped? (Start of independent move).
Bullish Rate: Is the Bullish rate high during market dumps?
Defended Rate (High): (Recommended) Is there continuous price defense occurring? (Accumulation detection).
Defended Rate (Low): (Warning) Has the defense rate broken down? (For Stop Loss).
Defended > Benchmark: Is it stronger than the Benchmark (2nd tier)?
Volume Spike: Has volume surged compared to the average? (Institutional involvement).
RSI Oversold: Is it in oversold territory? (Counter-trend trading).
Decoupling Move: Does the current bar show the "Index Down / Asset Up" pattern?
Min USD Volume: Transaction value filter (To exclude low liquidity assets).

Trend detection zero lag Trend Detection Zero-Lag (v6)
Trend Detection Zero-Lag is a high-performance trend identification indicator designed for intraday traders, scalpers, and swing traders who require fast trend recognition with minimal lag. It combines a zero-lag Hull Moving Average, slope analysis, swing structure logic, and adaptive volatility sensitivity to deliver early yet stable trend signals.
This indicator is optimized for real-time decision-making, particularly in fast markets where traditional moving averages react too slowly.
Core Features
🔹 Zero-Lag Trend Engine
Uses a Zero-Lag Hull Moving Average (HMA) to reduce lag by approximately 40–60% versus standard moving averages.
Provides earlier trend shifts while maintaining smoothness.
🔹 Multi-Factor Trend Detection
Trend direction is determined using a hybrid engine:
HMA slope (momentum direction)
Rising / falling confirmation
Swing structure detection (HH/HL vs LH/LL)
ATR-adjusted dynamic sensitivity
This approach allows fast flips when conditions change, without excessive noise.
Adaptive Volatility Sensitivity
Sensitivity dynamically adjusts based on ATR relative to price
In high volatility: faster reaction
In low volatility: smoother, more stable trend state
This ensures the indicator adapts across:
Trend days
Range days
Volatility expansion or contraction
Trend Duration Intelligence
The indicator tracks historical trend durations and maintains a rolling memory of recent bullish and bearish phases.
From this, it calculates:
Current trend duration
Average historical duration for the active trend direction
This helps traders gauge:
Whether a trend is early, mature, or extended
Probability of continuation vs exhaustion
Strength Scoring
A normalized Trend Strength Score (0–100) is calculated using:
Zero-lag slope magnitude
ATR normalization
This provides a quick read on:
Weak / choppy trends
Healthy trend continuation
Overextended momentum
Visual Design
Color-coded Zero-Lag HMA
Bullish trend → user-defined bullish color
Bearish trend → user-defined bearish color
Designed for dark mode / neon-style charts
Clean overlay with no clutter
Trend Detection Zero-Lag is built for traders who need:
Faster trend recognition
Adaptive behavior across market regimes
Structural confirmation beyond simple moving averages
Clear, actionable visual signals

Ichimoku + VWAP + OBV + ATR Full System (NQ Daytrade)This script provides optimized scalping signals for BTC, designed mainly for the 15-minute timeframe.
Long/short entries are generated using VWAP band position and trend confirmation logic.
OBV momentum is used as a secondary filter to validate breakout or reversal conditions.
Exit signals are displayed when volatility compression or mean-reversion conditions occur.
Simple visual markers (triangles and circles) are included for easy decision-making.
롱/숏 삼각형 시그널
동그라미 청산 시그널
VWAP 밴드 기반 방향성
OBV 보조지표
이름 (Name)
BTC Scalping Signal – VWAP + OBV
짧은 설명 (Short Description)
VWAP 밴드와 OBV를 기반으로 방향성, 진입·청산 시그널을 제공하는 스캘핑 지표입니다.
긴 설명 (Long Description)
이 지표는 BTC 단기 스캘핑을 위해 설계된 것으로, 특히 15분봉 환경에 최적화되어 있습니다.
VWAP 밴드의 위치와 추세 판별 로직을 기반으로 롱·숏 진입 신호를 제공합니다.
OBV 모멘텀을 보조 필터로 사용하여 돌파 및 되돌림 가능성을 판단합니다.
시장 변동성이 축소되거나 평균회귀 신호가 감지될 때 청산 시그널을 표시합니다.
삼각형(진입), 원형(청산) 등 직관적 시각 요소를 통해 빠른 의사결정을 지원합니다.

RSI Multi-Timeframe TableHow the RSI Multi-Timeframe Table Indicator Works
This indicator displays a table showing the RSI (14) from multiple timeframes at the same time.
It helps you quickly see whether the RSI is in overbought or oversold zones across different periods (1m, 5m, 15m, 30m, 1h, 4h, and 1D).
Below is a clear explanation of how each part works:
1) Timeframes Used
The indicator analyzes the RSI from the following timeframes:
1 minute (1m)
5 minutes (5m)
15 minutes (15m)
30 minutes (30m)
1 hour (1h)
4 hours (4h)
1 day (1D)
Each row of the table represents one of these timeframes.
2) How the RSI Is Retrieved
For each timeframe, the script uses the request.security() function to fetch the RSI(14) value from that specific timeframe, even if your current chart is set to a different one.
Example: On a 1h chart, you can still see the RSI from 1m, 5m, 30m, etc.
3) Table Structure
The table appears in the top-right corner and contains 8 columns:
TF – shows the timeframe name
RSI – shows the RSI value with two decimal places
10 – marks if RSI is ≤ 10
20 – marks if RSI is ≤ 20
30 – marks if RSI is ≤ 30
70 – marks if RSI is ≥ 70
80 – marks if RSI is ≥ 80
90 – marks if RSI is ≥ 90
The extreme levels (10, 20, 80, 90) help identify possible reversal zones.
4) Markings in the Table
When a condition is true, a ● circle appears in the corresponding cell.
Examples:
If the 5m RSI is ≤ 20, a circle appears in the 20 column for the 5m row.
If the 1H RSI is ≥ 80, a circle appears in the 80 column for the 1H row.
Colors also help interpretation:
Red for strong oversold levels (≤10)
Orange and yellow for intermediate levels
Green, teal, and blue for overbought levels
5) Alerts
The indicator includes four built-in alerts:
RSI ≤ 10
RSI ≤ 20
RSI ≥ 80
RSI ≥ 90
These alerts use the RSI from the current chart timeframe.
To enable them:
Open Alerts in TradingView
Click Create Alert
Select the indicator
Choose the alert you want
Confirm
6) Purpose of This Indicator
It is useful for:
Quickly checking market strength across multiple timeframes
Identifying when several periods are overbought or oversold
Avoiding trades against market momentum
Helping confirm potential reversal points
Summary
This indicator creates a table that shows RSI values from multiple timeframes and visually highlights overbought or oversold conditions in each one.
It also includes ready-to-use alerts for the most extreme RSI levels.
