Hersheys CoCo World"CoCo World" helps to answer the following question... Is this stock moving alone or with other markets? No stock is an island, so it's important to see what everyone else is doing!
With limited screen real estate, I want to see as much info as possible as I'm evaluating US equities and deciding to pull the trigger to buy and sell. My "CoCo World" indicator packs a lot of info into a small space! I got the idea when looking at some Correlation Coefficient studies, hence the name "CoCo".
First I build three series to compare percent price changes...
#1 = Stock = Your chart symbol
#2 = US Index = SPY
#3 = World Index = This is an index of the top 10 world economies using the iShares country indexes. They are weighted by GDP and then the percent price change from last to current tick are summed together. For example, the US makes up 37%, China 22%, etc.
Why use iShares instead of the world markets directly, like the China SSE or Japan Nikkei? The iShares indexes are traded live at the same time as US markets. Measuring money flow in and out of these funds should naturally reflect broad sentiment about each country.
There are Green/Red bars in the indicator space under your chart, also Green/Red background colors.
Green Bar = Stock, US and World are UP, Stock up more than US, US up more than World.
Red Bar = Stock, US and World are DOWN, Stock down more than US, US down more than World.
Green Background = positive 7 period combined average direction of Symbol/US/World
Red Background = negative 7 period combined average direction of Symbol/US/World
This indicator works great all the way down to 1-minute bars... watch for green bars at the end of down-trends and red bars signalling the end of up-trends. Use caution if entering long trades while the background is red, this means the markets are against you!
Use "CoCo World" with your other favorite indicators to get a more complete picture.
Knowledge is POWER!
Good trading, and follow me for updates!
Brian Hershey
Correlation

Check The CorrelationCheck the correlation of different assets on your preferred timeframe to find trends, patterns, new strategies or to minimize the exposure in correlated assets

Correlation of chart symbol to different Index-ETF-currencyScript plots correlation of chart symbol to a variety of indexes, symbols, equities. ** Original idea was to find Bitcoin correlation, which I did not. Built in correlations are: Nikie, DAX, SPY, AAPL, US Dollar, Gold, EURUSD, USDCNY, EEM, QQQ, XLK, XLF, USDJPY, EURGBP

Intramarket Correlator L-O-L-A excerptHere we have an intramarket correlator taken as an excerpt from the L-O-L-A institutional trading system.
The plot displayed on the screen is the correlation index of the correlated security plotted against the security data series. Suggest simple line plots of contrasting colors.
When the plot is below the security price this is an indication of a strong negative correlation. When the plot is above the security price this is indicative of a strong positive correlation.
Provided for free by Tarzan at tradingview. or noprism@hushmail.com
plz contact for more information on L-O-L-A
*** Past performance is not necessarily indicative of future results ***
Life is like a moving picture
Nothing in life is a permanent fixture
Ray Davies

[RS]Multiple Majors Currency Basket Power Oscillator V1Power oscillator to discern what currency's are stronger/weaker.
added option to use a smoothed source(close) for pooling the change, giving longer term directional bias, note that this causes lag in the results as MA's turn slower than price.

[RS]Multiple Majors Currency Basket Power Oscillator V0Power oscillator to discern what currency's are stronger/weaker.

Power Law Correlation Indicator 2.0 The Power Law Correlation Indicator is an attempt to chart when a stock/currency/futures contract goes parabolic forming a upward or downward curve that accelerates according to power laws.
I've read about power laws from Sornette Diedler ( www.marketcalls.in ). And I think the theory is a good one.
The idea behind this indicator is that it will rise to 1.0 as the curve resembles a parabolic up or down swing. When it is below zero, the stock will flatten out.
There are many ways to use this indicator. One way I am testing it out is in trading Strangles or Straddle option trades. When this indicator goes below zero and starts to turn around, it means that it has flattened out. This is like a squeeze indicator. (see the TTM squeeze indicator).
Since this indicator goes below zero and the squeeze plays tend to be mean-reverting; then its a great time to put on a straddle/strangle.
Another way to use it is to think of it in terms of trend strength. Think of it as a kind of ADX, that measures the trend strength. When it is rising, the trend is strong; when it is dropping, the trend is weak.
Lastly I think this indicator needs some work. I tried to put the power (x^n) function into it but my coding skill is limited. I am hoping that Lazy Bear or Ricardo Santos can do it some justice.
Also I think that if we can figure out how to do other power law graphs, perhaps we can plot them together on one indicator.
So far I really like this one for finding Strangle spots. So check it out.
Peace
SpreadEagle71


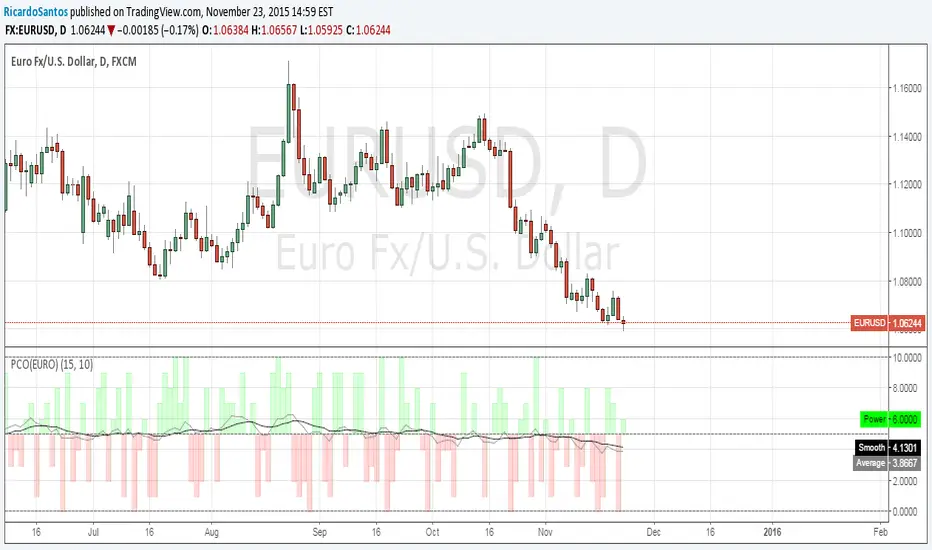
[RS]Power Correlation Oscillator (EURO) V1EXPERIMENTAL:
Added Smoother avg for a better visualization of the trending strength.