ETHUSD LONGS & SHORTS Bitfinex (margin traders)It is the interpretation of margin positions ETHUSD. Data — Bitfinex
暗号資産


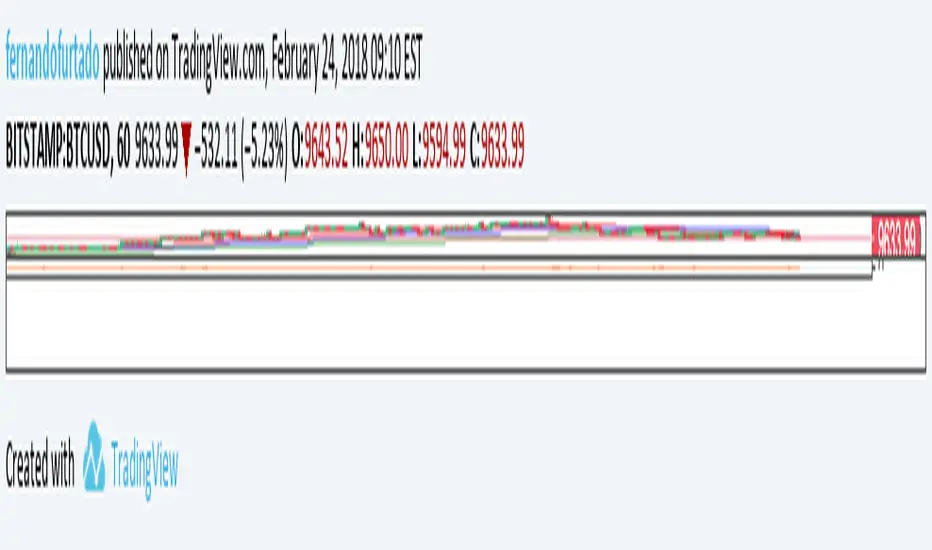
BTC World Volume (Multi-Exchange)Release: 2018-03-29
__________________________
WHAT IT DOES
Bitcoin is listed on multiple exchanges. Many people have called for a single global index that would quote BTC volume across all exchanges: this script is such a virtual volume aggregate of the 17 largest fiat exchanges on TradingView (listed in the script comments, and in Format > Inputs for you to select). It includes USD, EUR, JPY, KRW and USDT sources.
It will, independently for each tick, quote the volume from all selected exchanges and display a stacked representation, freely inspired from CoinMarketCap charts; also a Moving Average. Each fiat/continent has its own general color, to be able to quickly glance at where volume is coming from, e.g. BitMEX or Asia. (colors are based on Google's Material Design).
By default:
Grey: BitMEX
Green: USD
Yellow: Tether (USDT)
Red: Asia (JPY, KRW)
Blue: Europe (EUR)
No more "on Coinbase this" or "on Bitstamp that", you've now got a global overview! It becomes easy to debunk a few common myths.
See CoinMarketCap for reference.
Note: Bitmex is not taken into account in CoinMarketCap (afaik) since it's trading a derivative asset (XBTUSD contracts), but it usually amounts to ~50% of the overall BTC volume in USD value. The 16 other exchanges quote their volume in BTC, and they represent 30~40% of the overall BTC volume. I believe the whole is good enough to smooth out exchanges variations, and get a fair representation of real-time activity.
__________________________
HOW TO USE IT
Just add it to your chart, it will appear as a separate indicator. By default, it appears as stacked colored "areas". There is also a total volume Histogram, which is transparent by default: you can tweak that in Format > Style.
The darker and lighter backgrounds are respectively indicative of a downward price candle (open > close), or an upward price candle (close > open). They are unrelated to volume and simply help interpreting the indicator.
You can check/uncheck exchanges in the Format > Inputs tab to remove/add some of them from computation. All are enabled by default.
You can check/uncheck exchanges in the Format > Style tab to hide them (usually you would hide all or none).
You can edit colors and transpareny as well for each exchange.
You can edit "Volume histogram" transparency to have it show (it's a simpler representation than areas).
Moving Average: You can select the type (SMA, EMA, DEMA or TEMA) and length.
__________________________
Please leave feedback below or pm me directly for bugs and suggestions.


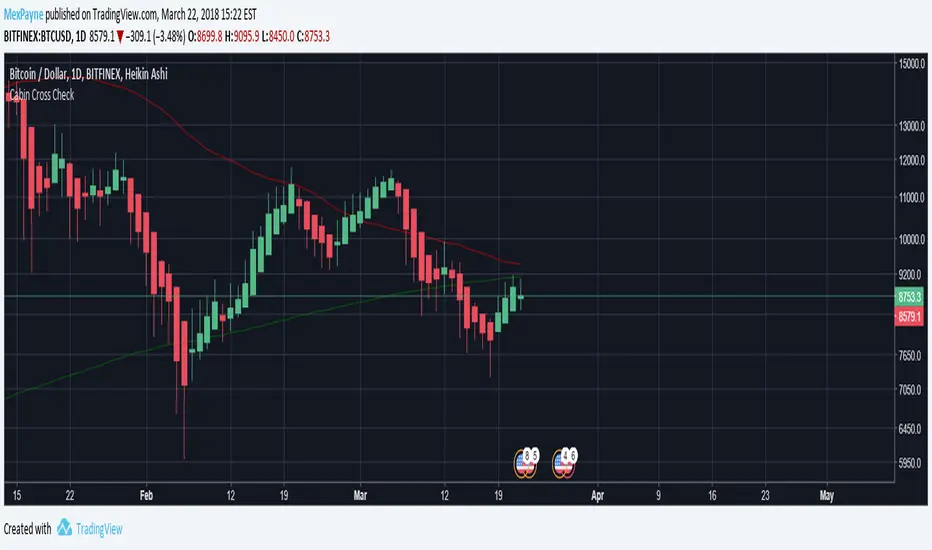
Death Cross - 200 MA / 50 Cross CheckerBITFINEX:BTCUSD
You can check if 200 day MA crossed by 50 day MA. Nuff said.
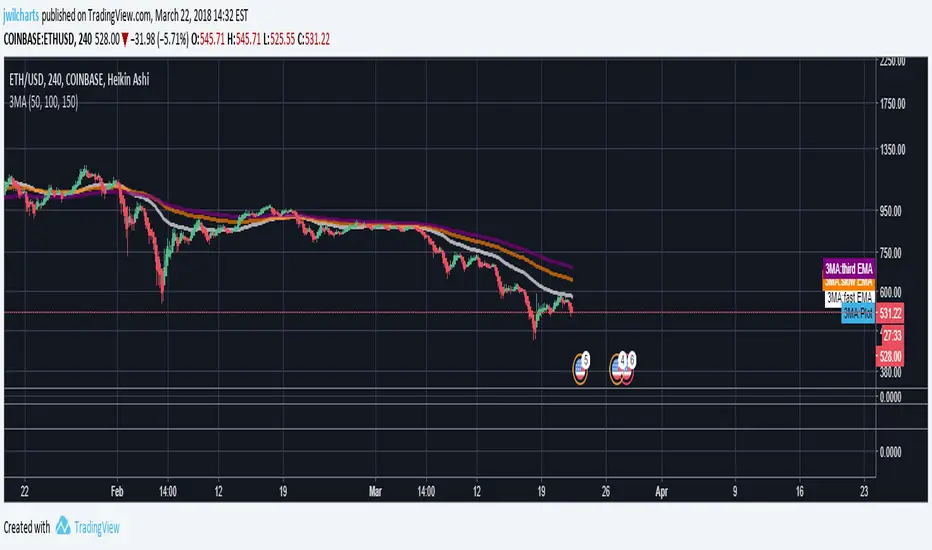
Triple EMAA simple script for displaying 3 EMA's. Commonly referred to as the "Triple EMA" strategy.


Bitfinex Margin VolumesQuick view on longs/short margin positions on Bitfinex for current Crypto Symbol.

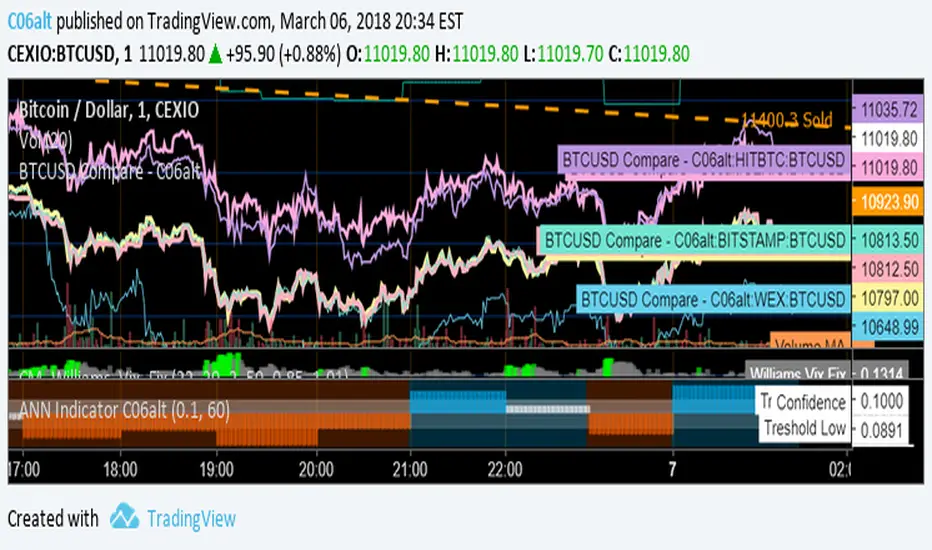
BTCUSD Compare - C06altThis Indicator allows for quick comparison between the BTCUSD exchange closing prices.
Multiple Moving AverageSuper simple script integrating three moving averages within only one script. It's going to help you to keep your chart cleaner while saving two spots for other indicators you may like. Try it out and let me know what you think.
A possible trading strategy:
Buy/Sell crossover of the MAs. Buy/Sell when fast MA crosses medium MA, double down when medium MA crosses slow MA.
Combining trading strategy is always a good idea.
Stochastic + Stochastic RSIJust a basic indicator I rigged up to help reduce screen real estate that ended up providing more insight than expected; overlays both the stochastic and stochastic RSI. While I initially made this to save space, I've begun to pick up on some interesting patterns in cryptocurrencies based on the divergence of stochastic from the stochastic RSI, and the comparison of their swing lows.
Left all settings modifiable, since this is simply a combination indicator I've left the source code open unlike other proprietary indicators I use.
Happy trading!
Austin Doyle
CTO
Crypto Playhouse

Crypto Altcoin USD Equivalent Value [anuva]Simply shows Altcoin/BTC pairs equivalent USD value on the left axis. Uses price from Bitstamp

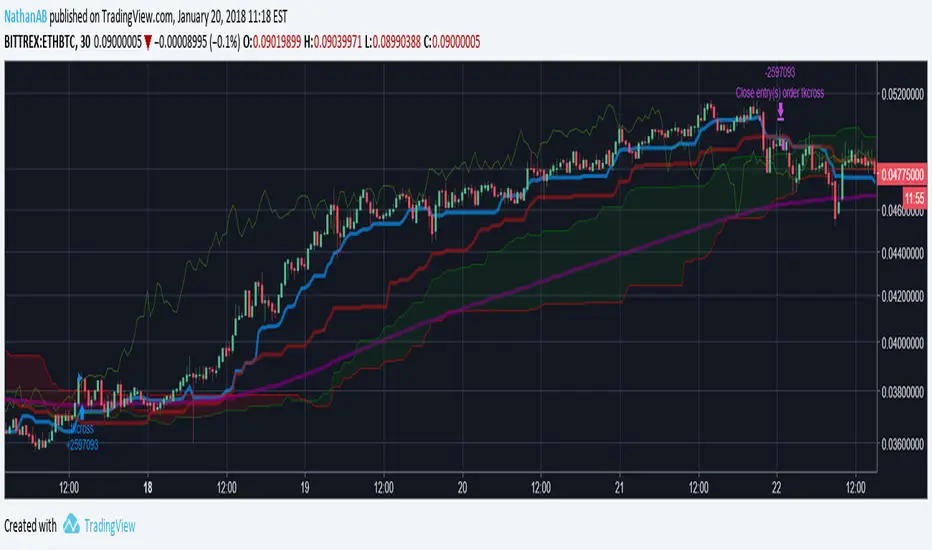
Crypto IchimokuIchimoku Cloud with settings recommended for crypto by trader IAmSatoshi. Includes a handy checkbox to double inputs, and alerts that can be set for when the price crosses the bottom or top of the cloud.
This script also includes an ichimoku signal count. The signal count is an UNWEIGHTED sum of positive or negative ichimoku signals with the greatest total being shown in either green(long>short) or red(short>long) or white(0, long==short). The signal count is only shown when their is a new signal or a signal is no longer valid.
If you use a major portion of the code please cite me. If you like the script and make a bunch of money using it, feel free to donate using the crypto addresses below.
BTC: 34uVepgjGJAKqf9i3mfdq8AG1dzTthjCgb
ETH: 0x71B15Beb6AF985853B5fC80205ddb3595C51B63e
LTC: MVzvSu53K5qPfjiQn4nk9D6WVLJKCMzXHJ
DASH: XoKVDBnhiyPvJeyRdpHjcWu1WtVjCbhP68
XMR: 46jnYGp7v5vCSAV8pzGXPbWM7YFiZNB4eaFCHsezitQ46KM1E6FgPM9ZaYJEfDVk5zdKoPQ7vw27ke34jMxERogvJDQhfQW

[Prod] SuperTrend with Stoploss+TrendZones - 1HHere, i'm using a SuperTrend (difference of moving averages) crossover strategy hybrid with stop-loss and trend-following to look at backtesting for the BCHUSD pair on the coinbase (GDAX) exchange.
Included in this script I've got some optimized parameters that seem to make a decent profit over ~35+ trades. The one thing that's bothering me here is that I get OCCASIONAL repaint issues with back-testing, but I can't figure out why for the life of me, because i'm using V3 in the start of the script. If someone could point out the mistake I may be making here , I feel like this could be a serious strategy to use against the BCHUSD pair on coinbase or other exchanges (with tuning of course).
I based this script off of with lots of modifications.

Quadruple Moving Averages For Day TradingQuadruple Moving Averages For Day Trading Crypto
Inputs of 8,13,21,55
Based on chart used by Philakone.


Ichimoku TK Cross > EMA200 Crypto StrategyIchimoku strategy for cryptocurrency trading.
Enters trades on bullish tenkan-kijun crosses when price is above 200 EMA which suggests a long-running bullish trend.
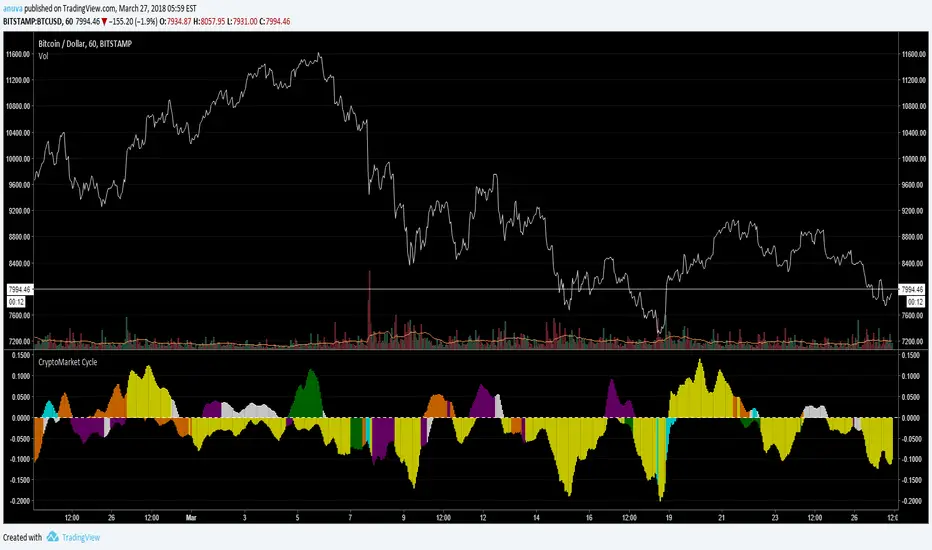
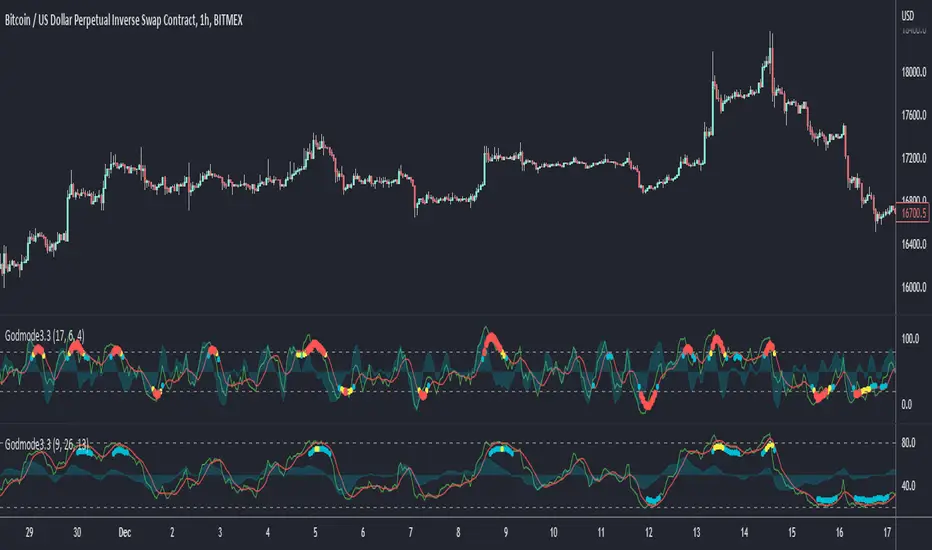
Godmode Oscillator 3.2This is nothing other than an update and slight modification to the original Godmode Oscillator published by xSilas
The update done by sco77m4r7in and myself.
Change Log:
Repaired the multi exchange option for BTC
Added additional 'Caution!' dots with color coding.
white = Early Caution signal
yellow = standard 'Caution!' signal
red = Extreme Caution signal
Be sure to give everyone a big thanks!
Original Godmode Script and Tutorial by xSilas :
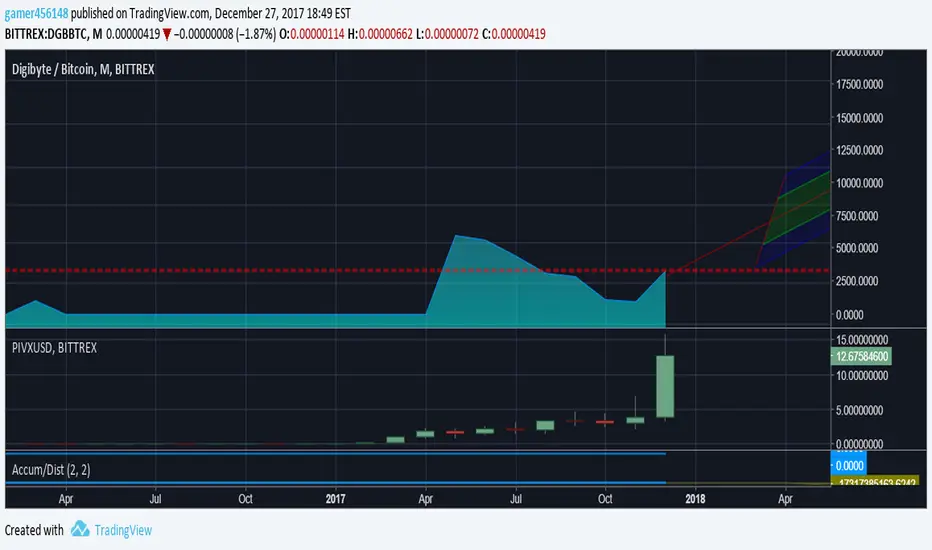
Accumulation/Distribution ViewsThis is a script for a view I wanted to go along with the Autoview plugin I bought. Keep in mind this is my first script and was created for me to learn the Pinescript framework. This isn't meant to be perfect. Indicator colors are usually blue or green or red. Also keep in mind since this is my first script in a new framework, the more stuff I build the better improvement. This is just something I wanted to first create with settings I wanted for variance and colors. The things I create in the future will obviously be an improvement.
Simple Spread Simple spread between two tickers. Click format to set inputs for tickers. ex: "COINBASE:BTC:USD"
