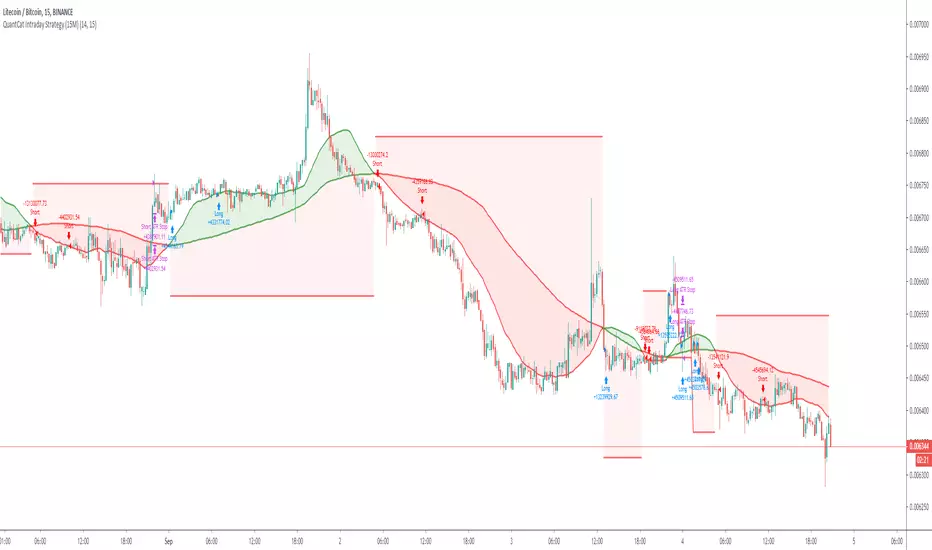
QuantCat Intraday Strategy (15M)QuantCat Intraday Strategy
This strategy is designed to be used on the 15 minute time frame, on liquid x/btc pairs and BTC/USD.
It works by having 2 moving averages, automatic stop loss calculation, and taking positions on MA crosses and MA zone bounces for confirmation.
Stoploss is so crucial to minimise any damage from huge unexpected candles, the strategies can just be used for entries as well, you don't have to stick to the exact formula- of the long and short system, but this by itself is profitable.
The system nets positive results on
-BTC/USD
-ETH/BTC
-LTC/BTC
-XRP/BTC
There is a small element of trend filtering also for the MA's, but I found adding it in actually hindered performance when testing and training the strategies unless it was using a loose value.
You can get live alerts for this strategy and speak to our developers by joining our server on discord! (Link in signature)
暗号資産
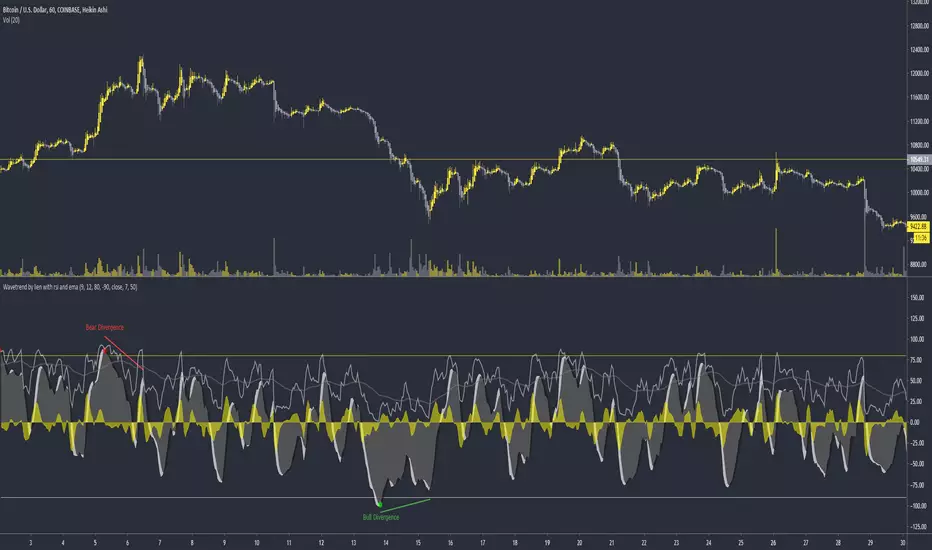
Liens wavetrend with rsi and emaWavetrend with rsi and ema. I would use the rsi and ema on high timeframes like the 4 hour to exit trades when it crosses.
Rsi and ema crosses can also be used to enter without divergence.
Test it out, try it on different TF. Enjoy :-)
Alert-QuarryLake Indicator Map - ATR Trend Following Strategy A lot of times I don't like my chart crowding with indicators, thus the reason for creating this script for my strategy QuarryLake.
This script also comes with alert.
Below is the explanation for QuarryLake
I have also updated the script in version 4.
This strategy consists of 3 indicators that I found works quite well together.
Keltner Channel, Waddah Attah Explosion, and Volatility Stop.
You can find WAE here
KC Period = 200
KCATR = 5
Vstop Period = 3
Vstop Mult = 1.5
Long when close > KC, close > Vstop, WAE trendUp
Short when close < KC, close < Vstop, WAE trendDown
Works well on BTCUSD XBTUSD, as well as other major liquid Pair.
Feel free to follow me on Twitter @Lancelot_Auger for more free Alpha.
Please acknowledge my effort by like and follow.
And lastly,
Save Hong Kong, the revolution of our times.

Trend Confirmation Indicator - Triple OBVDear all, you might wonder is there a confirmation indicator that has a high hit rate, is dependable, and could rely on the information it gives you when making a decision?
Here I present an indicator I developed specifically for cryptocurrency, in the minds of eliminating fakeouts and traps.
Trend is always invalid then there is a lack of volume, so by tracking the momentum of price direction & volume, we can have a ballpark about where the market is moving to.
On balance volume
obvshort = ema3
obvmedium = ema9
obvlong = ema26
This is a lagging indicator, which means it's not good at predicting reversal.
This is also the reason why
long signal = obvshort > obvmedium and obvshort > obvlong
shortsignal = obvshort < obvmedium and obvshort < obvlong
both without obvmedium >< obvlong
This indicator will not lie to you.
At last
Save Hong Kong, the revolution of our time.

CloudRest ATR based cloudThis is an indicator I have been working on for the past 2 years, developed specifically for cryptocurrency.
It is primarily a trend following indicator with great success and it performs the best in 4hrs to the weekly chart.
There are two components of this indicator.
The baseline from Ichimoku cloud and volatility stop .
baseline period = 26
volatility stop = 1.5ATR, 3
You can view this as the main component of a trend following system but you will need other confirmation indicators to confirm your entry.
Feel free to modify the script for your own system.
Feel free to follow me on twitter @Lancelot_Auger
I will be posting more content in the future, stay tuned.
And lastly,
Free hong kong, the revolution of our time!

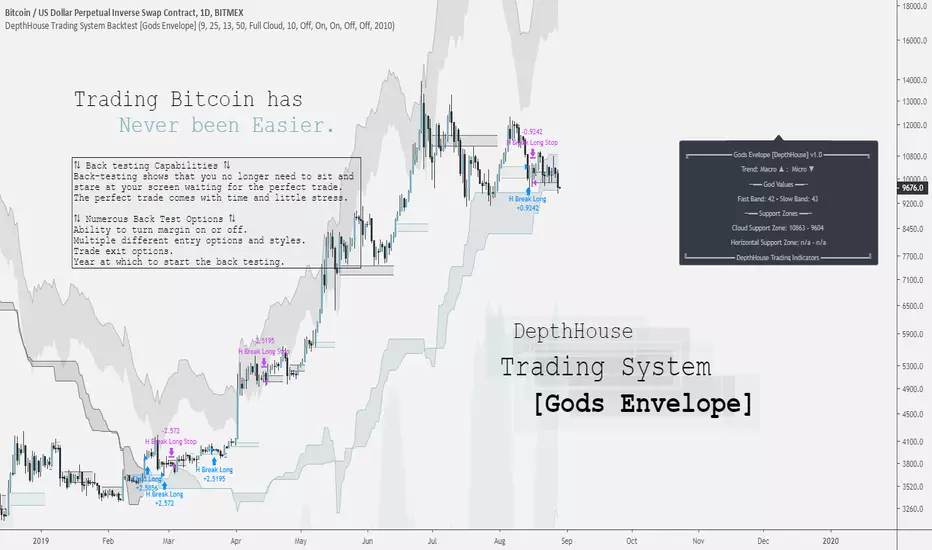
DepthHouse Trading System [Gods Envelope] Backtest StrategyCreated for Bitcoin!
*All testing has been done on the 1 Day time frame of BTC USD pairs.
Use at your own risk.
DepthHouse Trading System Basics
The Cloud:
The cloud is used in a very similar manner as the ichimoku cloud. A complete cross above or below the represents a macro trend change. The cloud then could be used as dynamic support and resistance zones.
By default there is no smoothing to the full cloud. If you wish to add smoothing, you can change the ‘Trend Base On’ option to ‘Modded Cloud Average’ to add price action and smoothing into the cloud’s calculations. The Modded Cloud can then be used in the same manner as the Full Cloud. Generally, the Full Cloud is more forgiving and has less Macro Trend changes. By default, this option is turned off. The support or resistance zone created will be shown on the info panel on the right.
Horizontal Levels:
A Horizonal zone is generated each time there is a micro level trend change. For example, as soon as a positive micro trend change occurs a green horizontal level will be plotted.
These levels then can be used as temporary support and resistance zones. The Horizontal Break Trading Strategy is entirely based on these levels. These levels are also shown on the info panel on the right.
The Envelope Itself: (by default this is off)
By selecting the Overbought and Oversold Ranges option, a cloud envelope will appear around the price action. This envelope represents the overbought and oversold ranges. If the price action should go into these zones, the info panel on the right will show ‘CAUTION’ beside the God Values as this signals that the pair is either overbought or oversold.
The God Values:
The God values are listed on the info panel on the right. These are the values created by the Godmode indicator. Generally, below 20 or above 80 it signals for caution as the price action has overextended itself.
The Back-Test Strategy Options:
⇅ - Child Fomo Positioning:
Child Fomo Positioning strategy is entirely based on the macro trend change with the center cloud. As soon as there is a complete candle close above or below the cloud and a trend change takes place. The back-test places a market order as soon as the next candle opens. By default, it then will not close this position until the price action fully crosses the cloud once again.
⇅ - Horizontal Break Trading:
Horizontal Break Trading Strategy is entirely based on the horizontal levels generated and the macro trend direction. For example, say the Macro Trend is up, and a green, positive horizontal level is formed. As soon as a complete candle closes above the upper level of the positive zone, a limit order is placed in hope that the price action comes back down and retests, filling the order. This long will not close then until a negative level is formed. As soon as a negative level is formed a stop/loss order is placed on the lower level of the horizontal support zone. It will then do the opposite in a bearish trend, and margin trading is turned on.
⇅ - Parent Positions :
Parent Positioning Strategy is based on the overall trend and the center cloud levels. This strategy has limit orders waiting on the level of the cloud that is closest to the price action. Therefore, using this strategy alone, the back-test system waits for the trend to be confirmed, and then follows the price action with limit orders waiting on the cloud to be retested. By default this order does not close until a Marco trend change occurs.
⇅ - Take 50% Partial Profits:
This options allows the back-test to take 50% profit or loss when one of the two options occur.
Horizontal Break: This would close 50% of the position in the same manner it would close a trade using the horizontal break trading system.
God Values: Once the price action enters the oversold or overbought clouds, it would then place a close order as soon as the price action exits the cloud.
⟲ - Backtest Year Start Date :
Start year of the back-testing. If set to ex. 2017, the back-test will not calculate any trades that took place before Jan. 1 of 2017.
⚖ - Margin Trading :
By default, margin trading is turned off. Simply switch this option to on the enable ‘Short Trading’ into the strategy back-test.
Notes: If you are back testing multiple strategies at the same time, you must increase the pyramiding to correspond to the number or strategies.
My Favorite Settings:
Margin = Off
Pyramiding = 2 [Settings → Properties → Pyramiding → 2 orders
Child Fomo Positioning = On
Horizontal Break Trading = On
Everything else off 😊
DISCLAIMER: Past performance does not guarantee future results.
Use at your own risk.
Cyatophilum Shooting Stars 1m [ALERTSETUP]A Scalping Script Setup for the 1m Timeframe, using the cheesy candle pattern "Shooting Stars" plus some Trend Detection, Stop Loss and Take Profit integrated system, allowing these nice backtest results.
Currently in continuous development / real time testing on BitMEX data.

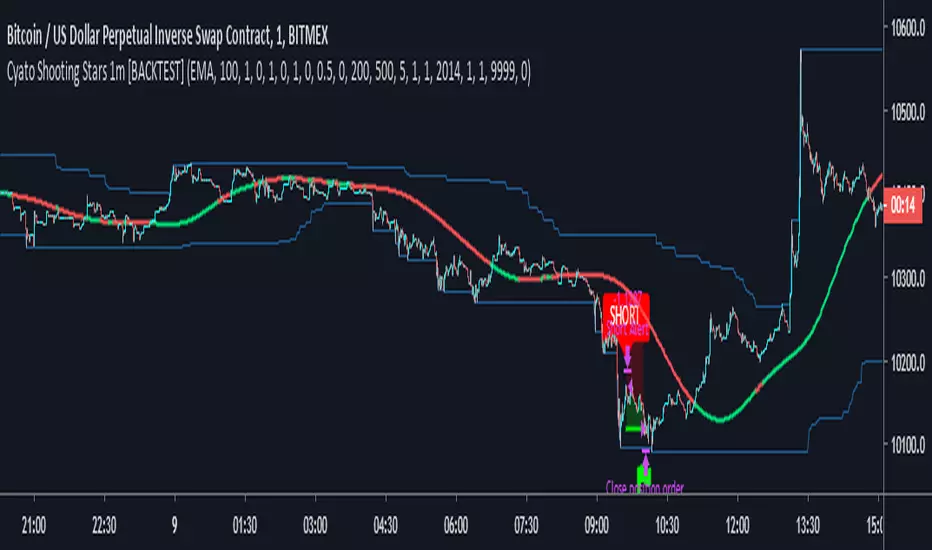
Cyatophilum Shooting Stars 1m [BACKTEST]A Scalping Script for the 1m Timeframe, using the cheesy candle pattern "Shooting Stars" plus some Trend Detection, Stop Loss and Take Profit integrated system, allowing these nice backtest results.
Currently in continuous development / real time testing on BitMEX data.
BullShrimp's 10EMAsA simple bundle of EMAs with some odd numbers that I found good confluence on 15min, 1h, 4h, 12h, 1d, 1w on BTC and on ALTS.
Works good for dynamic S/R on LTF and high probability target on MTF and HTF.
Try it out during your scans.
Lemme know what you think.
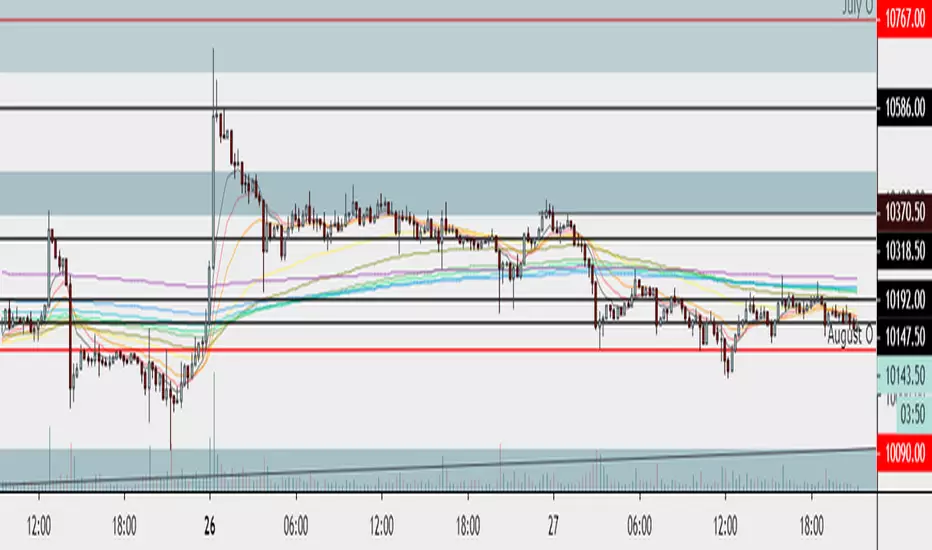
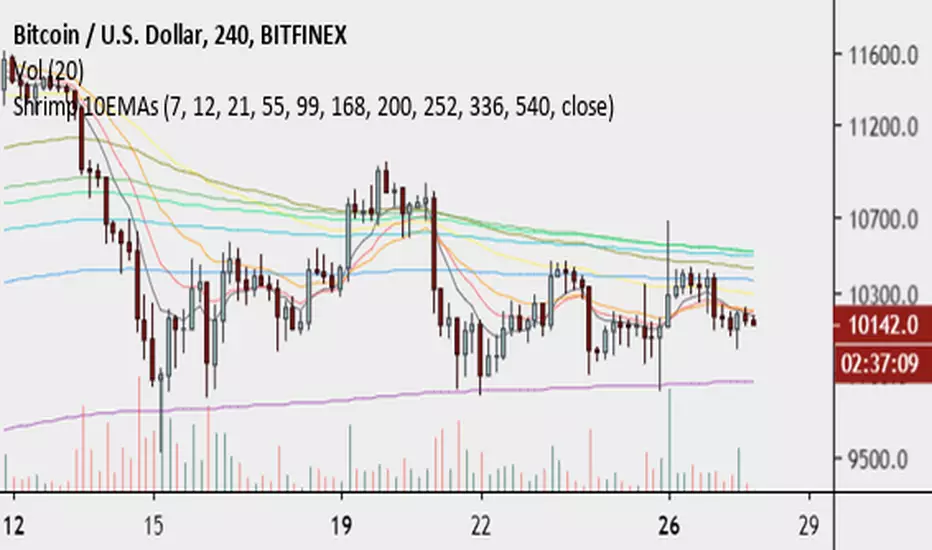
Shrimp 10EMAsA simple bundle of EMAs with some odd numbers that I found good confluence on 15min, 1h, 4h, 12h, 1d, 1w on BTC and on ALTS.
Works good for dynamic S/R on LTF and high probability target on MTF and HTF.
Try it out during your scans.
Lemme know what you think.
DAKELAX-XRPUSDT Bollinger Band Strategy for TradebotlerDAKELAX-XRPUSDT is a Tradebotler strategy designed to run on XRPUSDT for binance, it's a simple reverse to mean strategy and when backtested on may-aug 2019 on H1 timeframe it performs pretty well in backtest as well as running live.
In order to get started install the Tradebotler extension and connect the strategy with Binance or other crypto exchanges of your choice such as Kraken, Bitstamp, Bitmex, Bittrex, Polyneux etc, etc.


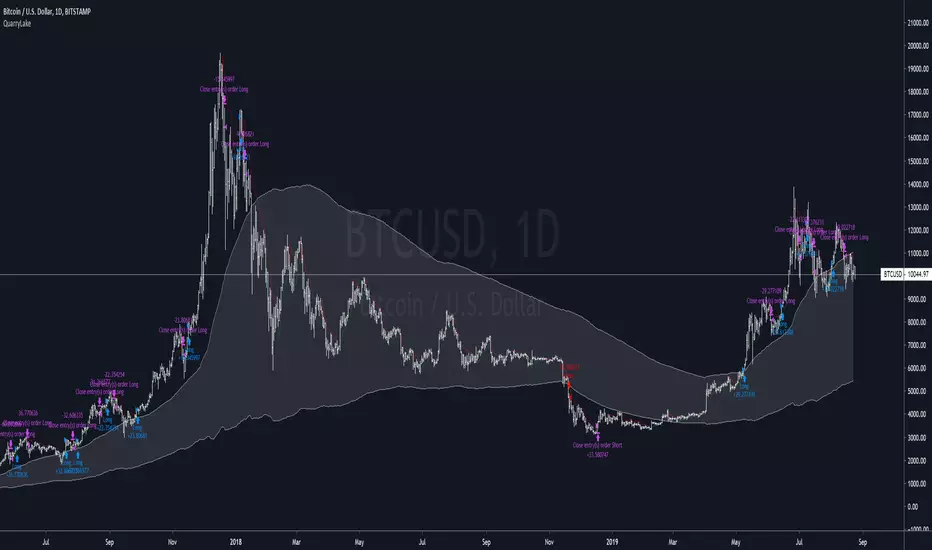
QuarryLake - An ATR base strategyThis strategy consists of 3 indicators that I found works quite well together.
Keltner Channel, Waddah Attah Explosion, and Volatility Stop.
You can find WAE here
KC Period = 200
KCATR = 5
Vstop Period = 3
Vstop Mult = 1.5
Long when close > KC, close > Vstop, WAE trendUp
Short when close < KC, close < Vstop, WAE trendDown
Works well on BTCUSD XBTUSD, as well as other major liquid Pair.
This strategy utilized a modified Kelly position sizing for BTCUSD Bitstamp, feel free to modify it to your needs.
More information can be found here dqydj.com
Feel free to follow me on Twitter @Lancelot_Auger for more free Alpha.


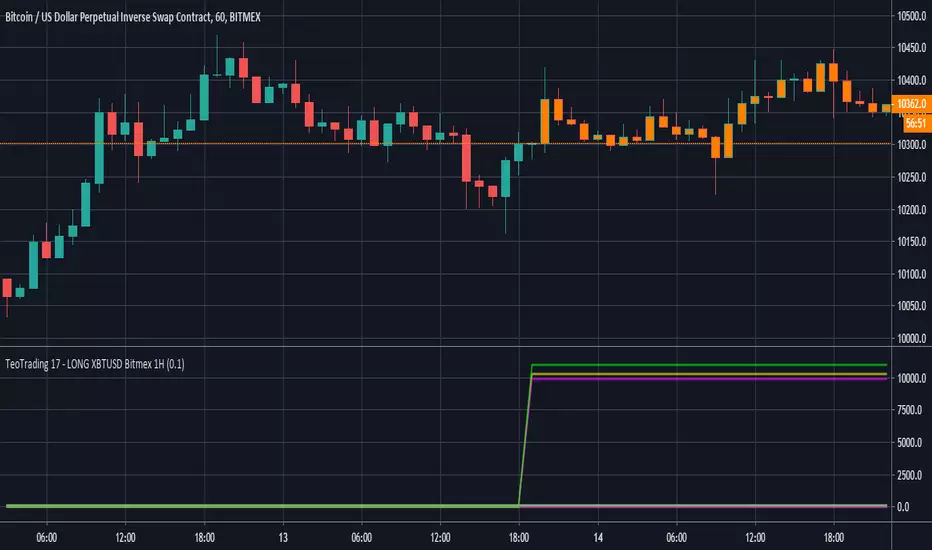
TeoTrading 17 - LONG XBTUSD Bitmex 1HLong Strategy for XBTUSD - Bitmex with real time statistics.
For use in 1 Hour Scale.
Various Volume RSI (USDT PRO)RSI that displays USDT (Tether) of various cryptocurrency exchanges together.
色々な暗号通貨取引所のUSDT(Tether)をまとめて表示するRSIです。
CRYPTOCAP:USDT
CRYPTOCAP:USDT.D
BINANCE
BITFINEX
POLONIEX
KRAKEN
BITTREX
HITBTC
HUOBI
詳細などはこちらにて
note.mu

Dark Cloud Cover Pattern Trading Setupthis study is another script based on the candlestick pattern . there are a few filters implemented to be applied to the output result to clear out noises. it sounds like finding real Dark Cloud Cover instances are too rare (interesting though!).
Dark Cloud Cover
it is a bearish reversal candlestick pattern where a down candle (typically bearish) opens above the close of the prior up candle (typically bullish) and then closes below the midpoint of the up candle. The five criteria for the Dark Cloud Cover pattern are:
An existing bullish uptrend.
An up (bullish) candle within that uptrend.
A gap up on the following day.
The gap up turns into a down (bearish) candle.
The bearish candle closes below the midpoint of the previous bullish candle.
all these criteria are implemented in code to produce a more accurate result.
please provide me with your valuable comments,
thanks for your attention,

Piercing Line Pattern Trading Setupthis study is the first one of a series of scripts based on the candlesticks pattern which will be published over time. There are several such scripts out there that can be found on TradingView but they seem to be inaccurate with a lot of noises and messy hard to understand code. In this script, I've tried to have a clean and easy to get
of the pattern itself and the method for detecting it with enough parameters to filter out the noises.
Piercing Pattern
A piercing pattern is a technical trading signal that is formed by a closing down day with a good-sized trading range, followed by a trading gap lower the following day with a bullish candlestick that covers at least half of the upward length of the previous day's bearish candlestick body, finishing with a close higher for the day. A piercing pattern often signals the end of a small to moderate downward trend. A piercing pattern can serve as a potential indicator for a bullish reversal. This pattern is formed by two consecutive candlestick marks. The first candlestick is bearish signifying a down day and the second is bullish signifying an up day. When a trader is watching for a bullish reversal any red candlestick followed by a green candlestick could be an alert. There are a few things that set a piercing pattern apart from a general red candlestick green candlestick pattern. In a piercing pattern, a green candlestick follows a red one with a significant gap in the red candlestick close and green candlestick open. On the second-day green candlestick, the candlestick’s body must also lengthen to cover at least half of the previous day’s red candlestick . Generally, the gap down and substantial increase to the closing price are good signs for a reversal. In a piercing pattern, the second-day green candlestick will close at or above the midpoint of the previous day’s red candlestick.
please provide me with your valuable comments,
thanks for your attention,

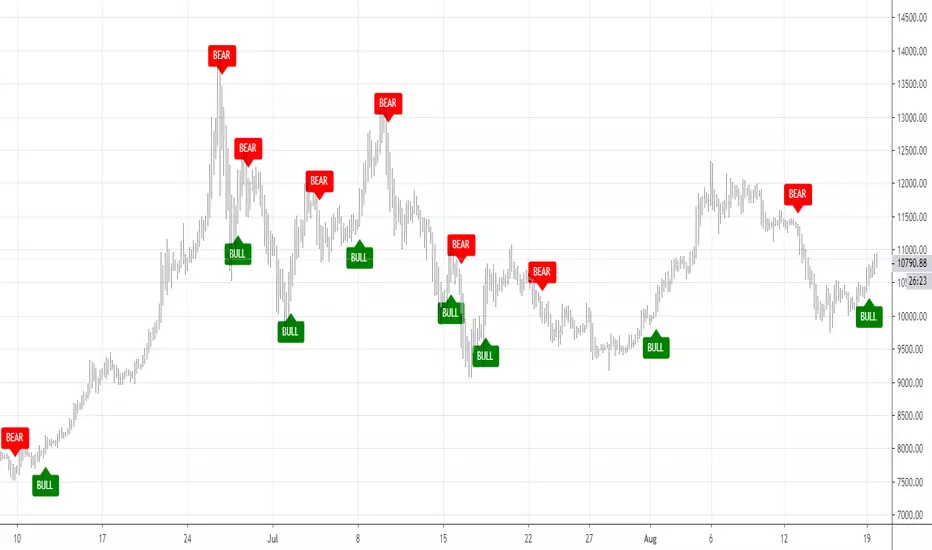
ExpressHow to use this indicator: This is an all-around indicator that is capable of being used on any chart. From 5m time frames up to 1 Day time frames.
There are BULL/BEAR signals which represent BUY/SELLS. You can set alerts with this indicator as well.
No back tester is currently provided with the Express.
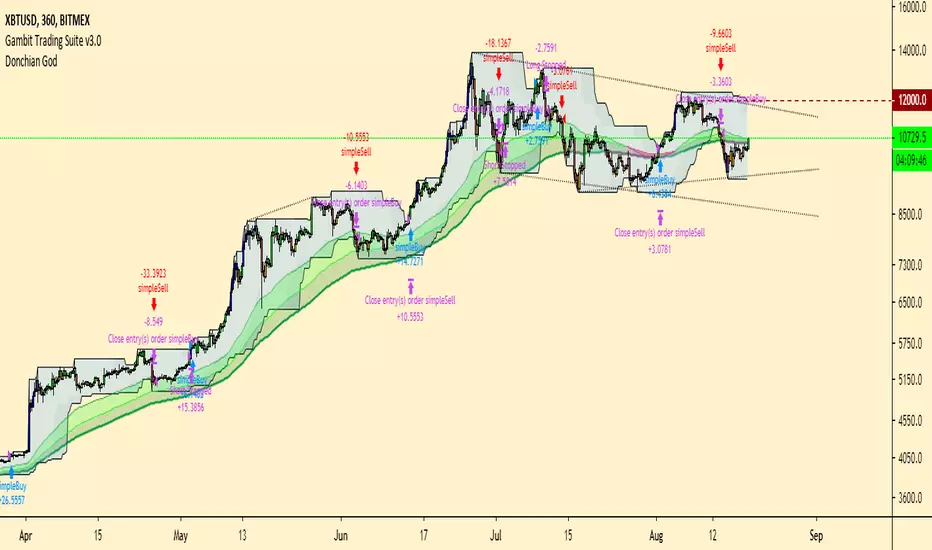
Donchian GodMy take on the turtle method. Included is the ultimate trend trader toolkit. Built in system that takes trades when price breaks either donchian channel and keeps that trade until price breaks the opposite channel. As well as many other tools!
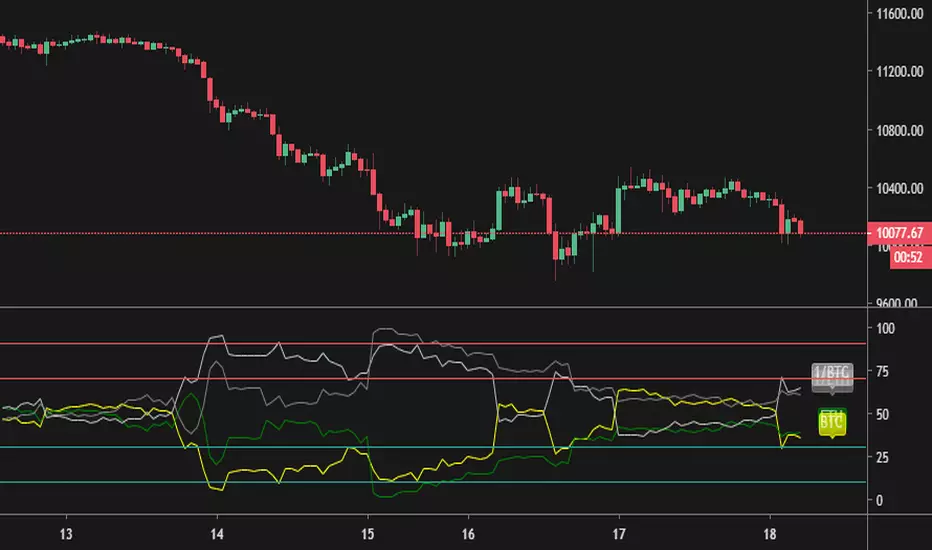
Various Volume RSI (BTC vs ETH) [mushoku]RSI to show btc and eth fight(BINANCE)
Binance(バイナンス) のBTCとETHを同時に表示する RSI です。
無料で使用できます。
こちらでも簡単ですが紹介しています。
note.mu