Mutanabby_AI __ OSC+ST+SQZMOMMutanabby_AI OSC+ST+SQZMOM: Multi-Component Trading Analysis Tool
Overview
The Mutanabby_AI OSC+ST+SQZMOM indicator combines three proven technical analysis components into a unified trading system, providing comprehensive market analysis through integrated oscillator signals, trend identification, and volatility assessment.
Core Components
Wave Trend Oscillator (OSC): Identifies overbought and oversold market conditions using exponential moving average calculations. Key threshold levels include overbought zones at 60 and 53, with oversold areas marked at -60 and -53. Crossover signals between the two oscillator lines generate entry opportunities, displayed as colored circles on the chart for easy identification.
Supertrend Indicator (ST): Determines overall market direction using Average True Range calculations with a 2.5 factor and 10-period ATR configuration. Green lines indicate confirmed uptrends while red lines signal downtrend conditions. The indicator automatically adapts to market volatility changes, providing reliable trend identification across different market environments.
Squeeze Momentum (SQZMOM): Compares Bollinger Bands with Keltner Channels to identify consolidation periods and potential breakout scenarios. Black squares indicate squeeze conditions representing low volatility periods, green triangles signal confirmed upward breakouts, and red triangles mark downward breakout confirmations.
Signal Generation Logic
Long Entry Conditions:
Green triangles from Squeeze Momentum component
Supertrend line transitioning to green
Bullish crossovers in Wave Trend Oscillator from oversold territory
Short Entry Conditions:
Red triangles from Squeeze Momentum component
Supertrend line transitioning to red
Bearish crossovers in Wave Trend Oscillator from overbought territory
Automated Risk Management
The indicator incorporates comprehensive risk management through ATR-based calculations. Stop losses are automatically positioned at 3x ATR distance from entry points, while three progressive take profit targets are established at 1x, 2x, and 3x ATR multiples respectively. All risk management levels are clearly displayed on the chart using colored lines and informative labels.
When trend direction changes, the system automatically clears previous risk levels and generates new calculations, ensuring all risk parameters remain current and relevant to existing market conditions.
Alert and Notification System
Comprehensive alert framework includes trend change notifications with complete trade setup details, squeeze release alerts for breakout opportunity identification, and trend weakness warnings for active position management. Alert messages contain specific trading pair information, timeframe specifications, and all relevant entry and exit level data.
Implementation Guidelines
Timeframe Selection: Higher timeframes including 4-hour and daily charts provide the most reliable signals for position trading strategies. One-hour charts demonstrate good performance for day trading applications, while 15-30 minute timeframes enable scalping approaches with enhanced risk management requirements.
Risk Management Integration: Limit individual trade risk to 1-2% of total capital using the automatically calculated stop loss levels for precise position sizing. Implement systematic profit-taking at each target level while adjusting stop loss positions to protect accumulated gains.
Market Volatility Adaptation: The indicator's ATR-based calculations automatically adjust to changing market volatility conditions. During high volatility periods, risk management levels appropriately widen, while low volatility conditions result in tighter risk parameters.
Optimization Techniques
Combine indicator signals with fundamental support and resistance level analysis for enhanced signal validation. Monitor volume patterns to confirm breakout strength, particularly when Squeeze Momentum signals develop. Maintain awareness of scheduled economic events that may influence market behavior independent of technical indicator signals.
The multi-component design provides internal signal confirmation through multiple alignment requirements, significantly reducing false signal occurrence while maintaining reasonable trade frequency for active trading strategies.
Technical Specifications
The Wave Trend Oscillator utilizes customizable channel length (default 10) and average length (default 21) parameters for optimal market sensitivity. Supertrend calculations employ ATR period of 10 with factor multiplier of 2.5 for balanced signal quality. Squeeze Momentum analysis uses Bollinger Band length of 20 periods with 2.0 multiplication factor, combined with Keltner Channel length of 20 periods and 1.5 multiplication factor.
Conclusion
The Mutanabby_AI OSC+ST+SQZMOM indicator provides a systematic approach to technical market analysis through the integration of proven oscillator, trend, and momentum components. Success requires thorough understanding of each element's functionality and disciplined implementation of proper risk management principles.
Practice with demo trading accounts before live implementation to develop familiarity with signal interpretation and trade management procedures. The indicator's systematic approach effectively reduces emotional decision-making while providing clear, objective guidelines for trade entry, management, and exit strategies across various market conditions.
Cryptos

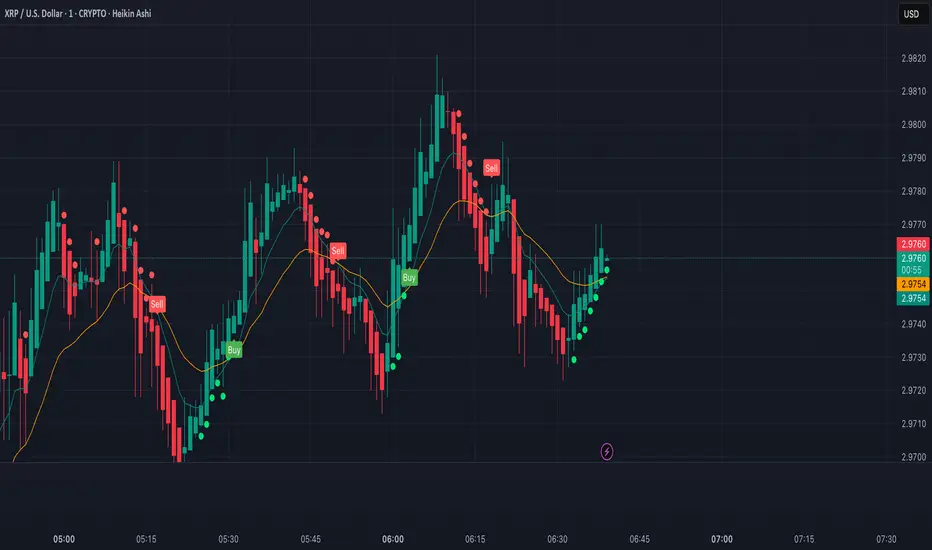
XRP Scalping with EMA Crossover Anticipation This script is designed to detect scalping opportunities on XRP by anticipating EMA crossovers, reinforced with technical confirmation filters.
Methodology
- The core signal is based on the crossover between a fast EMA (9) and a slow EMA (21).
- RSI (14) conditions are applied to avoid weak setups: RSI must be above 40 for buy signals and below 70 for sell signals.
- Before any crossover is validated, the script requires at least two consecutive “pre-crossover” signals. These indicate favorable momentum and convergence conditions before the crossover occurs.
- Final signals are only displayed if this minimum number of preconditions is met.
Application
This system is optimized for scalping on the 1-minute to 5-minute timeframes but can be adapted for longer-term setups by adjusting parameters. The anticipation logic helps reduce lagging entries and improves signal selectivity during volatile conditions.
Both pre-crossover and confirmed crossover conditions include alert options. The code is fully editable and customizable.
Stock Table aiTrendviewProfessional Stock Market Monitoring Table (Pine Script v5)
This indicator is a real-time multi-asset monitoring table designed for professional traders, analysts, and portfolio managers using TradingView. Built with Pine Script v5, it enables users to track up to 10 instruments (stocks, indices, forex pairs, cryptocurrencies, or commodities) in a unified table embedded directly into the chart. It is intended to streamline portfolio monitoring, cross-market analysis, and rapid visual comparison of asset performance.
The core logic of this script involves retrieving live price data through TradingView’s request.security() function for each of the selected symbols. It calculates both absolute price change and percentage price change relative to the previous bar close. This ensures users can see real-time movements in each asset’s price. These calculations are updated at the close of every bar to optimize performance and reduce processing load using the barstate.islast condition.
The display structure is dynamically generated using table.new() and related functions. Internally, the script stores symbol and price data in arrays for efficient processing. Symbols are cleaned to remove exchange prefixes (e.g., "NASDAQ:", "BINANCE:") so only the ticker name is displayed. Based on the selected layout (1 to 5 columns), the table auto-adjusts its row structure to maintain clarity and symmetry. Each cell reflects the ticker symbol, current price, and changes, with conditional formatting applied to indicate price movement direction using green (positive), red (negative), or neutral colors.
Users can customize many visual elements including text size, color themes, transparency, table position, and whether headers are shown. The script includes built-in fallbacks for invalid symbols or empty data, ensuring robustness and uninterrupted performance during live market hours.
Use cases include:
Intraday traders monitoring multiple instruments simultaneously.
Swing traders assessing relative strength and correlation.
Portfolio managers scanning asset performance without switching charts.
Analysts preparing multi-asset presentations or watchlists.
To use the tool:
Paste the Pine Script into the Pine Editor.
Add the script to the chart.
Enter your desired symbols via the input fields.
Customize table position, layout, size, and color to suit your workspace.
This script does not provide trade signals or financial advice. It is purely a market visualization and data presentation tool. All calculations are based on live chart data and are synchronized with the chart’s timeframe.
Disclaimer from aiTrendview:
This script is a visual tool developed for market awareness and comparative observation. It does not constitute financial advice or guarantee trading results. aiTrendview and its affiliates are not responsible for any losses arising from decisions made based on this tool. All trading involves risk, and past performance is not indicative of future results. Always consult with a qualified financial advisor before making trading decisions.

Golden Btc Formula🏆 Golden BTC Formula Bot
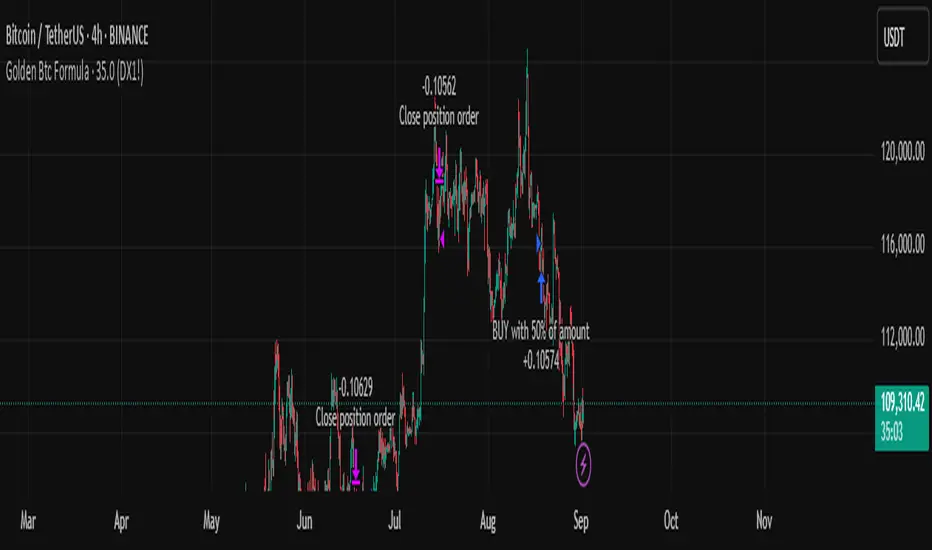
Introducing the Golden BTC Formula Bot — a smart trading strategy built specifically for Bitcoin on TradingView, designed to combine algorithmic precision with solid risk management.
📊 Backtest Overview:
The backtest shows that starting with a $10,000 balance and using a position size of 50% of equity per trade, the bot has delivered impressive, consistent returns over the tested period. The equity curve illustrates steady growth, minimal drawdowns, and controlled risk exposure — proving its robustness even in volatile market conditions.
⚙️ How It Works:
The bot automatically detects high-probability entries based on carefully tuned indicators and price action logic.
Targets and stop-loss levels are dynamically calculated to adapt to market volatility.
Built entirely in Pine Script for TradingView, so you can watch trades live or backtest historically.
🛡️ Risk Management Tips:
Even with a strong backtest, real trading always involves risk. Here’s how to use the Golden BTC Formula Bot responsibly:
✅ Use only part of your capital (e.g., 30–50%) for the bot.
✅ Set reasonable leverage (or stick to spot trading).
✅ Withdraw profits periodically instead of letting them fully compound forever.
✅ Always backtest and forward-test before going live, and consider running it in paper trading mode at first.
MACD Liquidity Tracker Strategy [Quant Trading]MACD Liquidity Tracker Strategy
Overview
The MACD Liquidity Tracker Strategy is an enhanced trading system that transforms the traditional MACD indicator into a comprehensive momentum-based strategy with advanced visual signals and risk management. This strategy builds upon the original MACD Liquidity Tracker System indicator by TheNeWSystemLqtyTrckr , converting it into a fully automated trading strategy with improved parameters and additional features.
What Makes This Strategy Original
This strategy significantly enhances the basic MACD approach by introducing:
Four distinct system types for different market conditions and trading styles
Advanced color-coded histogram visualization with four dynamic colors showing momentum strength and direction
Integrated trend filtering using 9 different moving average types
Comprehensive risk management with customizable stop-loss and take-profit levels
Multiple alert systems for entry signals, exits, and trend conditions
Flexible signal display options with customizable entry markers
How It Works
Core MACD Calculation
The strategy uses a fully customizable MACD configuration with traditional default parameters:
Fast MA : 12 periods (customizable, minimum 1, no maximum limit)
Slow MA : 26 periods (customizable, minimum 1, no maximum limit)
Signal Line : 9 periods (customizable, now properly implemented and used)
Cryptocurrency Optimization : The strategy's flexible parameter system allows for significant optimization across different crypto assets. Traditional MACD settings (12/26/9) often generate excessive noise and false signals in volatile crypto markets. By using slower, more smoothed parameters, traders can capture meaningful momentum shifts while filtering out market noise.
Example - DOGE Optimization (45/80/290 settings) :
• Performance : Optimized parameters yielding exceptional backtesting results with 29,800% PnL
• Why it works : DOGE's high volatility and social sentiment-driven price action benefits from heavily smoothed indicators
• Timeframes : Particularly effective on 30-minute and 4-hour charts for swing trading
• Logic : The very slow parameters filter out noise and capture only the most significant trend changes
Other Optimizable Cryptocurrencies : This parameter flexibility makes the strategy highly effective for major altcoins including SUI, SEI, LINK, Solana (SOL) , and many others. Each crypto asset can benefit from custom parameter tuning based on its unique volatility profile and trading characteristics.
Four Trading System Types
1. Normal System (Default)
Long signals : When MACD line is above the signal line
Short signals : When MACD line is below the signal line
Best for : Swing trading and capturing longer-term trends in stable markets
Logic : Traditional MACD crossover approach using the signal line
2. Fast System
Long signals : Bright Blue OR Dark Magenta (transparent) histogram colors
Short signals : Dark Blue (transparent) OR Bright Magenta histogram colors
Best for : Scalping and high-volatility markets (crypto, forex)
Logic : Leverages early momentum shifts based on histogram color changes
3. Safe System
Long signals : Only Bright Blue histogram color (strongest bullish momentum)
Short signals : All other colors (Dark Blue, Bright Magenta, Dark Magenta)
Best for : Risk-averse traders and choppy markets
Logic : Prioritizes only the strongest bullish signals while treating everything else as bearish
4. Crossover System
Long signals : MACD line crosses above signal line
Short signals : MACD line crosses below signal line
Best for : Precise timing entries with traditional MACD methodology
Logic : Pure crossover signals for more precise entry timing
Color-Coded Histogram Logic
The strategy uses four distinct colors to visualize momentum:
🔹 Bright Blue : MACD > 0 and rising (strong bullish momentum)
🔹 Dark Blue (Transparent) : MACD > 0 but falling (weakening bullish momentum)
🔹 Bright Magenta : MACD < 0 and falling (strong bearish momentum)
🔹 Dark Magenta (Transparent) : MACD < 0 but rising (weakening bearish momentum)
Trend Filter Integration
The strategy includes an advanced trend filter using 9 different moving average types:
SMA (Simple Moving Average)
EMA (Exponential Moving Average) - Default
WMA (Weighted Moving Average)
HMA (Hull Moving Average)
RMA (Running Moving Average)
LSMA (Least Squares Moving Average)
DEMA (Double Exponential Moving Average)
TEMA (Triple Exponential Moving Average)
VIDYA (Variable Index Dynamic Average)
Default Settings : 50-period EMA for trend identification
Visual Signal System
Entry Markers : Blue triangles (▲) below candles for long entries, Magenta triangles (▼) above candles for short entries
Candle Coloring : Price candles change color based on active signals (Blue = Long, Magenta = Short)
Signal Text : Optional "Long" or "Short" text inside entry triangles (toggleable)
Trend MA : Gray line plotted on main chart for trend reference
Parameter Optimization Examples
DOGE Trading Success (Optimized Parameters) :
Using 45/80/290 MACD settings with 50-period EMA trend filter has shown exceptional results on DOGE:
Performance : Backtesting results showing 29,800% PnL demonstrate the power of proper parameter optimization
Reasoning : DOGE's meme-driven volatility and social sentiment spikes create significant noise with traditional MACD settings
Solution : Very slow parameters (45/80/290) filter out social media-driven price spikes while capturing only major momentum shifts
Optimal Timeframes : 30-minute and 4-hour charts for swing trading opportunities
Result : Exceptionally clean signals with minimal false entries during DOGE's characteristic pump-and-dump cycles
Multi-Crypto Adaptability :
The same optimization principles apply to other major cryptocurrencies:
SUI : Benefits from smoothed parameters due to newer coin volatility patterns
SEI : Requires adjustment for its unique DeFi-related price movements
LINK : Oracle news events create price spikes that benefit from noise filtering
Solana (SOL) : Network congestion events and ecosystem developments need smoothed detection
General Rule : Higher volatility coins typically benefit from very slow MACD parameters (40-50 / 70-90 / 250-300 ranges)
Key Input Parameters
System Type : Choose between Fast, Normal, Safe, or Crossover (Default: Normal)
MACD Fast MA : 12 periods default (no maximum limit, consider 40-50 for crypto optimization)
MACD Slow MA : 26 periods default (no maximum limit, consider 70-90 for crypto optimization)
MACD Signal MA : 9 periods default (now properly utilized, consider 250-300 for crypto optimization)
Trend MA Type : EMA default (9 options available)
Trend MA Length : 50 periods default (no maximum limit)
Signal Display : Both, Long Only, Short Only, or None
Show Signal Text : True/False toggle for entry marker text
Trading Applications
Recommended Use Cases
Momentum Trading : Capitalize on strong directional moves using the color-coded system
Trend Following : Combine MACD signals with trend MA filter for higher probability trades
Scalping : Use "Fast" system type for quick entries in volatile markets
Swing Trading : Use "Normal" or "Safe" system types for longer-term positions
Cryptocurrency Trading : Optimize parameters for individual crypto assets (e.g., 45/80/290 for DOGE, custom settings for SUI, SEI, LINK, SOL)
Market Suitability
Volatile Markets : Forex, crypto, indices (recommend "Fast" system or smoothed parameters)
Stable Markets : Stocks, ETFs (recommend "Normal" or "Safe" system)
All Timeframes : Effective from 1-minute charts to daily charts
Crypto Optimization : Each major cryptocurrency (DOGE, SUI, SEI, LINK, SOL, etc.) can benefit from custom parameter tuning. Consider slower MACD parameters for noise reduction in volatile crypto markets
Alert System
The strategy provides comprehensive alerts for:
Entry Signals : Long and short entry triangle appearances
Exit Signals : Position exit notifications
Color Changes : Individual histogram color alerts
Trend Conditions : Price above/below trend MA alerts
Strategy Parameters
Default Settings
Initial Capital : $1,000
Position Size : 100% of equity
Commission : 0.1%
Slippage : 3 points
Date Range : January 1, 2018 to December 31, 2069
Risk Management (Optional)
Stop Loss : Disabled by default (customizable percentage-based)
Take Profit : Disabled by default (customizable percentage-based)
Short Trades : Disabled by default (can be enabled)
Important Notes and Limitations
Backtesting Considerations
Uses realistic commission (0.1%) and slippage (3 points)
Default position sizing uses 100% equity - adjust based on risk tolerance
Stop-loss and take-profit are disabled by default to show raw strategy performance
Strategy does not use lookahead bias or future data
Risk Warnings
Past performance does not guarantee future results
MACD-based strategies may produce false signals in ranging markets
Consider combining with additional confluences like support/resistance levels
Test thoroughly on demo accounts before live trading
Adjust position sizing based on your risk management requirements
Technical Limitations
Strategy does not work on non-standard chart types (Heikin Ashi, Renko, etc.)
Signals are based on close prices and may not reflect intraday price action
Multiple rapid signals in volatile conditions may result in overtrading
Credits and Attribution
This strategy is based on the original "MACD Liquidity Tracker System" indicator created by TheNeWSystemLqtyTrckr . This strategy version includes significant enhancements:
Complete strategy implementation with entry/exit logic
Addition of the "Crossover" system type
Proper implementation and utilization of the MACD signal line
Enhanced risk management features
Improved parameter flexibility with no artificial maximum limits
Additional alert systems for comprehensive trade management
The original indicator's core color logic and visual system have been preserved while expanding functionality for automated trading applications.

Baseline TrendBaseline Trend Strategy Overview
Baseline Trend is a crypto-only trading strategy built on straightforward price-based logic: market direction is determined solely by the price’s position relative to a selected baseline open price. No technical indicators like RSI, MACD, or volume are used—this approach is purely focused on price action and position size manipulation.
This strategy is a genuine concept, developed from my own market analysis and logical theory, refined through extensive observation of crypto market behaviour.
While the strategy offers structure and adaptability, it’s important to recognise that no single trading system or indicator fits all market conditions. This tool is meant to support decision-making, not replace it—encouraging traders to stay flexible, informed, and in control of their risk.
Important Usage Note:
This system is intended for crypto markets only.
– When used as an indicator guide, it can be applied to both spot and futures markets.
– However, when used with web-hook automation, it is designed only for futures contracts.
Ensure compatibility with your trading setup before using automation features.
Core Logic: The Baseline
The strategy revolves around the concept of a “Baseline”, with three types available:
Main Baseline: Defines the primary trend direction. If the price is above, go long; if below, go short.
Second Baseline and Third Baseline: Used to measure buying/selling pressure and are key to certain take-profit logic options.
Baselines are customisable to different timeframes—Year, Month, Week, and more—based on available input settings. Structurally, the Main Baseline is the highest-level trend reference, followed by the Second, then Third.
Users can mix and match these baselines across timeframes to backtest crypto symbols and understand behaviour patterns, particularly when used with standard candlestick charts.
Entry & Exit Logic
Entry Signal: Triggered when price crosses over/under a defined distance (percentage) from the Main Baseline. This distance is the Trade Line, calculated based on the close price.
Exit Signal / Stop Loss: If price moves un-favorable and crosses over/under the Stop Loss Line (a defined distance from the Main Baseline), the open position will be force-closed according to user-defined settings.
LiqC (Liquidation Cut)
LiqC is a secondary stop-loss that activates when a leveraged position’s loss equals or exceeds the user-defined liquidation threshold. It forcefully closes the position to help prevent full liquidation before stop-loss, providing an extra layer of protection.
This LiqC is directly tied to the leverage level set by the user. Please ensure you understand how leverage affects liquidation risk, as different broker exchanges may use different liquidation ratio models. Using incorrect assumptions or mismatched leverage values may result in unexpected behaviour.
Position Sizing & Block Units
This strategy features a block-based position sizing system designed for flexibility and precision in trade management:
Block Range: Customisable from 1 to 10 blocks
Risk Allocation: Controlled through a user-defined ROE (Risk of Equity) value
For example, setting an ROE of 0.1% with 10 blocks allocates a total of 1% of account equity to the position. This structure supports both conservative and aggressive risk approaches, depending on user preference.
Block sizes are automatically calculated in alignment with exchange requirements, using Minimum Notional Value (MNV) and Minimum Trade Amount (MTA). These values are dynamically calculated based on the live market price, and scaled relative to the trader’s balance and selected risk percentage. This ensures accurate sizing with built-in adaptability for any account level and current market conditions.
Scalping Meets Trend Holding
This system blends short-term scalping with longer-term trend holding, offering a flexible and adaptive trading style.
Example:
Enter 10 blocks → take quick profits on 5 blocks → let the remaining 5 ride the trend.
This dual-layered approach allows traders to secure early gains while staying positioned for larger market moves. Think of it as:
5 Blocks to Protect: Capture quick wins and manage exposure.
5 Blocks to Pursue: Let profits run by following the broader trend.
By combining both protection and pursuit, the strategy supports risk control without sacrificing the potential for extended returns.
Flexible Take-Profit Logic
The strategy supports multiple, customisable take-profit mechanisms:
TP1–4 (Profit Percentage)
Triggers take profit of 1 block unit when unrealised gains reach defined percentage thresholds (TP1, TP2, TP3, TP4).
Buying/Selling Pressure-Based Take Profit
D1 – Pressure 1
Measures pressure between Second and Third Baselines.
If the distance between them exceeds a user-defined DPT (Decrease Post Threshold) and the price moves far enough from the Third Baseline, D1 activates to take profit or scale out one block.
D2 – Pressure 2
Measures pressure between the Main and Second Baselines.
Works similarly to D1, using a separate distance and pressure trigger.
Note: Both D1 and D2 deactivate in reversal or even trend conditions.
D3–5: High-High / Low-Low Logic
Based on bar index tracking after position entry:
For Long Positions: If after D3 bars the price doesn't exceed the previous bar's high, the system executes a take profit or scale-out.
For Short Positions: If the price doesn't drop below the previous low, the same logic applies.
This approach adds time-based and momentum-aware exit flexibility.
Leverage & Liquidation Risk
When backtesting with leverage enabled, the system checks whether historical candles exceed the liquidation range, calculated based on the average entry price and the leverage input. If the Liquidation Risk Count exceeds 1, profit and loss accuracy may be affected. Traders are encouraged to monitor this count closely to ensure realistic backtesting results.
Since the system cannot directly control or sync with your broker exchange’s actual leverage setting, it’s important to manually match the system’s leverage input with your broker’s configured leverage.
For example: If the system leverage input is set to 10, your exchange leverage setting must also be set to 10. Any mismatch will lead to inaccurate liquidation risk and PnL calculations.
Backtesting and Customisation
All TP1–4 and D1–5 functions are fully optional and customisable. Users are encouraged to backtest different crypto symbols to observe how price behaviour aligns with baseline structures and pressure metrics.
Each of the TP1–4 and D1–5 triggers is designed to execute only once per open position, ensuring controlled and predictable behaviour within each trade cycle.
Since backtesting is based on available historical bar data, please note that data availability varies depending on your TradingView subscription plan. For more reliable insights, it’s recommended to backtest across multiple time ranges, not just the full dataset, to assess the stability and consistency of the strategy’s performance over time.
Additionally, the time frame resolution interval in TradingView is customisable. For best results, use commonly supported time frames such as 30 minutes, 1 hour, 4 hours, 1 day, or 1 week. While the system is designed to support a broad range of intervals, non-standard resolutions may still cause calculation errors.
Currently, the system supports the following resolution ranges:
Intraday: from 1 minute to 720 minutes
(e.g., 60 minutes = 1 hour, 240 minutes = 4 hours, 720 minutes = 12 hours)
Daily: from 1 day to 6 days
Weekly: from 1 week to 3 weeks
Monthly: from 1 month to 4 months
Although the script is built to adapt to various resolutions, users should still monitor output behaviour closely, especially when testing less common or edge-case time frames.
System Usage Notice:
This system can be used as a standalone trading indicator or integrated with an exchange that supports web-hook signal execution. If you choose to automate trades via web-hook, please ensure you fully understand how to configure the setup properly. Web-hook integration methods vary between exchanges, and incorrect setup may lead to unintended trades. Users are responsible for ensuring proper configuration and monitoring of their automation.
Note on Lower Time Frame Usage
When using lower time frames (e.g., 1-minute charts) as the trading time frame, please be aware that available historical data may be limited depending on your subscription plan. This can affect the depth and reliability of backtesting, making it harder to establish a trustworthy probability model for a symbol’s behaviour over time.
Additionally, when pairing a high-level Main Baseline (MBL) time line (such as "1 Month") with low time frame resolutions (like 1-minute), you may encounter order execution limits or calculation overloads during backtesting. This is due to the large number of historical bars required, which can strain the system's capacity.
That said, if a user intentionally chooses to work with lower time frames, that decision is fully respected—but it should be done with awareness and at the user’s own risk.
Things to Be Aware Of (Web-hook Usage Only)
The following points apply if you're using web-hook automation to send signals from the system to an exchange:
Alert Signal Reliability
During extreme market volatility, some broker exchanges may fail to respond to web-hook signals due to traffic overload. While rare, this has occurred in the past and should be considered when relying on automation.
Alert Expiration (TradingView)
If you're on a Basic plan, TradingView alerts are only active for a limited time—typically around 1.5 months. Once expired, signals will no longer be sent out.
To keep your system active, reset the alert before expiration. For uninterrupted alerts, consider upgrading to a Premium plan, which supports permanent alert activation.
TradingView Alert Maintenance
TradingView may occasionally perform system maintenance, during which alerts may temporarily stop functioning. It’s recommended to monitor TradingView’s status if you’re relying on real-time automation.
Repainting
As of the current version, no repainting behaviour has been observed. Signal stability and consistency have been maintained across real-time and historical bars.
Order Execution Type and Fill Logic
All signals use Limit orders by default, except for MBL Exit and Fallback execution, which use Market orders.
Since Limit orders are not guaranteed to fill, the system includes logic to cancel unfilled orders and resend them. If necessary, a Fallback Market order is used to avoid conflict with new incoming trades.
This has only happened once, and is considered rare, but users should always monitor execution status to ensure accuracy and alignment with system behaviour.
Feedback
If you encounter any errors, bugs, or unexpected behaviour while using the system, please don’t hesitate to let me know. Your input is invaluable for helping improve the strategy in future updates.
Likewise, if you have any suggestions or ideas for enhancing the system—whether it’s a new feature, adjustment, or usability improvement—please feel free to share. Together, we can continue refining the tool to make it more robust and beneficial for everyone.
Disclaimer
All trading involves risk, particularly in the crypto market where conditions can be highly volatile. Past performance does not guarantee future outcomes, and market behaviour may evolve over time. This strategy is offered as a tool to support trading decisions and should not be considered financial or investment advice. Each user is responsible for their own actions and accepts full responsibility for any results that may arise from using this system.

Dominance Interflow DThis indicator visualizes the normalized dominance levels of key sectors in the crypto market, including Bitcoin, Ethereum, Stablecoins, and the Altcoins as grouped market segments.
All dominance values are normalized between 0 and 1 for clear visual comparison. This allows traders and analysts to:
- Track capital rotation and dominance shifts
- Identify Altseason setups or defensive market phases
- Spot Risk-On / Risk-Off sentiment based on Stablecoin dominance
- Evaluate market breadth through altcoin tracking
📊 Included Data Series:
- 🟧 Bitcoin Dominance (BTC.D)
- 🔵 Ethereum Dominance (ETH.D)
- ⚪ Stablecoin Dominance (STABLE.C.D)
- 🟥 Without Top 50 Coins (TOTALE50.D)
- 🟥 without Top 100 Coins (TOTALE100.D)
🧠 Smart Normalization:
Automatically adjusts based on timeframe
500 candles for Daily (1D)
💡 Use this tool to understand macro capital flows, identify crypto sector trends, and optimize your asset rotation strategy.

SUPER-MAGFLXMAGFLX
Made a bunch of these for different sectors, then realized they’re all basically the same—so you really only need one.
Here it is, with a few extra features like customizable display position and metric options.
Track 1 to 20+ tickers, your way, all in one clean, versatile template.
Features & Uses
Custom Ticker List: Enter any tickers you want to track—mix and match sectors or asset classes freely.
Flexible Display: Choose where the table appears on your chart (top-right, top-left, bottom-right, bottom-left).
Metric Options: Toggle on/off daily percentage change, current price, and price difference columns based on what you want to monitor.
Highlight Movers: Automatically spot and highlight the biggest gainer and biggest loser each day for quick insights.
Compact & Efficient: Fits neatly on your chart without clutter, whether tracking 1 ticker or 20+.
Color-Coded Data: Intuitive colors make it easy to spot gains, losses, and key movers at a glance.
User-Friendly: No coding needed—simply input your tickers and preferences to tailor your watchlist instantly.
Use it to:
Monitor your portfolio across multiple sectors in one place.
Quickly spot daily winners and losers.
Keep an eye on price trends and changes without opening multiple charts.
Save chart space while gaining market clarity.
Any comments welcomed there is no way to tell if a public script is being used right ? so if you use and like it give it boost or a comment to let me know

MestreDoFOMO RENKO Sushy System v6🔍 What is this script?
The MestreDoFOMO RENKO Sushy System is a visual tool developed to help traders better interpret the market trend based on a Renko logic adapted to traditional candlestick charts.
It does not use TradingView's native Renko chart, but rather a simulation of Renko behavior, calculated dynamically in real time, adapting to the percentage movement of the price.
🧠 How does it work?
The script uses a Renko simulation with an adjustable percentage base (Renko Size), allowing the trader to define the size of the virtual "blocks" or "bricks" in % of the price. This logic creates a dynamic trend line that changes direction only when there is a sufficient variation in the price — filtering out noise and helping to focus on the prevailing direction.
When a change in direction occurs, a visual signal is displayed on the chart:
💲 Buy signal, when the trend changes from bearish to bullish
👹 Sell signal, when the trend changes from bullish to bearish
These signals are not automatic trading alerts, but rather visual periodic signals based on the internal logic of the system.
📈 Why do we include EMAs (20, 50 and 200)?
Exponential moving averages (EMAs) are widely used in technical analysis as supporting tools for understanding market structure:
EMA 20: A short-term indicator, useful for capturing recent movements.
EMA 50: Considered an interactive trend average, often used as dynamic support/resistance.
EMA 200: A long-term reference, often used to identify the "bigger direction" of the market.
EMAs are indicated in the script and can be enabled or disabled according to the user's preference. They are not part of the signal logic — they serve only as visual and contextual support to assist the trader's manual analysis.
📋 Included features
✅ Renko logic adapted to the candlestick chart, with sensitivity control in %
✅ Trend line based on the current Renko direction
✅ Visual signals of trend change (buy/sell)
✅ Option to enable/disable EMAs 20, 50 and 200
✅ Information panel with trend status, EMA values and current parameters
✅ Customizable trend change alerts
✅ Background color to strengthen the direction (green = high, red = low)
🛠 How to use?
Choose the timeframe: Works best on timeframes longer than 1 hour (e.g. 1H, 4H, Daily).
Adjust the Renko size (%): Try starting with 1% and adjusting according to the asset (crypto, forex, etc.).
Decide whether to use EMAs: Only activate if you want additional context.
Observe the signals and the trend line: They are useful for detecting possible reversals or confirmations of movement.
Combine with other elements: This system is a support tool. For best results, use it in conjunction with price action, liquidity zones or other complementary indicators.
⚠️ Important notice
This script does not execute orders or make automatic decisions. It is an educational and visual tool created to help read the trend in a clean and simple way.
No guarantee of past or future performance is provided. Use is at the sole risk of the user.

EMA 200 Monitor - Bybit CoinsEMA 200 Monitor - Bybit Coins
📊 OVERVIEW
The EMA 200 Monitor - Bybit Coins is an advanced indicator that automatically monitors 30 of the top cryptocurrencies traded on Bybit, alerting you when they are close to the 200-period Exponential Moving Average on the 4-hour timeframe.
This indicator was developed especially for traders who use the EMA 200 as a key support/resistance level in their swing trading and position trading strategies.
🎯 WHAT IT'S FOR
Multi-Asset Monitoring: Simultaneous monitoring of 30 cryptocurrencies without having to switch between charts
Opportunity Identification: Detects when coins are approaching the 200 EMA, a crucial technical level
Automated Alerts: Real-time notifications when a coin reaches the configured proximity
Time Efficiency: Eliminates the need to manually check chart collections
⚙️ HOW IT WORKS
Main Functionality
The indicator uses the request.security() function to fetch price data and calculate the 200 EMA of each monitored asset. With each new bar, the script:
Calculates the distance between the current price and the 200 EMA for each coin
Identifies proximity based on the configured percentage (default: 2%)
Displays results in a table organized on the chart
Generates automatic alerts when proximity is detected
Monitored Coins
Major : BTC, ETH, BNB, ADA, XRP, SOL, DOT, DOGE, AVAX
DeFi : UNI, LINK, ATOM, ICP, NEAR, OP, ARB, INJ
Memecoins : SHIB, PEPE, WIF, BONK, FLOKI
Emerging : SUI, TON, APT, POL (ex-MATIC)
📋 AVAILABLE SETTINGS
Adjustable Parameters
EMA Length (Default: 200): Exponential Moving Average Period
Proximity Percentage (Default: 2%): Distance in percentage to consider "close"
Show Table (Default: Active): Show/hide results table
Table Position: Position of the table on the chart (9 options available)
Color System
🔴 Red: Distance ≤ 1% (very close)
🟠 Orange: Distance ≤ 1.5% (close)
🟡 Yellow: Distance ≤ 2% (approaching)
🚀 HOW TO USE
Initial Configuration
Add the indicator to the 4-hour timeframe chart
Set the parameters according to your strategy
Position the table where there is no graphic preference
Setting Alerts
Click "Create Alert" in TradingView
Select the "EMA 200 Monitor" indicator
Set the notification frequency and method
Activate the alert to receive automatic notifications
Results Interpretation
The table shows:
Coin: Asset name (e.g. BTC, ETH)
Price: Current currency quote
EMA 200: Current value of the moving average
Distance: Percentage of proximity to the core code
💡 STRATEGIES TO USE
Reversal Trading
Entry: When price touches or approaches the EMA 200
Stop: Below/above the EMA with a safety margin
Target: Previous resistance/support levels
Breakout Trading
Monitoring: Watch for currencies consolidating near the EMA 200
Entry: When the media is finally broken
Confirmation: Volume and close above/below the EMA
Swing Trading
Identification: Use the monitor to detect setups in formation
Timing: Wait for the EMA 200 to approach for detailed analysis
Management: Use the EMA as a reference for stops dynamics
⚠️ IMPORTANT CONSIDERATIONS
Technical Limitations
Request Bybit data: Access to exchange symbols required
Specific timeframe: Optimized for 4-hour analysis
Minimum delay: Data updated with each new bar
Usage Recommendations
Combine with technical analysis: Use together with other indicators
Confirm the configuration: Check the graphic patterns before trading
Manage risk: Always use stop loss and adequate position sizing
Backtesting: Test your strategy before applying with real capital
Disclaimer
This indicator is a technical analysis tool and does not constitute investment advice. Always do your own analysis and manage detailed information about the risks of your operations.
🔧 TECHNICAL INFORMATION
Pine Script version: v6
Type: Indicator (overlay=true)
Compatibility: All TradingView plans
Resources used: request.security(), arrays, tables
Performance: Optimized for multiple simultaneous queries
📈 COMPETITIVE ADVANTAGES
✅ Simultaneous monitoring of 30 major assets ✅ Clear visual interface with intuitive core system ✅ Customizable alerts for different details ✅ Optimized code for maximum performance ✅ Flexible configuration adaptable to different strategies ✅ Real-time update without the need for manual refresh
Developed for traders who value efficiency and accuracy in identifying market opportunities based on the EMA 20

Long Explosive V1The “Long Explosive V1” strategy calculates the percentage change in price from the last closing price of the candlestick, so that if it increases by a certain percentage it goes long, but if it decreases by another percentage it sends an exit order, so that the percentage limits above and below the current price function as inherent stop loss and take profit, with the benefit of taking advantage of the volatility of the bull market.
Entries and exits are always at the market and based on percentage changes in the price. Of course, the default configuration of the strategy considers a position with a 5% risk control, modest initial capital and standard commissions, which helps to obtain realistic results and protect the user from unexpectedly controlled potential losses.
It is again emphasized that it is always advisable to adjust the parameters of the strategy well, so that the risk-reward is well controlled.

Regime Filter IndicatorRegime Filter – Crypto Market Trend Indicator
📊 Overview
The Regime Filter is a powerful market analysis indicator designed specifically for crypto trading. It helps traders identify whether the market is in a bullish or bearish phase by analyzing key assets in the cryptocurrency market, including Bitcoin (BTC), Bitcoin Dominance (BTC.D), and the Altcoin Market (TOTAL3). The indicator compares these assets against their respective Simple Moving Averages (SMA) to determine the overall market regime, allowing traders to make more informed decisions.
🔍 How It Works
The Regime Filter evaluates three main components to determine the market's sentiment:
1. BTC Dominance (BTC.D) vs. 40 SMA (Medium Timeframe)
The Bitcoin Dominance (BTC.D) is compared to its 40-period SMA on a mid-timeframe (e.g.,
1-hour). If BTC.D is below the 40 SMA, it indicates that altcoins are performing well relative
to Bitcoin, suggesting a bullish altcoin market. If BTC.D is above the 40 SMA, Bitcoin is
gaining dominance, indicating a potential bearish phase for altcoins.
2. TOTAL3 Market Cap vs. 100 SMA (Medium Timeframe)
The TOTAL3 index, which tracks the total market capitalization of all cryptocurrencies except
Bitcoin and Ethereum, is compared to its 100-period SMA. A bullish signal occurs when TOTAL3
is above the 100 SMA, indicating strength in altcoins, while a bearish signal occurs when
TOTAL3 is below the 100 SMA, signaling a potential weakness in the altcoin market.
3. BTC Price vs. 200 SMA (Higher Timeframe)
The current Bitcoin price is compared to its 200-period Simple Moving Average (SMA) on a
higher timeframe (e.g., 4-hour). A bullish signal is given when the BTC price is above the 200
SMA, and a bearish signal when it's below.
🟢 Bullish Market Conditions
The market is considered bullish when:
- BTC Dominance (BTC.D) is below the 40 SMA, suggesting altcoins are gaining momentum.
- TOTAL3 Market Cap is above the 100 SMA, signaling strength in the altcoin market.
- BTC price is above the 200 SMA, indicating an uptrend in Bitcoin.
In these conditions, the background turns green 🟢, and a "Bullish" label is displayed on the chart.
🔴 Bearish Market Conditions
The market is considered bearish when:
- BTC Dominance (BTC.D) is above the 40 SMA, indicating Bitcoin is outperforming altcoins.
- TOTAL3 Market Cap is below the 100 SMA, signaling weakness in altcoins.
- BTC price is below the 200 SMA, indicating a downtrend in Bitcoin.
In these conditions, the background turns red 🔴, and a "Bearish" label appears on the chart.
⚙ Customization Options
- The Regime Filter offers flexibility for traders:
- Enable or Disable Specific SMAs: Customize the indicator by enabling or disabling the 200 SMA for Bitcoin, the 40 SMA for BTC Dominance, and the 100 SMA for TOTAL3.
- Adjust Timeframes: Choose the timeframes for each of the moving averages to suit your preferred trading strategy.
- Real-Time Data Adjustments: The indicator updates in real-time to reflect current market conditions, ensuring timely analysis.
📈 Best Use Cases
- Trend Confirmation: The Regime Filter is ideal for confirming the market's overall trend,
helping traders to align their positions with the dominant market sentiment.
- Trade Entry/Exit Signals: Use the indicator to identify favorable entry or exit points based on
whether the market is in a bullish or bearish phase.
- Market Overview: Gain a quick understanding of the broader crypto market, with a focus on
Bitcoin and altcoins, to make more strategic decisions.
⚠️ Important Notes
Trend-Following Indicator: The Regime Filter is a trend-following tool, meaning it works best in strong trending markets. It may not perform well in choppy, sideways markets.
Risk Management: This indicator is designed to assist in identifying market trends, but it does not guarantee profits. Always apply sound risk management strategies and use additional indicators when making trading decisions.
Not a Profit Guarantee: While this indicator can help identify potential market trends, no trading tool or strategy guarantees profits. Please trade responsibly and ensure that your decisions are based on comprehensive analysis and risk tolerance.

Previous Day, Week, Monday Liq + Asian, London & Ny session LiqGM Gs,
This indicator helps traders identify key liquidity levels from different market sessions (Asian, London, NY), as well as weekly and daily highs/lows. It automatically plots these levels on the chart, making it easier to spot potential support/resistance zones where price might react.
Key Features:
1. Multi-Timeframe Liquidity Zones
Previous Day High/Low – Tracks the prior day’s range.
Monday High/Low – Useful for weekly opening liquidity.
Previous Week High/Low – Helps identify broader weekly levels.
2. Customizable Session Times
Asian, London, and NY Session Highs/Lows – Automatically detects and plots key levels from each trading session.
Adjustable Time Zones – Supports multiple GMT offsets (GMT-8 to GMT+3), making it adaptable for traders worldwide.
3. Visual Customization
Color & Style Options – Each level type (e.g., London High, NY Low) can be customized in color, line style (solid, dashed, dotted), and width.
Faded Opacity for Swept Levels – When a level is swept (price breaks but closes beyond it), it becomes semi-transparent, helping traders distinguish active vs. invalidated levels.
4. Clean & Informative Labels
Each level has a clear label (e.g., "Asia High," "PW Low") for easy identification.
Adjustable label offsets prevent clutter on the chart.
Pros & Benefits for Traders:
✅ Helps Identify Key Liquidity Zones – Institutional traders often target session highs/lows for liquidity grabs. This indicator makes these levels visible at a glance.
✅ Adaptable to Different Trading Styles
Day Traders – Can use Asian/London/NY session levels for intraday setups.
Swing Traders – Can focus on weekly and Monday levels for broader trends.
✅ No Repainting – Levels are fixed once formed and do not change retroactively.
✅ Customizable for Personal Preference – Traders can adjust colors, line styles, and visibility to match their trading setup.
✅ Useful for Multiple Markets – Works well on Forex (major pairs), indices, and even crypto (due to 24/7 market structure similarities).
Suggested Use Cases:
Breakout Trading – Watch for price reactions at session highs/lows.
Mean Reversion – Fade moves into weekly or daily extremes.
Institutional Liquidity Analysis – Identify potential stop hunts or accumulation zones.
Conclusion:
This indicator is a powerful tool for traders who rely on session-based liquidity, institutional order flow, and key support/resistance levels. By automating the detection of these zones, it saves time and helps traders make more informed decisions.

Employee Portfolio Generator [By MUQWISHI]▋ INTRODUCTION :
The “Employee Portfolio Generator” simplifies the process of building a long-term investment portfolio tailored for employees seeking to build wealth through investments rather than traditional bank savings. The tool empowers employees to set up recurring deposits at customizable intervals, enabling to make additional purchases in a list of preferred holdings, with the ability to define the purchasing investment weight for each security. The tool serves as a comprehensive solution for tracking portfolio performance, conducting research, and analyzing specific aspects of portfolio investments. The output includes an index value, a table of holdings, and chart plots, providing a deeper understanding of the portfolio's historical movements.
_______________________
▋ OVERVIEW:
● Scenario (The chart above can be taken as an example) :
Let say, in 2010, a newly employed individual committed to saving $1,000 each month. Rather than relying on a traditional savings account, chose to invest the majority of monthly savings in stable well-established stocks. Allocating 30% of monthly saving to AMEX:SPY and another 30% to NASDAQ:QQQ , recognizing these as reliable options for steady growth. Additionally, there was an admired toward innovative business models of NASDAQ:AAPL , NASDAQ:MSFT , NASDAQ:AMZN , and NASDAQ:EBAY , leading to invest 10% in each of those companies. By the end of 2024, after 15 years, the total monthly deposits amounted to $179,000, which would have been the result of traditional saving alone. However, by sticking into long term invest, the value of the portfolio assets grew, reaching nearly $900,000.
_______________________
▋ OUTPUTS:
The table can be displayed in three formats:
1. Portfolio Index Title: displays the index name at the top, and at the bottom, it shows the index value, along with the chart timeframe, e.g., daily change in points and percentage.
2. Specifications: displays the essential information on portfolio performance, including the investment date range, total deposits, free cash, returns, and assets.
3. Holdings: a list of the holding securities inside a table that contains the ticker, last price, entry price, return percentage of the portfolio's total deposits, and latest weighted percentage of the portfolio. Additionally, a tooltip appears when the user passes the cursor over a ticker's cell, showing brief information about the company, such as the company's name, exchange market, country, sector, and industry.
4. Indication of New Deposit: An indication of a new deposit added to the portfolio for additional purchasing.
5. Chart: The portfolio's historical movements can be visualized in a plot, displayed as a bar chart, candlestick chart, or line chart, depending on the preferred format, as shown below.
_______________________
▋ INDICATOR SETTINGS:
Section(1): Table Settings
(1) Naming the index.
(2) Table location on the chart and cell size.
(3) Sorting Holdings Table. By securities’ {Return(%) Portfolio, Weight(%) Portfolio, or Ticker Alphabetical} order.
(4) Choose the type of index: {Assets, Return, or Return (%)}, and the plot type for the portfolio index: {Candle, Bar, or Line}.
(5) Positive/Negative colors.
(6) Table Colors (Title, Cell, and Text).
(7) To show/hide any of selected indicator’s components.
Section(2): Recurring Deposit Settings
(1) From DateTime of starting the investment.
(2) To DateTime of ending the investment
(3) The amount of recurring deposit into portfolio and currency.
(4) The frequency of recurring deposits into the portfolio {Weekly, 2-Weeks, Monthly, Quarterly, Yearly}
(5) The Depositing Model:
● Fixed: The amount for recurring deposits remains constant throughout the entire investment period.
● Increased %: The recurring deposit amount increases at the selected frequency and percentage throughout the entire investment period.
(5B) If the user selects “ Depositing Model: Increased % ”, specify the growth model (linear or exponential) and define the rate of increase.
Section(3): Portfolio Holdings
(1) Enable a ticker in the investment portfolio.
(2) The selected deposit frequency weight for a ticker. For example, if the monthly deposit is $1,000 and the selected weight for XYZ stock is 30%, $300 will be used to purchase shares of XYZ stock.
(3) Select up to 6 tickers that the investor is interested in for long-term investment.
Please let me know if you have any questions

Lockin Strength Indicator (LSI)How It Works:
RSI Calculation: The standard RSI is calculated using a 14-period by default.
Volume Weighting: If enabled, the LSI modifies the RSI by weighting it based on the volume relative to its moving average. This emphasizes periods of high or low volume, which can be particularly useful for Solana-based assets that might have unique volume profiles.
Plotting: The LSI is plotted with standard overbought and oversold levels, and background highlighting makes these areas visually distinct.
Customization:
RSI Length: You can adjust the length of the RSI period.
Overbought/Oversold Levels: You can modify the levels for overbought and oversold signals.
Volume Weighting: You can toggle volume weighting on or off.
This indicator is designed to give you a more nuanced view of Solana cryptocurrencies by combining RSI with volume dynamics.

Portfolio Index Generator [By MUQWISHI]▋ INTRODUCTION:
The “Portfolio Index Generator” simplifies the process of building a custom portfolio management index, allowing investors to input a list of preferred holdings from global securities and customize the initial investment weight of each security. Furthermore, it includes an option for rebalancing by adjusting the weights of assets to maintain a desired level of asset allocation. The tool serves as a comprehensive approach for tracking portfolio performance, conducting research, and analyzing specific aspects of portfolio investment. The output includes an index value, a table of holdings, and chart plotting, providing a deeper understanding of the portfolio's historical movement.
_______________________
▋ OVERVIEW:
The image can be taken as an example of building a custom portfolio index. I created this index and named it “My Portfolio Performance”, which comprises several global companies and crypto assets.
_______________________
▋ OUTPUTS:
The output can be divided into 4 sections:
1. Portfolio Index Title (Name & Value).
2. Portfolio Specifications.
3. Portfolio Holdings.
4. Portfolio Index Chart.
1. Portfolio Index Title, displays the index name at the top, and at the bottom, it shows the index value, along with the chart timeframe, e.g., daily change in points and percentage.
2. Portfolio Specifications, displays the essential information on portfolio performance, including the investment date range, initial capital, returns, assets, and equity.
3. Portfolio Holdings, a list of the holding securities inside a table that contains the ticker, average entry price, last price, return percentage of the portfolio's initial capital, and customized weighted percentage of the portfolio. Additionally, a tooltip appears when the user passes the cursor over a ticker's cell, showing brief information about the company, such as the company's name, exchange market, country, sector, and industry.
4. Index Chart, display a plot of the historical movement of the index in the form of a bar, candle, or line chart.
_______________________
▋ INDICATOR SETTINGS:
Section(1): Style Settings
(1) Naming the index.
(2) Table location on the chart and cell size.
(3) Sorting Holdings Table. By securities’ {Return(%) Portfolio, Weight(%) Portfolio, or Ticker Alphabetical} order.
(4) Choose the type of index: {Equity or Return (%)}, and the plot type for the index: {Candle, Bar, or Line}.
(5) Positive/Negative colors.
(6) Table Colors (Title, Cell, and Text).
(7) To show/hide any indicator’s components.
Section(2): Performance Settings
(1) Calculation window period: from DateTime to DateTime.
(2) Initial Capital and specifying currency.
(3) Option to enable portfolio rebalancing in {Monthly, Quarterly, or Yearly} intervals.
Section(3): Portfolio Holdings
(1) Enable and count security in the investment portfolio.
(2) Initial weight of security. For example, if the initial capital is $100,000 and the weight of XYZ stock is 4%, the initial value of the shares would be $4,000.
(3) Select and add up to 30 symbols that interested in.
Please let me know if you have any questions.

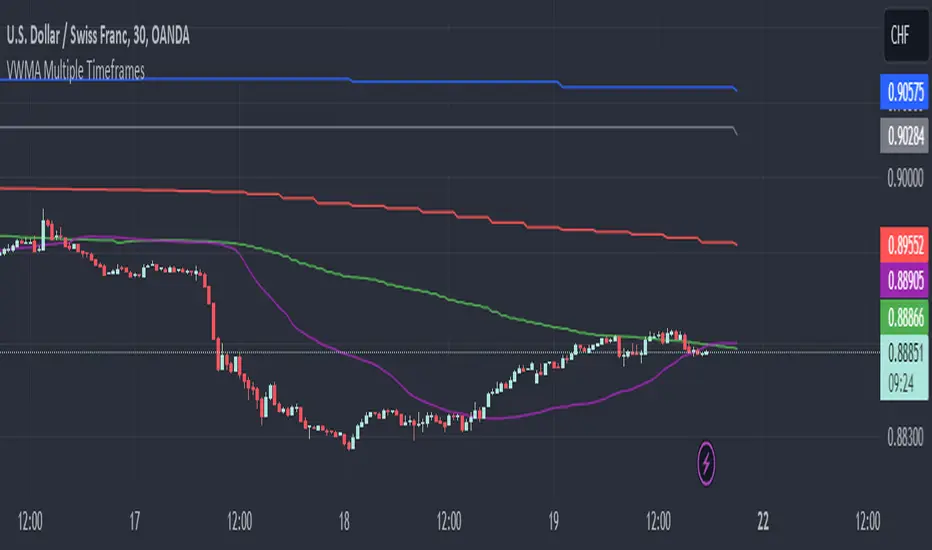
VWMA Multiple TimeframesVWMA Multiple Timeframes Indicator
This TradingView indicator plots the Volume Weighted Moving Average (VWMA) across multiple timeframes on your chart. The VWMA is a type of moving average that gives more weight to periods with higher volume, making it a valuable tool for traders who want to incorporate volume into their technical analysis.
Features:
Multi-timeframe Analysis: This indicator calculates and plots the VWMA on five different timeframes:
Weekly (W)
Daily (D)
4 Hours (240 minutes)
1 Hour (60 minutes)
15 Minutes
Visual Representation: Each timeframe's VWMA is plotted with a different color, making it easy to distinguish between them on the chart:
Weekly VWMA: Gray
Daily VWMA: Blue
4 Hours VWMA: Red
1 Hour VWMA: Green
15 Minutes VWMA: Purple
How to Use:
Trend Identification: Use the VWMA to identify the direction of the trend on different timeframes. For example, if the VWMA is trending upwards on multiple timeframes, it indicates a strong upward trend.
Support and Resistance: The VWMA can act as dynamic support or resistance levels. Price bouncing off a VWMA line might indicate a continuation of the trend.
Volume Confirmation: The VWMA considers volume, making it useful for confirming the strength of price movements. High volume moves that cause the VWMA to change direction can be more significant than low volume moves.
This indicator is ideal for traders who use multi-timeframe analysis and want to incorporate volume into their trend and support/resistance identification. Feel free to customize the periods and timeframes to suit your trading style.
PUMP IndicatorsPUMP Indicator Description
★ Supported Markets and Assets
The PUMP indicator is a versatile tool that can be effectively applied to various markets and assets, including:
▶ Korean Stocks: KOSPI, KOSDAQ, etc.
▶ U.S. Stocks: NYSE, NASDAQ, etc.
▶ Cryptocurrencies: Major cryptocurrencies such as Bitcoin (BTC), Ethereum (ETH), etc.
▶ Futures: Major futures contracts like gold, silver, crude oil, etc.
▶ ETFs: SPY, QQQ, etc.
★ Indicator Description
The PUMP indicator is designed to analyze price divergence and volatility.
It is provided with minimal representation on the chart, allowing users to use it in conjunction with other indicators, such as classical RSI, TRIX, CCI, ADX, BWI, Bollinger Bands, etc.
Everything displayed on the chart can be turned on or off in the options, allowing users to customize their setup.
The PUMP indicator is based on the concept of the MACD indicator, which calculates the difference between the leading line and the lagging line to generate signals.
GOOD, UP, and CR signals predict price increases.
DOWN and BAD signals predict price decreases.
WARN emphasizes that the buy position is not certain, regardless of price increases or decreases.
Therefore, the PUMP indicator is good to use with other indicators. It visually displays divergence and volatility signals along with the MACD movements below, and users can receive alerts for movements in their interested stocks using the alarm function.
It can be used as an indicator for viewing buy and sell signals, as well as predicting the price flow.
▶ (Drawback) Unlike typical TRIX, RSI, TRIX, CCI, ADX, BWI indicators, which are implemented in a new lower window, the PUMP indicator displays both signals and the leading and lagging lines simultaneously, so it is not implemented in a new window, meaning the baseline may vary depending on the daily chart appearance.
★ The PUMP indicator consists of the following components:
▶ PUMP Indicator Leading and Lagging Lines
PUMP t: Leading line (yellow)
PUMP p: Lagging line (blue)
The MACD displayed at the bottom of the chart calculates the divergence between the PUMP t leading line and the PUMP p lagging line.
▶ EA Formula
The core calculation of the PUMP indicator is as follows:
EA (Exponential Average): 100 * (eavg1 / eavg2)
Where eavg1 is the short-term EMA, and eavg2 is the long-term EMA.
It calculates the divergence of the index.
▶ The PUMP indicator is a fixed indicator (cannot be arbitrarily modified).
▶ Highlights: The method of calculating the interval or number of uses is an important part of the index calculation and is therefore private.
★ Signal Description
The PUMP indicator provides a total of six major signals:
▶ UP Signal: Occurs when the divergence between the MACD PUMP t leading line and PUMP p lagging line narrows, and the divergence of the exponential moving average widens compared to before.
▶ DOWN Signal: Occurs when the MACD PUMP t leading line crosses above the PUMP p lagging line.
▶ GOOD Signal: Represents an UP signal with added volume.
(The GOOD signal is not necessarily better than the UP signal. If a GOOD signal appears in a stock that has sufficiently fallen in price, it helps understand that a rebound has started. Therefore, the GOOD signal is made to find a rebound in stocks that have continuously declined, rather than finding signals in consistently rising prices.)
▶ BAD Signal: Occurs when the PUMP t leading line crosses above the 0 baseline, indicating a potential sell signal.
▶ WARN Signal: A warning signal occurring at high levels, indicating that buying is not recommended (regardless of buy or sell).
▶ CR Signal: Occurs in all sections where the PUMP t leading line crosses below the PUMP p lagging line.
★ Lower MACD Horizontal Baseline
The PUMP indicator provides three horizontal baselines from the MACD indicator for additional analysis:
▶ Pump H
▶ PUMP M
▶ PUMP L
It visually provides the divergence of the lower MACD indicator for rising and falling changes, with the default set to 0, and users can change the numbers in the options as needed.
★ Moving Averages
The PUMP indicator provides three basic moving averages:
▶ Buzz 7: 7-day moving average
▶ Buzz 26: 26-day moving average
▶ Buzz 120: 120-day moving average
The number of moving averages is fixed, but users can use them in conjunction with the moving averages provided by TradingView as needed.
★ Alert Function
Using the Alert function of TradingView, you can set alerts for various signals generated by the PUMP indicator.
▶ GOOD Signal Alert
▶ UP Signal Alert
▶ CR Signal Alert
▶ DOWN Signal Alert
▶ BAD Signal Alert
▶ WARN Signal Alert
★ Usage
1. The PUMP indicator is not focused on buy and sell signals but calculates the current price movement and divergence and is designed to express it through MACD leading and lagging lines and signals.
2. The PUMP indicator can be used alone or in conjunction with other indicators for technical analysis.
3. You can analyze buy and sell using the signals of the PUMP indicator along with fundamental analysis, such as news, issues, national policies, company profits, and sales increases.
4. The MACD leading and lagging lines at the bottom of the chart move inversely to the price, ensuring that the PUMP indicator does not interfere when used with other indicators.
5. You can receive real-time alerts using the alarm function.
Below, we attach pictures to help users understand.
============================================
PUMP 인디케이터 설명(한글)
★ 지원되는 시장 및 자산
PUMP 표시기는 다음과 같은 다양한 시장 및 자산에 효과적으로 적용할 수 있는 다용도 도구입니다:
▶ 한국주식: KOSPI, KOSDAQ 등.
▶ 미국주식: NYSE, NASDAQ 등.
▶ 암호화폐: 비트코인(BTC), 이더리움(ETH) 등 주요 암호화폐.
▶ 선물 : 금, 은, 원유 등 주요 선물 계약.
▶ 상장지수펀드(ETF) : SPY, QQQ 등.
★ 지표 설명
PUMP 지표는 가격 이격과 변동성을 분석하도록 설계되었습니다.
사용자가 만든 지표 또는 고전 RSI, TRIX, CCI, ADX, BWI, Bollinger Bands 등과 함께 사용할 수 있게 차트에 최소한의 표현으로 제공됩니다.
그리고 차트에 표현되는 모든 것들을 옵션에서 on / off 가능하게 하였기에 사용자가 커스텀 할 수 있게 하였습니다.
PUMP 지표 신호를 생성하기 위해 선행 라인과 후행 라인 간의 차이를 계산하는 MACD 지표의 개념을 기반으로 합니다.
GOOD, UP, CR 신호는 가격 상승을 예측합니다.
DOWN, BAD 신호는 가격 하락을 예측합니다.
WARN은 가격 상승과 하락에 관계없이, 매수 자리는 확실히 아님을 강조한 신호입니다.
그러므로 PUMP 지표는 다른 지표와 함께 사용하기 좋고, 이격과 변동성을 신호와 하단 MACD 움직임을 눈으로 볼 수 있으며, 알람 기능을 활용하여 관심 있는 종목의 움직임을 알람으로 받아 볼 수 있는 지표입니다.
매수와 매도를 보는 지표로 사용할 수 있으며, 가격의 흐름을 예상하는 지표로 사용할 수 있습니다.
▶ (단점) 보통의 TRIX, RSI, TRIX, CCI, ADX, BWI 지표들은 하단의 새로운 창에서 구현됩니다. 하지만 PUMP 지표는 신호와 하단 선행과 후행을 동시에 표현하기 때문에 새로운 창에서 구현되지 않기에 기준 축이 일봉의 모습에 따라 달라질 수 있습니다.
★ PUMP 지표는 다음과 같은 구성요소로 구성됩니다
▶ PUMP 지표 선행과 후행
PUMP t : 선행라인 (노란색)
PUMP p : 후행라인 (파란색)
차트 하단에 나타나는 MACD는 PUMP t선행라인과 PUMP p 후행라인의 이격도를 계산합니다.
▶ EA공식
PUMP 지표의 핵심 계산식은 다음과 같습니다:
EA(지수평균): 100 * (eavg1 / eavg2)
여기서 eavg1은 단기 EMA이고 eavg2는 장기 EMA입니다.
지수의 이격도를 계산합니다.
▶ PUMP 지표는 고정 지표입니다. (임의 수정 불가)
▶ 강조 : 이격의 계산법이나 사용하는 숫자는 지표 계산의 중요한 부분이므로 비공개입니다.
★ 신호 설명
PUMP 표시등은 총 6개의 주요 신호를 제공합니다:
▶ UP 신호: MACD PUMP t 선행과 PUMP p 후행의 이격이 줄어들 때, 지수 이동 평균의 이격도가 이전 보다 넓어지면 발생합니다.
▶ DOWN 신호: MACD PUMP t 선행이 PUMP p 후행을 상향 교차할 때 발생합니다.
▶ GOOD 신호: 거래량이 추가된 UP 신호를 나타냅니다.
(GOOD 신호가 UP 신호보다 좋다기 보다, 충분히 가격 하락한 종목에서 GOOD 신호가 나온다면 반등이 시작되는 것을 이해할 수 있게 만든 지표입니다. 그러므로 GOOD 신호는 가격이 꾸준히 상승하는 곳에서 신호를 찾기보다, 지속 하락하다 반등을 찾는 신호로 만들었습니다.)
▶ BAD 신호: PUMP t 선행이 0 기준선 이상으로 교차할 때 발생하며, 이는 잠재적인 판매 신호를 나타냅니다.
▶ 경고 신호: 높은 수준에서 발생하는 경고 신호로, 매수가 권장되지 않음을 나타냅니다(매수, 매도와 무관함).
▶ CR 신호: PUMP t 선행 라인이 PUMP p 후행 라인 아래로 교차하는 모든 구간에서 발생합니다.
★ 하단 MACD 가로 기준선
PUMP 표시기는 추가 분석을 위해 MACD 지표에서 3가지 가로 기준을 제공합니다:
▶ pump H
▶ PUMP M
▶ PUMP L
하단의 MACD 지표의 이격도를 상승 및 하강의 변화를 시각적으로 기준을 만들 수 있게 제공하며, 기본은 0으로 제공하고, 사용자의 필요에 따라 옵션에서 숫자를 변경할 수 있게 하였습니다.
★ 이동 평균
PUMP 표시기는 세 가지 기본 이동 평균을 제공 합니다:
▶ Buzz 7: 7일 이동 평균
▶ Buzz 26: 26일 이동 평균
▶ Buzz 120 : 120일 이동 평균
이동 평균의 수는 고정되어 있지만, 사용자는 필요에 따라 TradingView에서 제공하는 이동 평균과 함께 사용할 수 있습니다.
★ 알림 기능
TradingView의 Alert 기능을 사용하여 PUMP 지표 생성되는 다양한 신호에 대한 Alert를 설정할 수 있습니다.
▶ GOOD 신호 알림
▶ UP 신호 알림
▶ CR 신호 알림
▶ DOWN 신호 알림
▶ BAD 신호 알림
▶ WARN 신호 알림
★ 사용법
1.PUMP 지표는 매수와 매도에 중점을 둔 지표가 아니며 현재 가격의 움직임과 이격도를 계산하며 MACD 선행과 후행 그리고 신호로 표현하기 위해 만들어진 지표입니다.
2. PUMP 지표는 단일로 사용할 수 있고, 또는 다른 지표와 함께 기술적분석으로 사용할 수 있습니다.
3. 뉴스와 이슈, 국가의 정책, 회사의 이익, 매출의 상승 등 기본적분석과 함께 PUMP 지표의 신호를 이용하여 매수와 매도 분석을 할 수 있습니다.
4. 차트 하단의 MACD 선행과 후행은 가격의 움직임을 반대로 움직이며, 가격과 반대로 움직이게 함으로써 다른 지표와 함께 사용하였을 때, PUMP 지표가 방해가 되지 않게 하였습니다.
5. 알람을 사용하여 실시간으로 알람을 받아 보실 수 있습니다.
아래 사진을 첨부하여 사용자 이해를 돕습니다.
============================================
UP신호는 이격을
▶ The UP signal indicates horizontal divergence.
CR신호는 선행이 후행을 아래로 돌파
▶ The CR signal indicates vertical divergence when the leading line crosses below the lagging line.
WARN 신호를 확인
▶ Check the WARN signal.
BAD와 DOWN 신호
▶ BAD and DOWN signals.
PUMP 지표의 기준 3개
3 criteria for PUMP indicators
따로 그림을 그리지 않은 차트
▶ A chart without separate drawings.
============================================
다른 지표와 + 조합
+ Combination with other indicators

Buy-Sell Volume Bar Gauge [By MUQWISHI]▋ INTRODUCTION :
The Buy-Sell Volume Bar Gauge is developed to provide traders with a detailed analysis of volume in bars using a low timeframe, such as a 1-second interval, to measure the dominance of buy and sell for each bar. By highlighting the balance between buying and selling activities, the Buy-Sell Volume Bar Gauge helps traders identify potential volume momentum of a bar; aimed at being a useful tool for day traders and scalpers.
_______________________
▋ OVERVIEW:
_______________________
▋ METHODOLOGY:
The concept is based on bars from a lower timeframe within the current chart timeframe bar, where volume is categorized into Up, Down, and Neutral Volume, with each one displayed as a portion of a column plot. Up Volume is recorded when the price experiences a positive change, Down Volume occurs when the price experiences a negative change, and Neutral Volume is observed when the price shows no significant change.
_______________________
▋ INDICATOR SETTINGS:
(1) Fetch data from the selected lower timeframe. Note: If the selected timeframe is invalid (higher than chart), the indicator will automatically switch to 1 second.
(2) Price Source.
(3) Treating Neutral Data (Price Source) as
Neutral: In a lower timeframe, when the bar has no change in its price, the volume is counted as Neutral Volume.
Previous Move: In a lower timeframe, when the bar has no change in its price, the volume is counted as the previous change; “Up Volume” if the previous change was positive, and “Down Volume” if the previous change was negative.
Opposite Previous Move: In a lower timeframe, when the bar has no change in its price, the volume is counted as the opposite previous change; “Up Volume” if the previous change was negative, and “Down Volume” if the previous change was positive.
(4) Average Volume Length, it's used for lighting/darkening columns in a plot.
(5) Enable Alert.
(7) Total bought (%) Level.
(8) Total Sold (%) Level.
_____________________
▋ COMMENT:
The Buy-Sell Volume Bar Gauge can be taken as confirmation for predicting the next move, but it should not be considered a major factor in making a trading decision.

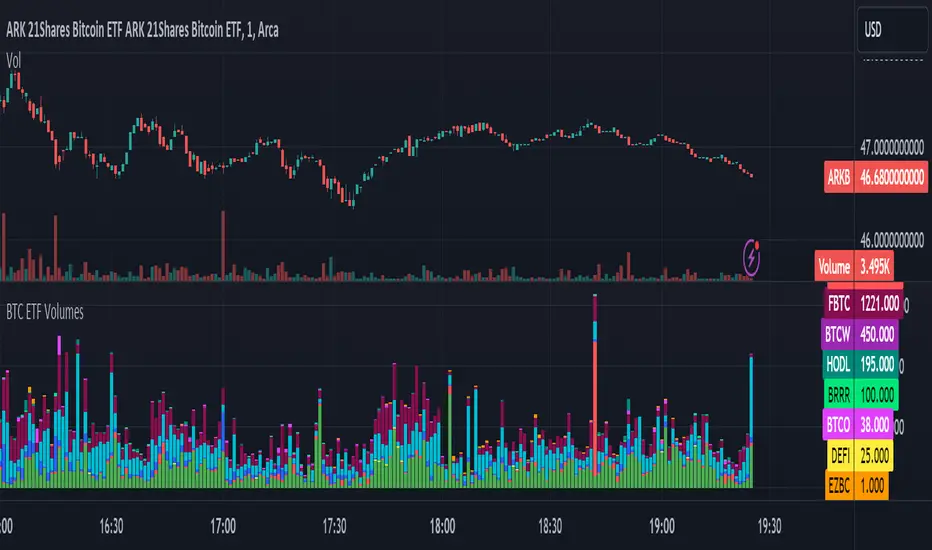
BTC ETF VolumesVolume
This script plots the trading volume of all BTC spot ETFs as well as the aggregate volume. Works on any chart and any timeframe.
Indicators
The volume of every ETF is plotted in a different color, with the total column adding up to the aggregate volume.
If you have price and indicator labels enabled you will also see individual ETF volume on your price scale on the right hand side.
If more BTC ETFs get launched I will add them.
Volume Speed [By MUQWISHI]▋ INTRODUCTION :
The “Volume Dynamic Scale Bar” is a method for determining the dominance of volume flow over a selected length and timeframe, indicating whether buyers or sellers are in control. In addition, it detects the average speed of volume flow over a specified period. This indicator is almost equivalent to Time & Sales (Tape) .
_______________________
▋ OVERVIEW:
_______________________
▋ ELEMENTS
(1) Volume Dynamic Scale Bar. As we observe, it has similar total up and down volume values to what we're seeing in the table. Note they have similar default inputs.
(2) A notice of a significant volume came.
(3) It estimates the speed of the average volume flow. In the tooltip, it shows the maximum and minimum recorded speeds along with the time since the chart was updated.
(4) Info of entered length and the selected timeframe.
(5) The widget will flash gradually for 3 seconds when there’s a significant volume occurred based on the selected timeframe.
_______________________
▋ INDICATOR SETTINGS:
(1) Timezone.
(2) Widget location and size on chart.
(3) Up & Down volume colors.
(4) Option to enable a visual flash when a single volume is more than {X value} of Average. For instance, 2 → means double the average volume.
(5) Fetch data from the selected lower timeframe.
(6) Number of bars at chosen timeframe.
(7) Volume OR Price Volume.
_____________________
▋ COMMENT:
The Volume Dynamic Scale Bar should not be taken as a major concept to build a trading decision.
Please let me know if you have any questions.
Thank you.

Time & Sales (Tape) [By MUQWISHI]▋ INTRODUCTION :
The “Time and Sales” (Tape) indicator generates trade data, including time, direction, price, and volume for each executed trade on an exchange. This information is typically delivered in real-time on a tick-by-tick basis or lower timeframe, providing insights into the traded size for a specific security.
_______________________
▋ OVERVIEW:
_______________________
▋ Volume Dynamic Scale Bar:
It's a way for determining dominance on the time and sales table, depending on the selected length (number of rows), indicating whether buyers or sellers are in control in selected length.
_______________________
▋ INDICATOR SETTINGS:
#Section One: Table Settings
#Section Two: Technical Settings
(1) Implement By: Retrieve data by
(1A) Lower Timeframe: Fetch data from the selected lower timeframe.
(1B) Live Tick: Fetch data in real-time on a tick-by-tick basis, capturing data as soon as it's observed by the system.
(2) Length (Number of Rows): User able to select number of rows.
(3) Size Type: Volume OR Price Volume.
_____________________
▋ COMMENT:
The values in a table should not be taken as a major concept to build a trading decision.
Please let me know if you have any questions.
Thank you.

All Candlestick Patterns Screener [By MUQWISHI]▋ INTRODUCTION :
The Candlestick Patterns Screener has been designed to offer an advanced monitoring solution for up to 40 symbols. Utilizing a log screener style, it efficiently gathers information on confirmed candlestick pattern occurrences and presents it in an organized table. This table includes essential details such as the symbol name, signal price, and the corresponding candlestick pattern name.
_______________________
▋ OVERVIEW:
_______________________
▋ CREDIT:
Credit to public technical “*All Candlestick Patterns*” indicator.
_______________________
▋ USAGE:
_______________________
▋ Final Comments:
For best performance, add the Candlestick Patterns Screener on active symbol chart like QQQ, SPY, AAPL, BTCUSDT, ES, EURUSD or …etc.
Candlestick patterns are not a major concept to build a trading decision.
Personally, I see candlestick patterns as a means to comprehend the psychology of the market, and help to follow the price action.
Please let me know if you have any questions.
Thank you.
