KVS-Ultimate FVG & iFVG System [MTF + Distance Filter]Description: This indicator identifies Fair Value Gaps (FVG) and Inversion FVGs (iFVG) across multiple timeframes (MTF) with an advanced visualization system. Unlike standard FVG indicators, this script solves the "chart clutter" problem with a unique Distance Filter and offers a customizable Split Label System.
Key Features:
1. Unique Distance Filter (Clean Screen Mode):
When enabled, the script only shows the closest FVGs to the current price within a user-defined limit.
Keeps your chart clean while focusing on relevant price action levels.
2. Split Label System (Tabular Design):
Completely customizable label positioning, sizing, and coloring.
Separate controls for Normal FVGs and iFVGs.
Smart Label Logic: If you hide the FVG box, its label automatically hides. If an FVG breaks and becomes an iFVG (or fades), the label logic switches automatically to the iFVG settings.
3. Strict Mode Filtering:
Enabled: Checks if the candle closing price effectively breaks the previous structure (High/Low of the 1st candle), ensuring high-quality gaps.
Disabled: Detects all gaps between wicks (Standard calculation).
4. Multi-Timeframe (MTF) Support:
Monitor FVGs from up to 5 different timeframes simultaneously on a single chart.
5. Dynamic Interaction:
Choose how the script reacts when an FVG is broken: Turn it into an iFVG (Inversion) or simply fade the color (Ghost/Fade mode).
How to Use:
Use the "Distance Filter" checkbox in settings to clean up old/far blocks.
Adjust "TF1" to "TF5" to set up your multi-timeframe analysis.
Customize the Label Panel to align text perfectly with your chart style.
Disclaimer: This tool is for educational purposes and support for technical analysis.
Distance

Zone Levels (Range + ZoneHeight)This is a Template for drawing out zones from one ankerpoint zone.Just mark out the distance from one leveledge to the next and it will give you infinte more zoneedges in the same distance. You can also adjust the zone height if wanted (i used 10 as example).
I hope youll enjoy it
AJ

MA Dist% Screener [Pineify]MA Distance Screener: Multi-Asset Market Scanner for TradingView
Screen multiple symbols and multiple timeframes on TradingView with the MA Distance Screener. Compare asset prices to flexible moving average types. Visual table view, custom assets, timeframes, and MA types. Supercharge your TradingView screener, optimize your workflow, and catch opportunities across assets in real time.
Key Features
Screen up to 10 custom symbols simultaneously across four configurable timeframes.
Choose from multiple Moving Average types: EMA, SMA, WMA, HMA, RMA, VWMA for flexible market context.
Visualize real-time % distance between price and moving average per asset/timeframe in a clean, color-coded table.
Highly customizable: Set your own symbol list, timeframes, MA length and type.
Alerts for symbol/MA deviations—instantly see overbought/oversold status with intuitive background coloring.
Optimized for crypto, FX, and traditional assets – all asset types supported.
How It Works
The MA Distance Screener acts as a dynamic multi-symbol, multi-timeframe scanner. For each selected symbol and timeframe, it calculates the percentage distance between the latest close price and the selected type of moving average (EMA/SMA/etc.). This is achieved by making secure `request.security` calls per asset/timeframe combination, retrieving updated values for each matrix cell. The computed distance (%) is displayed in a color-coded table: a positive value signals price above the MA (potential trend strength), while negatives indicate price below the MA (potential weakness or retracement). Custom colors highlight extreme overbought/oversold readings for quick visual cues.
Trading Ideas and Insights
Quickly spot assets showing the largest deviation from their moving averages – ideal for mean reversion or trend-following entries.
Identify clusters of assets and timeframes lining up in overbought or oversold states; optimize entries with multi-timeframe confirmation.
Scan the market in one glance—reduce chart-hopping and never miss an opportunity when multiple assets align for signals.
The ability to scan distance-to-MA across assets and periods gives traders a statistical edge, surfacing hidden pivots, breakouts, and mean-reversion trades that single-chart analysis may miss.
How Multiple Indicators Work Together
At its core, this screener allows the trader to configure what gets scanned—pick your top 10 assets and favorite 4 timeframes. With each matrix cell, the selected MA (e.g., 14-period EMA) is recalculated, and the current price's distance (%) from that value is computed. By offering six distinct moving average algorithms (EMA, SMA, RMA, HMA, WMA, VWMA), traders can choose their preferred method, adapting the screener for trend, swing, or mean-reversion style. All values are visualized in a single table, creating a true "market dashboard" effect for real-time cross-asset assessment.
Unique Aspects
True cross-asset, cross-timeframe screening in a unified table—rare for Pine Script indicators.
Full flexibility—customizable list of assets, timeframes, and MA parameters to suit any market/trading plan.
Intuitive color-coding and table display eliminates guesswork, enabling “at-a-glance” screening and rapid decision-making.
Efficient, optimized Pine v6 codebase—minimal lag even with 40+ concurrent streams.
How to Use
Add the indicator to your TradingView chart (overlay: off, use a clean chart).
In the settings panel, enter up to 10 symbols (tickers) you want to screen—crypto, stocks, FX, or indices.
Set the 4 timeframes to scan (e.g., 1m, 5m, 15m, 1h), plus your preferred moving average length and type.
Review the results in the pop-up table, where each cell shows "% Distance" from MA for each symbol/timeframe.
Monitor table background/text color for overbought vs. oversold cues.
Customization
Symbol List: Track any asset by typing its TradingView ticker.
Timeframes: Full freedom to select 4 timeframes per scan, from 1min to monthly.
MA Config: Choose period length and MA algorithm (classic or exotic types).
Color Themes: Easily spot signals with dynamic color backgrounds and customizable thresholds.
Conclusion
The MA Distance Screener is a must-have tool for systematic traders, portfolio managers, and retail chartists seeking a true multi-asset edge. With real-time cross-checking against multiple moving averages and timeframes, it empowers faster, more confident decision-making, while reducing chart fatigue and missed setups.
Unlock new insights, catch broad and hidden opportunities, and optimize your market workflow—all in a single TradingView panel.

Daily Price RangeThe indicator is designed to analyze an instrument’s volatility based on daily extremes (High-Low) and to compare the current day’s range with the typical (median) range over a selected period. This helps traders assess how much of the "usual" daily movement has already occurred and how much may still be possible during the trading day.

Distance between EMA 50-100/100-150This script calculates and plots the percentage difference between the 50-period, 100-period, and 150-period Exponential Moving Averages (EMA) on a TradingView chart. The aim is to provide a clear visual representation of the market's momentum by analyzing the distance between key EMAs over time.
Key features of this script:
1. EMA Calculation : The script computes the EMA values for 50, 100, and 150 periods and calculates the percentage difference between EMA 50 and 100, and between EMA 100 and 150.
2. Custom Threshold : Users can adjust a threshold percentage to highlight significant divergences between the EMAs. A default threshold is set to 0.1%.
3. Visual Alerts : When the percentage difference exceeds the threshold, a visual marker appears on the chart:
Green Circles for bullish momentum (positive divergence),
Red Circles for bearish momentum (negative divergence),
Diamonds to indicate the first occurrence of new bullish or bearish signals, allowing users to catch fresh market trends.
4. Dynamic Plotting : The script plots two lines representing the percentage difference for each EMA pair, offering a quick and intuitive way to monitor trends.
Ideal for traders looking to gauge market direction using the relationship between multiple EMAs, this script simplifies analysis by focusing on key moving average interactions.

Swing DistanceHello fellas,
This simple indicator helps to visualize the distance between swings. It consists of two lines, the highest and the lowest line, which show the highest and lowest value of the set lookback, respectively. Additionally, it plots labels with the distance (in %) between the highest and the lowest line when there is a change in either the highest or the lowest value.
Use Case:
This tool helps you get a feel for which trades you might want to take and which timeframe you might want to use.
Side Note: This indicator is not intended to be used as a signal emitter or filter!
Best regards,
simwai

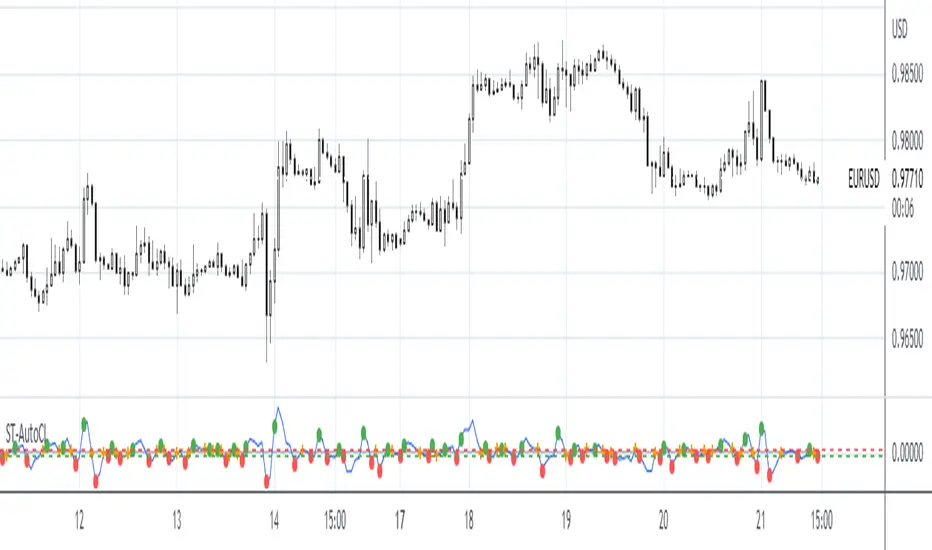
Vwap Z-Score with Signals [UAlgo]The "VWAP Z-Score with Signals " is a technical analysis tool designed to help traders identify potential buy and sell signals based on the Volume Weighted Average Price (VWAP) and its Z-Score. This indicator calculates the VWAP Z-Score to show how far the current price deviates from the VWAP in terms of standard deviations. It highlights overbought and oversold conditions with visual signals, aiding in the identification of potential market reversals. The tool is customizable, allowing users to adjust parameters for their specific trading needs.
🔶 Features
VWAP Z-Score Calculation: Measures the deviation of the current price from the VWAP using standard deviations.
Customizable Parameters: Allows users to set the length of the VWAP Z-Score calculation and define thresholds for overbought and oversold levels.
Reversal Signals: Provides visual signals when the Z-Score crosses the specified thresholds, indicating potential buy or sell opportunities.
🔶 Usage
Extreme Z-Score values (both positive and negative) highlight significant deviations from the VWAP, useful for identifying potential reversal points.
The indicator provides visual signals when the Z-Score crosses predefined thresholds:
A buy signal (🔼) appears when the Z-Score crosses above the lower threshold, suggesting the price may be oversold and a potential upward reversal.
A sell signal (🔽) appears when the Z-Score crosses below the upper threshold, suggesting the price may be overbought and a potential downward reversal.
These signals can help you identify potential entry and exit points in your trading strategy.
🔶 Disclaimer
The "VWAP Z-Score with Signals " indicator is designed for educational purposes and to assist traders in their technical analysis. It does not guarantee profitable trades and should not be considered as financial advice.
Users should conduct their own research and use this indicator in conjunction with other tools and strategies.
Trading involves significant risk, and it is possible to lose more than your initial investment.

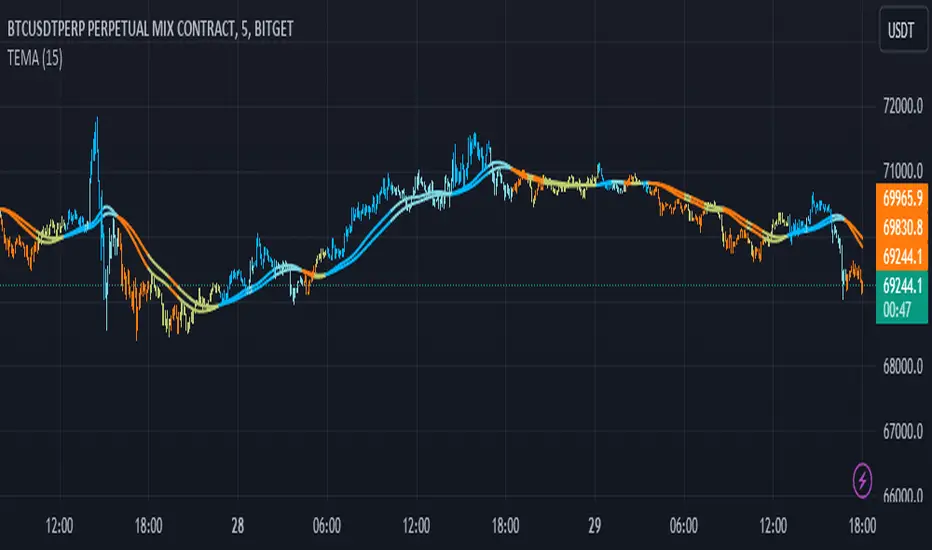
Triple EMA Distance IndicatorTriple EMA Distance Indicator
The Triple EMA Distance indicator comprises two sets of triple exponential moving averages (EMAs). One set uses the same smoothing length for all EMAs, while the other set doubles the length for the last EMA. This indicator provides visual cues based on the relationship between these EMAs and candlestick patterns.
Blue Condition:
Indicates when the fast EMA is above the slow EMA.
The distance between the two EMAs is increasing.
Candlesticks and EMAs are colored light blue.
Orange Condition:
Activates when the fast EMA is below the slow EMA.
The distance between the two EMAs is increasing.
Candlesticks and EMAs are colored orange.
Beige Condition:
Occurs when the fast EMA is below the slow EMA.
The distance between the two EMAs is decreasing.
Candlesticks and EMAs are colored beige.
Light Blue Condition:
Represents when the fast EMA is above the slow EMA.
The distance between the two EMAs is decreasing.
Candlesticks and EMAs are colored light blue.
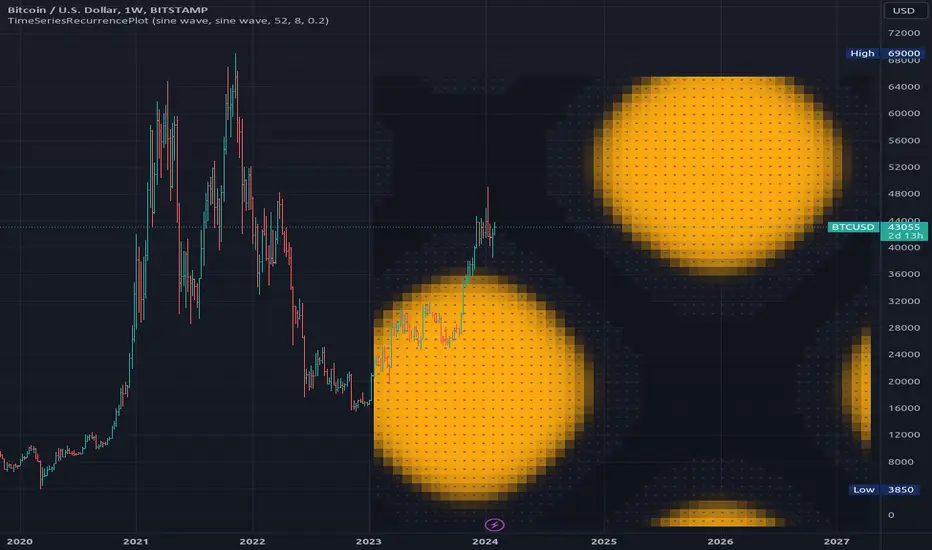
TimeSeriesRecurrencePlotLibrary "TimeSeriesRecurrencePlot"
In descriptive statistics and chaos theory, a recurrence plot (RP) is a plot showing, for each moment i i in time, the times at which the state of a dynamical system returns to the previous state at `i`, i.e., when the phase space trajectory visits roughly the same area in the phase space as at time `j`.
```
A recurrence plot (RP) is a graphical representation used in the analysis of time series data and dynamical systems. It visualizes recurring states or events over time by transforming the original time series into a binary matrix, where each element represents whether two consecutive points are above or below a specified threshold. The resulting Recurrence Plot Matrix reveals patterns, structures, and correlations within the data while providing insights into underlying mechanisms of complex systems.
```
~starling7b
___
Reference:
en.wikipedia.org
github.com
github.com
github.com
github.com
juliadynamics.github.io
distance_matrix(series1, series2, max_freq, norm)
Generate distance matrix between two series.
Parameters:
series1 (float) : Source series 1.
series2 (float) : Source series 2.
max_freq (int) : Maximum frequency to inpect or the size of the generated matrix.
norm (string) : Norm of the distance metric, default=`euclidean`, options=`euclidean`, `manhattan`, `max`.
Returns: Matrix with distance values.
method normalize_distance(M)
Normalizes a matrix within its Min-Max range.
Namespace types: matrix
Parameters:
M (matrix) : Source matrix.
Returns: Normalized matrix.
method threshold(M, threshold)
Updates the matrix with the condition `M(i,j) > threshold ? 1 : 0`.
Namespace types: matrix
Parameters:
M (matrix) : Source matrix.
threshold (float)
Returns: Cross matrix.
rolling_window(a, b, sample_size)
An experimental alternative method to plot a recurrence_plot.
Parameters:
a (array) : Array with data.
b (array) : Array with data.
sample_size (int)
Returns: Recurrence_plot matrix.
SimilarityMeasuresLibrary "SimilarityMeasures"
Similarity measures are statistical methods used to quantify the distance between different data sets
or strings. There are various types of similarity measures, including those that compare:
- data points (SSD, Euclidean, Manhattan, Minkowski, Chebyshev, Correlation, Cosine, Camberra, MAE, MSE, Lorentzian, Intersection, Penrose Shape, Meehl),
- strings (Edit(Levenshtein), Lee, Hamming, Jaro),
- probability distributions (Mahalanobis, Fidelity, Bhattacharyya, Hellinger),
- sets (Kumar Hassebrook, Jaccard, Sorensen, Chi Square).
---
These measures are used in various fields such as data analysis, machine learning, and pattern recognition. They
help to compare and analyze similarities and differences between different data sets or strings, which
can be useful for making predictions, classifications, and decisions.
---
References:
en.wikipedia.org
cran.r-project.org
numerics.mathdotnet.com
github.com
github.com
github.com
Encyclopedia of Distances, doi.org
ssd(p, q)
Sum of squared difference for N dimensions.
Parameters:
p (float ) : `array` Vector with first numeric distribution.
q (float ) : `array` Vector with second numeric distribution.
Returns: Measure of distance that calculates the squared euclidean distance.
euclidean(p, q)
Euclidean distance for N dimensions.
Parameters:
p (float ) : `array` Vector with first numeric distribution.
q (float ) : `array` Vector with second numeric distribution.
Returns: Measure of distance that calculates the straight-line (or Euclidean).
manhattan(p, q)
Manhattan distance for N dimensions.
Parameters:
p (float ) : `array` Vector with first numeric distribution.
q (float ) : `array` Vector with second numeric distribution.
Returns: Measure of absolute differences between both points.
minkowski(p, q, p_value)
Minkowsky Distance for N dimensions.
Parameters:
p (float ) : `array` Vector with first numeric distribution.
q (float ) : `array` Vector with second numeric distribution.
p_value (float) : `float` P value, default=1.0(1: manhatan, 2: euclidean), does not support chebychev.
Returns: Measure of similarity in the normed vector space.
chebyshev(p, q)
Chebyshev distance for N dimensions.
Parameters:
p (float ) : `array` Vector with first numeric distribution.
q (float ) : `array` Vector with second numeric distribution.
Returns: Measure of maximum absolute difference.
correlation(p, q)
Correlation distance for N dimensions.
Parameters:
p (float ) : `array` Vector with first numeric distribution.
q (float ) : `array` Vector with second numeric distribution.
Returns: Measure of maximum absolute difference.
cosine(p, q)
Cosine distance between provided vectors.
Parameters:
p (float ) : `array` 1D Vector.
q (float ) : `array` 1D Vector.
Returns: The Cosine distance between vectors `p` and `q`.
---
angiogenesis.dkfz.de
camberra(p, q)
Camberra distance for N dimensions.
Parameters:
p (float ) : `array` Vector with first numeric distribution.
q (float ) : `array` Vector with second numeric distribution.
Returns: Weighted measure of absolute differences between both points.
mae(p, q)
Mean absolute error is a normalized version of the sum of absolute difference (manhattan).
Parameters:
p (float ) : `array` Vector with first numeric distribution.
q (float ) : `array` Vector with second numeric distribution.
Returns: Mean absolute error of vectors `p` and `q`.
mse(p, q)
Mean squared error is a normalized version of the sum of squared difference.
Parameters:
p (float ) : `array` Vector with first numeric distribution.
q (float ) : `array` Vector with second numeric distribution.
Returns: Mean squared error of vectors `p` and `q`.
lorentzian(p, q)
Lorentzian distance between provided vectors.
Parameters:
p (float ) : `array` Vector with first numeric distribution.
q (float ) : `array` Vector with second numeric distribution.
Returns: Lorentzian distance of vectors `p` and `q`.
---
angiogenesis.dkfz.de
intersection(p, q)
Intersection distance between provided vectors.
Parameters:
p (float ) : `array` Vector with first numeric distribution.
q (float ) : `array` Vector with second numeric distribution.
Returns: Intersection distance of vectors `p` and `q`.
---
angiogenesis.dkfz.de
penrose(p, q)
Penrose Shape distance between provided vectors.
Parameters:
p (float ) : `array` Vector with first numeric distribution.
q (float ) : `array` Vector with second numeric distribution.
Returns: Penrose shape distance of vectors `p` and `q`.
---
angiogenesis.dkfz.de
meehl(p, q)
Meehl distance between provided vectors.
Parameters:
p (float ) : `array` Vector with first numeric distribution.
q (float ) : `array` Vector with second numeric distribution.
Returns: Meehl distance of vectors `p` and `q`.
---
angiogenesis.dkfz.de
edit(x, y)
Edit (aka Levenshtein) distance for indexed strings.
Parameters:
x (int ) : `array` Indexed array.
y (int ) : `array` Indexed array.
Returns: Number of deletions, insertions, or substitutions required to transform source string into target string.
---
generated description:
The Edit distance is a measure of similarity used to compare two strings. It is defined as the minimum number of
operations (insertions, deletions, or substitutions) required to transform one string into another. The operations
are performed on the characters of the strings, and the cost of each operation depends on the specific algorithm
used.
The Edit distance is widely used in various applications such as spell checking, text similarity, and machine
translation. It can also be used for other purposes like finding the closest match between two strings or
identifying the common prefixes or suffixes between them.
---
github.com
www.red-gate.com
planetcalc.com
lee(x, y, dsize)
Distance between two indexed strings of equal length.
Parameters:
x (int ) : `array` Indexed array.
y (int ) : `array` Indexed array.
dsize (int) : `int` Dictionary size.
Returns: Distance between two strings by accounting for dictionary size.
---
www.johndcook.com
hamming(x, y)
Distance between two indexed strings of equal length.
Parameters:
x (int ) : `array` Indexed array.
y (int ) : `array` Indexed array.
Returns: Length of different components on both sequences.
---
en.wikipedia.org
jaro(x, y)
Distance between two indexed strings.
Parameters:
x (int ) : `array` Indexed array.
y (int ) : `array` Indexed array.
Returns: Measure of two strings' similarity: the higher the value, the more similar the strings are.
The score is normalized such that `0` equates to no similarities and `1` is an exact match.
---
rosettacode.org
mahalanobis(p, q, VI)
Mahalanobis distance between two vectors with population inverse covariance matrix.
Parameters:
p (float ) : `array` 1D Vector.
q (float ) : `array` 1D Vector.
VI (matrix) : `matrix` Inverse of the covariance matrix.
Returns: The mahalanobis distance between vectors `p` and `q`.
---
people.revoledu.com
stat.ethz.ch
docs.scipy.org
fidelity(p, q)
Fidelity distance between provided vectors.
Parameters:
p (float ) : `array` 1D Vector.
q (float ) : `array` 1D Vector.
Returns: The Bhattacharyya Coefficient between vectors `p` and `q`.
---
en.wikipedia.org
bhattacharyya(p, q)
Bhattacharyya distance between provided vectors.
Parameters:
p (float ) : `array` 1D Vector.
q (float ) : `array` 1D Vector.
Returns: The Bhattacharyya distance between vectors `p` and `q`.
---
en.wikipedia.org
hellinger(p, q)
Hellinger distance between provided vectors.
Parameters:
p (float ) : `array` 1D Vector.
q (float ) : `array` 1D Vector.
Returns: The hellinger distance between vectors `p` and `q`.
---
en.wikipedia.org
jamesmccaffrey.wordpress.com
kumar_hassebrook(p, q)
Kumar Hassebrook distance between provided vectors.
Parameters:
p (float ) : `array` 1D Vector.
q (float ) : `array` 1D Vector.
Returns: The Kumar Hassebrook distance between vectors `p` and `q`.
---
github.com
jaccard(p, q)
Jaccard distance between provided vectors.
Parameters:
p (float ) : `array` 1D Vector.
q (float ) : `array` 1D Vector.
Returns: The Jaccard distance between vectors `p` and `q`.
---
github.com
sorensen(p, q)
Sorensen distance between provided vectors.
Parameters:
p (float ) : `array` 1D Vector.
q (float ) : `array` 1D Vector.
Returns: The Sorensen distance between vectors `p` and `q`.
---
people.revoledu.com
chi_square(p, q, eps)
Chi Square distance between provided vectors.
Parameters:
p (float ) : `array` 1D Vector.
q (float ) : `array` 1D Vector.
eps (float)
Returns: The Chi Square distance between vectors `p` and `q`.
---
uw.pressbooks.pub
stats.stackexchange.com
www.itl.nist.gov
kulczynsky(p, q, eps)
Kulczynsky distance between provided vectors.
Parameters:
p (float ) : `array` 1D Vector.
q (float ) : `array` 1D Vector.
eps (float)
Returns: The Kulczynsky distance between vectors `p` and `q`.
---
github.com

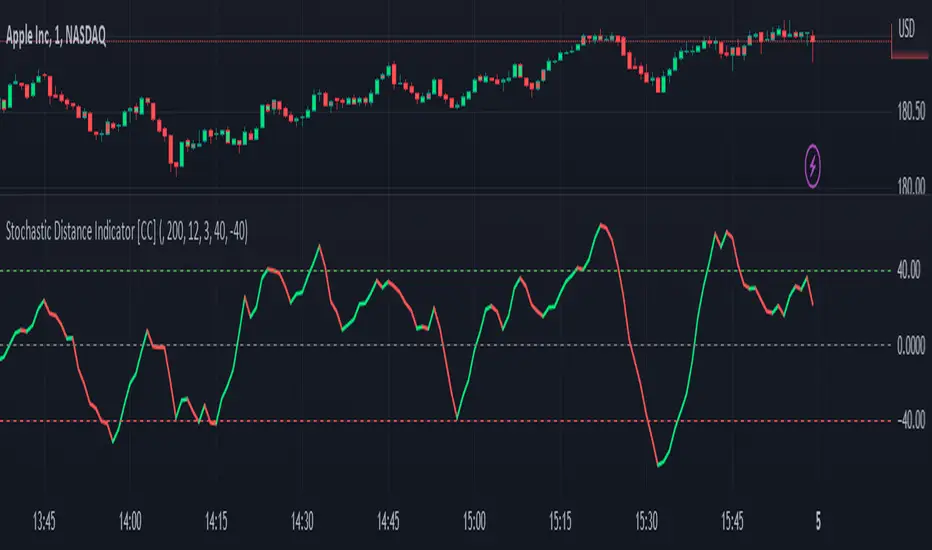
Stochastic Distance Indicator [CC]The Stochastic Distance Indicator was created by Vitali Apirine (Stocks and Commodities Jun 2023 pgs 16-21), and this is a new method that measures the absolute distance between a price and its highest and lowest values over a long period. It uses the stochastic formula to create an oscillator using this distance value and smooths the value. Obviously, there is a lag in signals due to the lookback periods, but it does a good job of staying above the midline when the stock is in a strong uptrend and vice versa. Of course, I'm open to suggestions, but I'm deciding to create buy and sell signals based on comparing the unsmoothed and smoothed values. Buy when the line turns green and sell when it turns red.
Let me know if there are any other indicators you would like to see me publish!
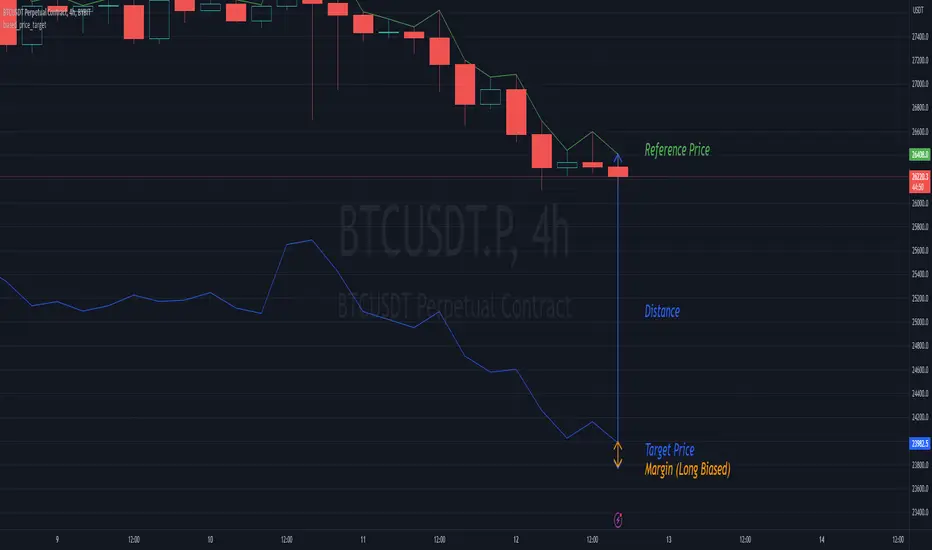
biased_price_targetLibrary "biased_price_target"
Collection of functions that can be used for the calculation of biased price targets like stop loss and
take profit from a reference price using several methods that are already provided by the "distance_ratio" library plus
the 'HHLL'. Methods supported are percentagewise (PERC), atr-based (ATR), fixed profit (PROF), tick-based (TICKS),
risk reward ratio (RR), and highest high/lowest low (HHLL)
distance_ratioLibrary "distance_ratio"
Collection of types and functions that can be used for the calculation of the ratio of a distance
from a barrier price using several methods. Methods supported are percentagewise (PERC), atr-based (ATR), fixed
profit (PROF), tick-based (TICKS), risk reward ratio (RR) and local extrema (LOC).
This library is meant to replace my previously published "distance_percentile" library since it offers a more intuitive interface by using the method syntax.

SpreadTrade - Auto-Cointegration (ps5)Decsription: Auto-Cointegration-Based Pair Trading Strategy (revised version)
To review, there are three popular styles of Pair trading: distance-based pair trading, correlation-based pair trading and cointegration-based pair trading. Typically, they require preliminary statistical estimation of the viability of the corresponding strategy.
Basically a pair trade strategy boils down to shorting the outperforming instrument and going long on the underperforming instrument whenever the temporary correlation weakens which means one instrument is going up and another is going down. Apart from the typical cointegration strategy which employs two cointegrated instruments, this script uses just one instrument, in base timeframe and in lagged timeframe, actually making it an auto-cointegration, or better still, an auto-correlation strategy.
Notice that each moving average function may require different Threshold settings.The orange cross symbol indicates the exit points. To filter out the signals use higher values for the LongWindow and the Threshold parameters. Also pay attention that in some cases with some moving averages the color of the signals has to be inverted.
Astro | Angular Distance | θAstro | Angular Distance | θ
Also known as Angular Separation , Apparent Distance , or Apparent Separation is the angle between the two sightlines, or between two point objects as viewed from an observer, in our case we can use it as Geocentric/Heliocentric prospective calculated from a combination of some trigonometry functions
We can use it to calculate the Angular Distance between two planets.
How to use it:
- 1st Ascension : The Right Ascension of the first object expressed in degrees.
- 1st Declination : The Declination of the first object expressed in degrees.
- 2nd Ascension : The Right Ascension of the second object expressed in degrees.
- 2nd Declination : The Declination of the second object expressed in degrees.
The result ll'be returned near the table "Angulare Distance" and all the values entered will be plotted on the table in top-right position of the screen.

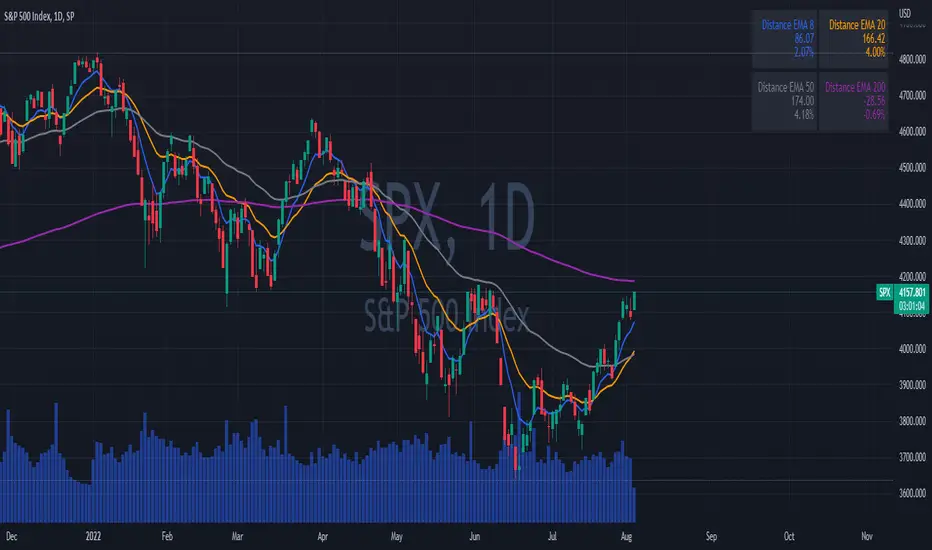
EMAs DistancesThis indicator shows 4 configurable EMAs and the distances (values and percentages) to the last price of the stock, etf or index.
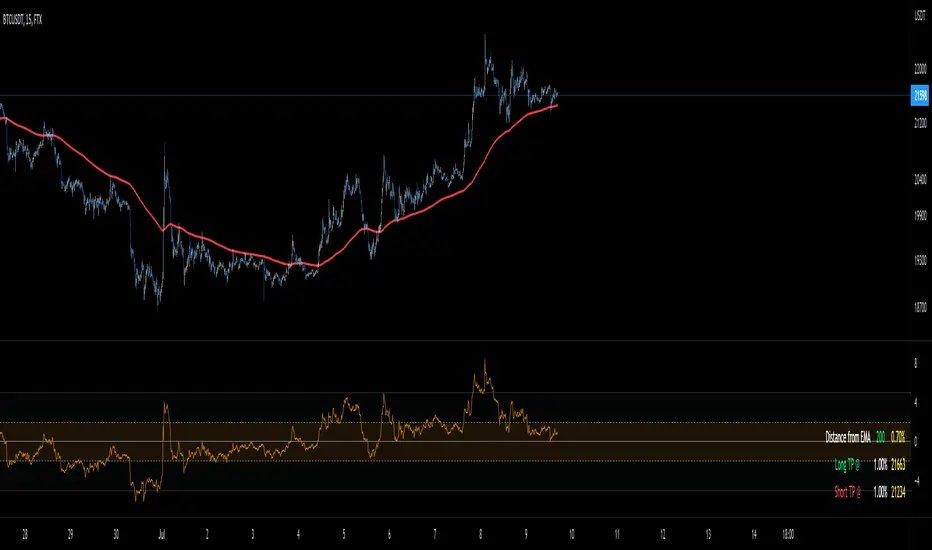
Distance From EMA (%) with TP TableThe indicator will help you to identify where an asset might change direction or where to take profit.
For scalping or day trading is very useful to know where to take profits.
When the price is too far from an EMA a reversal is very likely to occur.
You can set up your own EMA and the percentage where you want to take profits
Distance From Moving AverageThis indicator shows the distance between the current price and the Moving Average price.
Key Features:
Show the distance between price and Moving Average (Read Distance Calculation for more information)
Show Historic Highs and Lows
Show Highest High and Lowest Low
Show current Highest High, current Lowest Low and current distance
Key Indicator Settings:
1. Distance Calculation
There are two ways to calculate the distance:
Spread - Calculate the difference between the price and the moving average
Percentage - Calculate the percentage change between the price and the moving average
2. Moving Average Types
There are 5 different Moving Averages:
EMA
SMA
WMA
VWMA
HMA
3. Highest High and Lowest Low
You can show or hide the Highest High and the Lowest Low plots of the series
4. Historic Highs and Lows
You can show or hide past Highs and Lows of the series
Lookback Length - Let's you adjust the frequency of local highs and lows of the series
5. Current Values
You can show or hide current value labels

EMA Price Distance TrackerThis simple indicator tracks the distance that the price is from a moving average. This can be helpful when looking for reversals based on historical informaiton.

Distance to 200 SMAThis indicator shows the relative distance (in %) from the closing price to the 200 SMA.

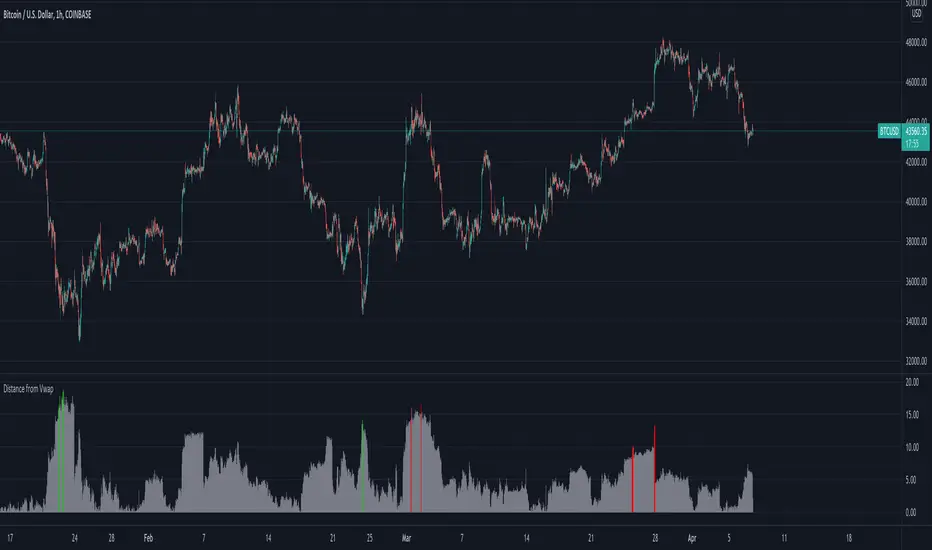
Distance from Vwap// How it Works \\
Measuring the distance of the close price from a higher timeframe VWAP - Volume Weighted Average Price
There is a threshold which is calculated by looking back at the previous x amount of bars and storing the highest/lowest values
If the distance from the vwap stretches above that threshold, the histogram will go green if price is above VWAP and red if its below the vwap
If the distance from the vwap reaches below the low threshold you will see the histogram flashes orange
// Settings \\
In the settings you have the ability to change what timeframe the indicator is calculated on, as well as this you can change the timeframe the VWAP is calculated on.
I always recommend using a higher timeframe vwap as they tend to me more respected
e.g on the hourly timeframe, I use the weekly VWAP, on 1 minute timeframe you may want to use 4 hour timeframe but obviously feel free to experiment
// Use Case \\
When histogram is flashing green, prices is pulling far away from the vwap, obviously you don't want to be buying a falling knife but if you have levels of confluence this can help spot reversals.
I personally wait until the first candle after its been green to get confirmation of the fall weakening. Vica versa for reds and shorts/sells.
When you see orange flashes, this shows that price has been consolidating and the price is very close to the higher time frame VWAP which could be considered a safe entry point as they tend to lead to a big move to follow
// Suggestions \\
Happy for anyone to make any suggestions on changes which could improve the script,
// Terms \\
Feel free to use the script, If you do use the script could you please just tag me as I am interested to see how people are using it. Good Luck!
High-pass filterHigh-pass filter | Pine Utilities series, ready to be used in "study-on-study" fashion |
Represents the difference between the filter and the original unfiltered data.
How to use:
1) Add a filter to your chart (in this particular case it was 4-pole Gaussian filter implemented by @everget, ty man);
2) Tap ... on your's filter status line and choose "Add study/strategy on ...", then choose High-pass filter. Alternatively, add high-pass filter directly to your chart, then High-pass filter's settings -> Basis -> choose the filter you've applied during the step 1;
3) Choose the source (op2 and hlcc4 are available as well);
4) See the difference (literally).
Peace TV

FunctionMinkowskiDistanceLibrary "FunctionMinkowskiDistance"
Method for Minkowski Distance,
The Minkowski distance or Minkowski metric is a metric in a normed vector space
which can be considered as a generalization of both the Euclidean distance and
the Manhattan distance.
It is named after the German mathematician Hermann Minkowski.
reference: en.wikipedia.org
double(point_ax, point_ay, point_bx, point_by, p_value) Minkowsky Distance for single points.
Parameters:
point_ax : float, x value of point a.
point_ay : float, y value of point a.
point_bx : float, x value of point b.
point_by : float, y value of point b.
p_value : float, p value, default=1.0(1: manhatan, 2: euclidean), does not support chebychev.
Returns: float
ndim(point_x, point_y, p_value) Minkowsky Distance for N dimensions.
Parameters:
point_x : float array, point x dimension attributes.
point_y : float array, point y dimension attributes.
p_value : float, p value, default=1.0(1: manhatan, 2: euclidean), does not support chebychev.
Returns: float
