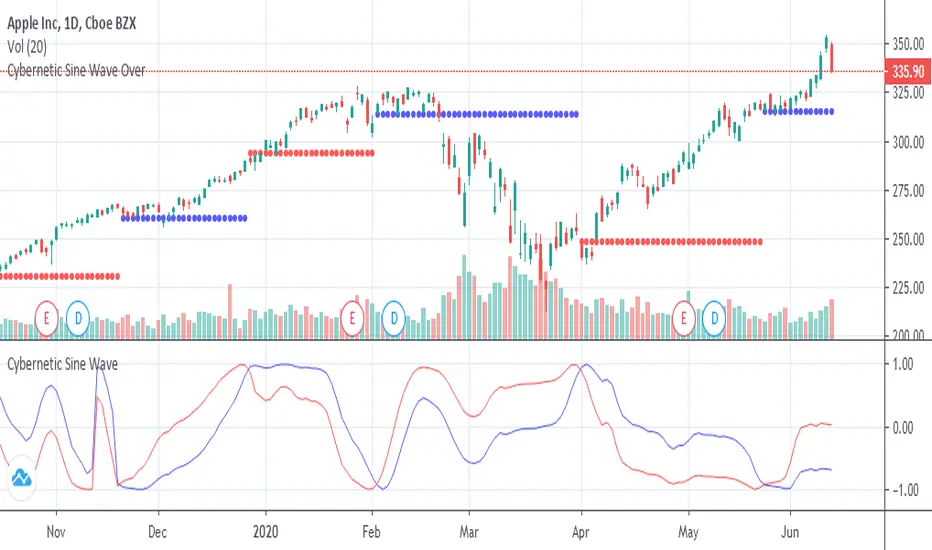
Cybernetic Sine Wave OverOverlay on chart of the support and resistance lines of the "Cybernetic Sine Wave"Pine Script® インジケーターsal157011の投稿33139
Cybernetic Sine WaveThis is John F. Ehlers "Sine Wave Indicator" on the book "Cybernetic Analysis for Stocks and Futures". When red crosses under blue there is a resistance and the price should fall and when red crosses over blue there is a support and the price should rise, but, the market is always right, if instead of turning down on the resistance it surpasses it there is a trend up, if instead of turning up on the the support it falls through it there is a trend down. Pine Script® インジケーターsal157011の投稿77121
[STRATEGY] Moving Average CrossoverHello friends, This is a comprehensive backtesting engine for Moving Average crossover strategies, supporting over 63 types of moving averages and filters. It allows you to test, compare, and optimize crossover behaviors between any two moving averages with flexible profit and risk management tools. Built upon the Moving Average Crossover foundation, this advanced version lets you manually backtest more than 4096 combinations of moving average types. When combined with customizable periods, take-profits, and stop-loss levels, the total number of possible configurations becomes virtually unlimited. 🛠 How It Works The system tests crossovers between two selected moving averages, with full control over their types, lengths, and trading direction. Integrated bracket settings enable dynamic take-profit, stop-loss, and trailing-stop management using units such as % , ATR , points , pips , or ticks . You can restrict backtesting to a custom date range for focused performance evaluation or run it across the instrument’s full history. 🔥 Key Features Supports 63+ moving average and filter types — including algorithms by Ehlers , Jurik , Kaufman , Apirine , Tillson , and Dürschner Customizable MA types, periods, and strategy direction Full-featured bracket control: TP, SL, and TSL in ATR, %, points, pips, or ticks Backtest window customization (start, end, or range) Direction filter: Longs only, Shorts only, or Both Dynamic trade labeling and color-coded visualization Option to exit only at TP, SL, or TSL If you'd like access or have any questions, feel free to reach out to me directly via DM. 👋 Good luck and happy trading!Pine Script® ストラテジー有料スクリプトevergetの投稿385385 1.1 K
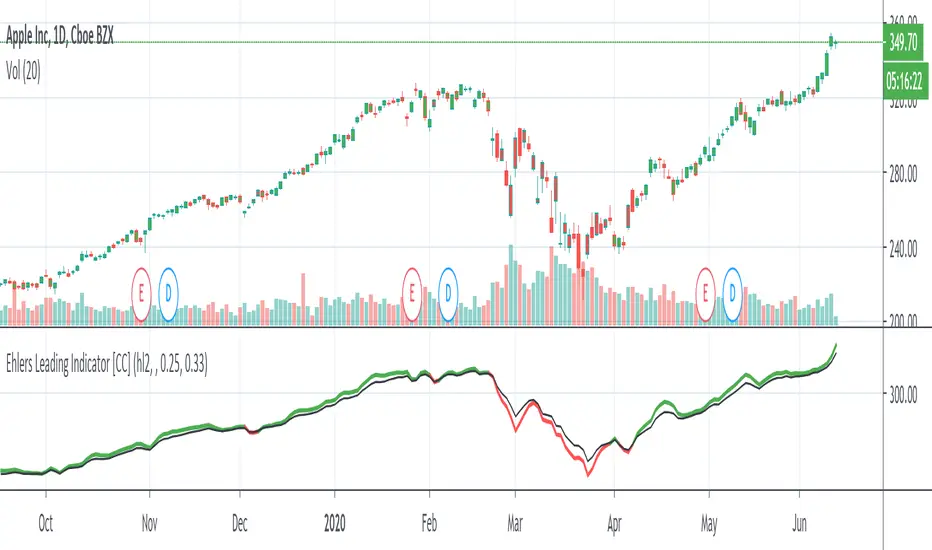
Ehlers Leading Indicator [CC]The Leading Indicator was created by John Ehlers (Cybernetic Analysis For Stocks And Futures pg 235) and as the name implies, this is a leading indicator that provides super early signals. Feel free to change the alpha values to adjust to your needs. Buy when the indicator line is green and sell when it is red. Let me know if there are other scripts you would like to see me publish or if you want something custom done!Pine Script® インジケーターcheatcountryの投稿1010 1.1 K
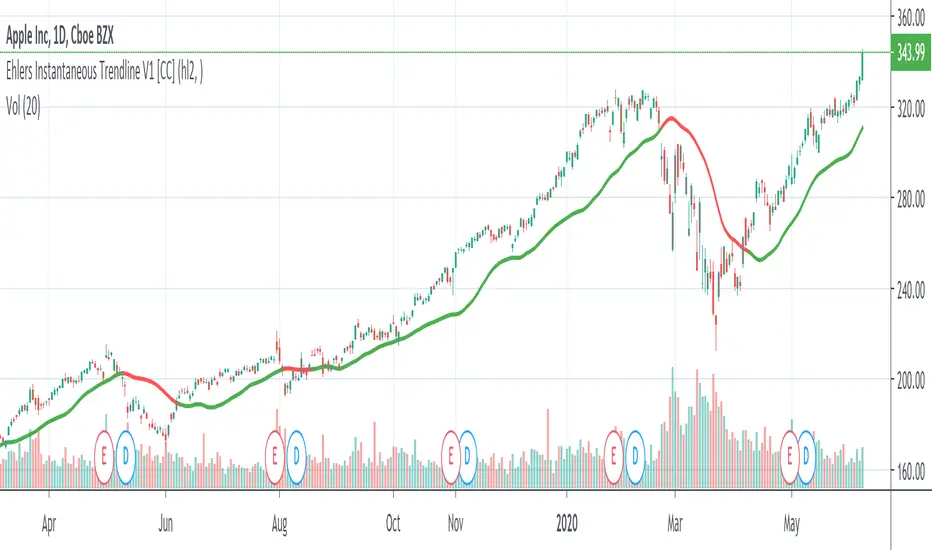
Ehlers Instantaneous Trendline V1 [CC]The Instantaneous Trendline was created by John Ehlers (Rocket Science For Traders pgs 109-110) and this indicator is perfect for determining the medium to long term trend. Buy when the indicator line is green and sell when it is red. I will be introducing a different version of this indicator which is perfect for short term trends so these will pair great together. Let me know if there are other scripts you would like to see me publish or if you want something custom done!Pine Script® インジケーターcheatcountryの投稿1313 1.3 K
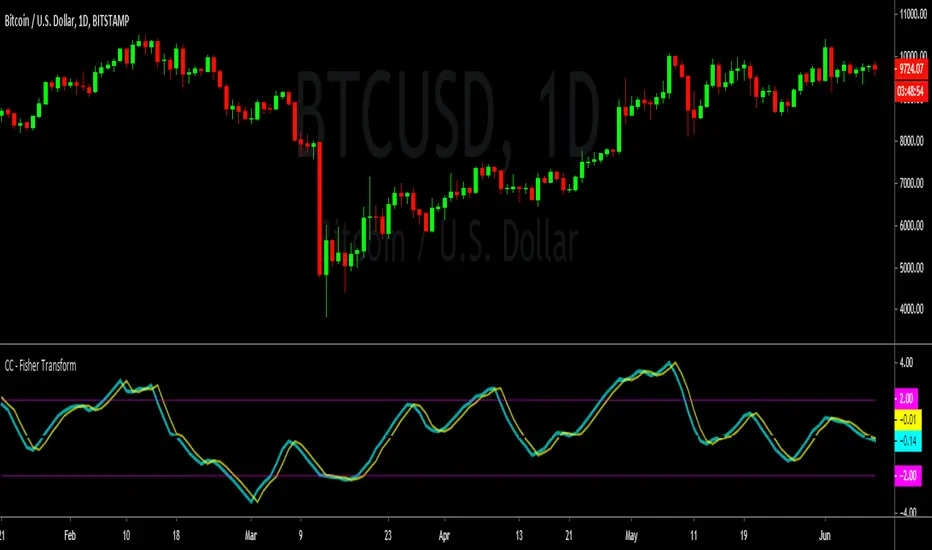
Cracking Cryptocurrency - Fisher TransformCracking Cryptocurrency - Fisher Transform A modern spin on a classic. John Ehler's formulas helped transform a generation of traders from working with traditional indicators such as Stochastic and moving average filters to applying frequency and wave theory to their price chart analysis. There are few tools as powerful as Ehler's Fisher Transform , which transforms the behavior of price in a Gaussian Distribution, or a Normal Probability Distribution. This allows us to attain a bell curve of price, with our outliers clearly and objectively identifiable as well as accurately indicate trend direction by bisecting our wave into peaks and troughs. Features & Functions Simple and Clean. Only the data you want, no unnecessary information cluttering your work flow. Adjustable Sources. Select which data source you want to compile your data from from an easy drop-down menu. Adjustable Triggers. Standard versions of the Fisher have been unable to innovate on the Trigger Line, a vital part of utilizing this to generate trade signals and setups. In this version, choose and adjust your own Trigger and Smoothing Filter based on tried and true implementations. Adjustable Thresholds. Most versions of the Fisher do not truly allow the customization of the algorithm to suit the asset you are analyzing. All thresholds in this version are fully adjustable to customize this indicator to work for you, not against you. --- Purpose To remain true to Ehler's original vision of the Fisher Transform while providing traders a functional and efficient indicator with modern innovations and conveniences.Pine Script® インジケーターCrackingCryptocurrencyの投稿66111
Ehlers Decycler Oscillator [CC]The Decycler Oscillator was created by John Ehlers (Cycle Analytics For Traders pgs 43-44) and it is used to show transitions between uptrends and downtrends. If it rises above the 0 line then this means it has transitioned to an uptrend and it falls below the 0 line then it is in a downtrend. Buy if the indicator line is green and sell when it is red. This was a custom request so let me know if you would like to see more scripts from me or if you want something custom done!Pine Script® インジケーターcheatcountryの投稿更新済 2295
Ehlers Signal To Noise Ratio [CC]The Signal To Noise Ratio was created by John Ehlers (Rocket Science For Traders pgs 81-82) and this indicator is perfect for all of the scalpers out there! This will let you know when the stock is at a high volatility or not and when to buy or sell. If the indicator crosses over the dotted line then that means the stock is volatile and it is trading flat then it will be below the dotted line. Buy when the indicator line is green and sell when it is red. This was a custom request so let me know if there are any other scripts you would like me to publish or if you want something custom done!Pine Script® インジケーターcheatcountryの投稿11120
Ehlers Decycler [CC]The Decycler was created by John Ehlers (Cycle Analytics For Traders pgs 40-41) and this is a moving average that has an extremely low lag even though it uses a fairly high length to calculate everything. This can also work well as a trendline. Buy when the indicator line is green and sell when it is red. Let me know if there are other scripts you would like to see me publish or if you want something custom done!Pine Script® インジケーターcheatcountryの投稿更新済 33150
Ehlers HighPass-LowPass Roofing Filter [CC]The HighPass-LowPass Roofing Filter was created by John Ehlers (Cycle Analytics For Traders pg78) and this is a variation of a roofing filter that will let you know which direction the stock is trending. If it falls below 0 then the stock is in a downtrend and if it rises above 0 then it is an uptrend. Buy when the indicator line is green and sell when it is red. Let me know if there are other scripts you would like me to publish or if you want something custom done!Pine Script® インジケーターcheatcountryの投稿1010135
Ehlers Hilbert Oscillator [CC]The Hilbert Oscillator was created by John Ehlers (Rocket Science For Traders pgs 90-91) and just like the sinewave indicator that I published yesterday, this is also a leading indicator. The big difference between this indicator and the sinewave is that this indicator works very well for determining major turning points in the stock before they happen. You will notice that when the blue line crosses over the red line that a few bars from that point, the stock will start an uptrend and the reverse is true. I have also included immediate buy and sell signals over the 0 line so buy when the line is green and sell when it is red Let me know if you would like to see any other scripts from me or if you want something custom done!Pine Script® インジケーターcheatcountryの投稿更新済 88235
Ehlers Sinewave Indicator [CC]The Sinewave Indicator was created by John Ehlers (Rocket Science For Traders pgs 97-99) and this is a few indicators in one. Simply put it is a leading indicator which you don't see too many of those these days. If the blue line crosses over the red line then within the next few bars the price will start an uptrend and if the blue line crosses below the red line then in the next few bars it will start a downtrend. I have also included an immediate buy and sell signal on the 0 line which is green when you should buy and red when you should sell. Let me know if you would like to see any other scripts or if you want something custom done!Pine Script® インジケーターcheatcountryの投稿更新済 1717442
Ehlers Even Better Sinewave Indicator [CC]The Even Better Sinewave Indicator was created by John Ehlers (Cycle Analytics For Traders pgs 161-162) and this indicator works well when the stock is in a trend mode. It will let you know how long to stay with a trade and it works best with a trend confirmation but it can also work on it's own fairly well. Buy when the indicator line is green and sell when it is red. Let me know if there are other scripts you would like me to do or if you want something custom done!Pine Script® インジケーターcheatcountryの投稿66595
Ehlers Fisher Stochastic Center Of Gravity [CC]The Fisher Stochastic Center Of Gravity Indicator was created by John Ehlers (Cybernetic Analysis For Stocks And Futures pg 95) and this is a combo cycle indicator mixed with a stochastic indicator. The idea is to capture the beginning of the cycle and ride it until the end. Buy when the indicator line is green and sell when it turns red. This was a custom request so let me know if you would like to see me publish any other scripts or if you want something custom done!Pine Script® インジケーターcheatcountryの投稿55165
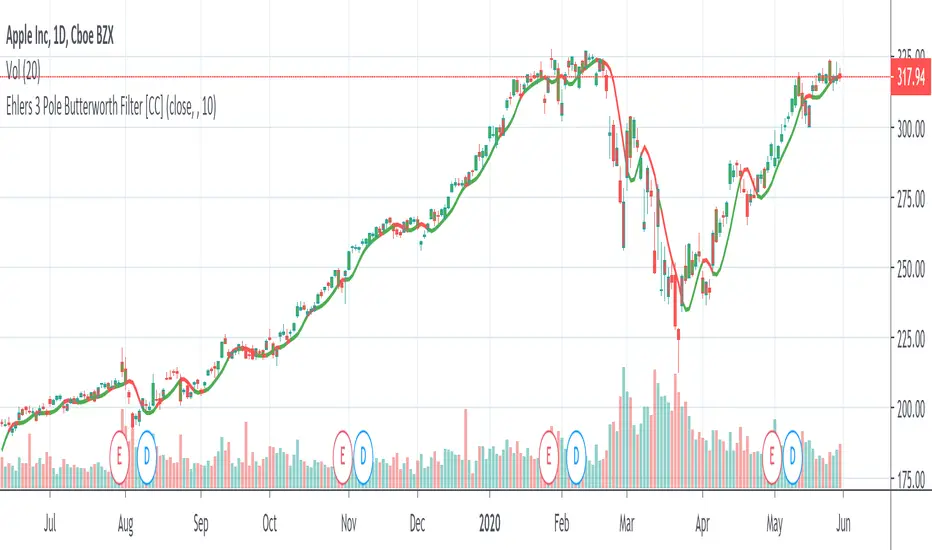
Ehlers 3 Pole Butterworth Filter [CC]The 3 Pole Butterworth Filter was created by John Ehlers (Cycle Analytics For Traders pg 32) and this is a nice filter that follows the price very closely. Buy when the indicator is green and sell when it turns red. This was a custom request so let me know if you would like me to publish any other scripts or if you want something custom done!Pine Script® インジケーターcheatcountryの投稿更新済 111181
Ehlers Fisher Transform Indicator [CC]The Fisher Transform Indicator was created by John Ehlers and the beauty of this indicator is that it provides sharp and clear turning points that are also very early. Buy when the indicator line is green and sell when it is red. This was a special request so let me know if you would like me to publish other scripts or if you want something custom done!Pine Script® インジケーターcheatcountryの投稿更新済 1818549
Ehlers Market State Indicator [CC]The Market State Indicator was created by John Ehlers (Stocks & Commodities V. 38:06 (8–15)) and this is technically part of three indicators in one so I'm splitting each one to a separate script. This particular indicator was designed for the market state which acts as a trend direction and tells you whether the trend is strong in either direction. Keep in mind that when the indicator rapidly switches then the market is choppy and when it is a steady line then it is a very strong trend. Essentially buy when the indicator line is green and sell when it is red. Let me know if you would like me to publish other scripts or if you want something custom done! Note: I'm republishing this because the original script couldn't be found in searches so this will fix that.Pine Script® インジケーターcheatcountryの投稿更新済 204
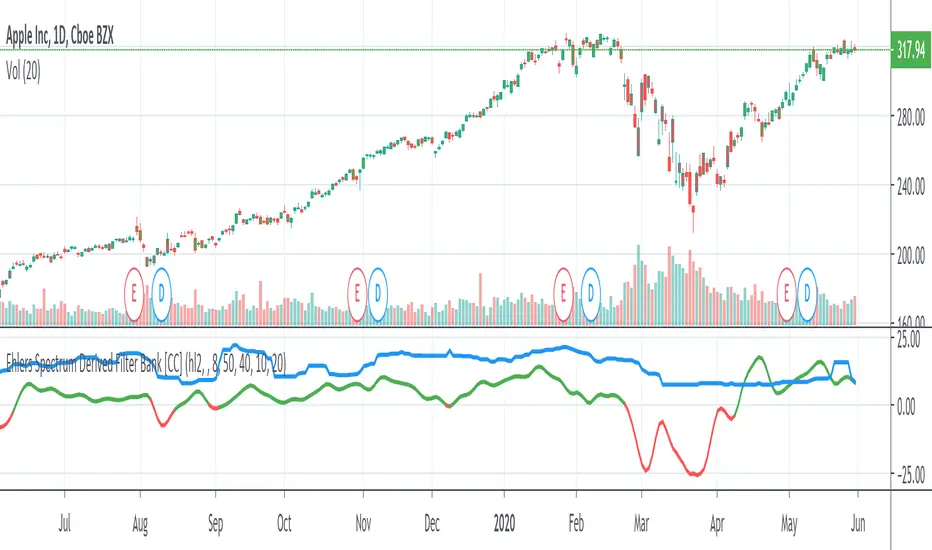
Ehlers Spectrum Derived Filter Bank [CC]The Spectrum Derived Filter Bank was created by John Ehlers (Stocks & Commodities V. 26:3 (16-22)) and this is technically two indicators in one. This will let you know the current cycle period which is in blue and the other indicator will let you know if you should buy the stock or not. Buy when it is green and sell when it is red. Let me know if you would like me to publish other scripts or if you want something custom done! Note: I'm republishing this because the original script couldn't be found in searches so this will fix that.Pine Script® インジケーターcheatcountryの投稿更新済 44114
Ehlers Dominant Cycle Tuned Bypass Filter [CC]The Dominant Cycle Tuned Bypass Filter was created by John Ehlers (Stocks & Commodities V. 26:3 (16-22)) and this is a particularly unique indicator because this does a pretty good job at predicting the future stock movements. If the blue line crosses over the red then a few bars from now the stock price will most likely go up and if the blue line crosses below the red then a few bars from now the stock price should go down. Since this is such a unique indicator to use with entry and exit points, I don't have them color coded but try this out and let me know what you think. This was a special request so let me know what other scripts you would like to see me publish or if you want anything custom done! Note: I'm republishing this because the original script couldn't be found in searches so this will fix that.Pine Script® インジケーターcheatcountryの投稿更新済 95
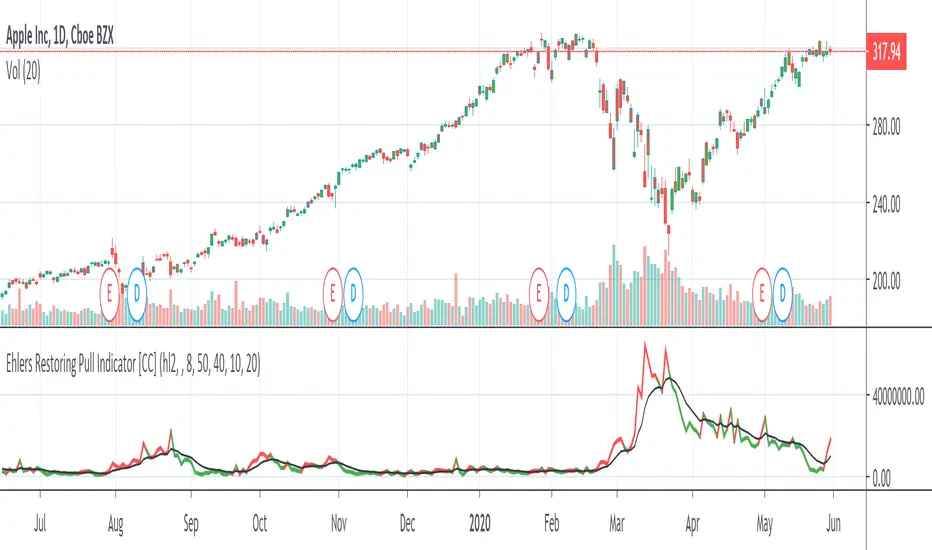
Ehlers Restoring Pull Indicator [CC]The Restoring Pull Indicator was created by John Ehlers (Stocks & Commodities V.11:10 (395-400)) and this was one of his earliest indicators that functions as a momentum indicator . Buy when the indicator line is green and sell when it is red. Let me know if you would like to see me publish more scripts or if you want something custom done! Note: I'm republishing this because the original script couldn't be found in searches so this will fix that.Pine Script® インジケーターcheatcountryの投稿更新済 1176
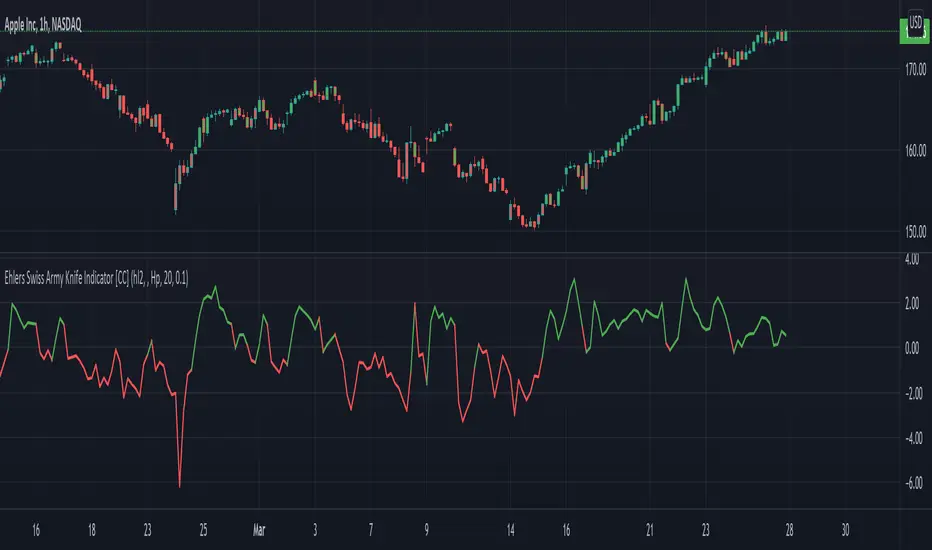
Ehlers Swiss Army Knife Indicator [CC]The Swiss Army Knife Indicator was created by John Ehlers (Stocks & Commodities V. 24:1 (28-31, 50-53)) and it is 9 different filters in one big mega indicator! This is my first attempt at allowing you all to select different timeframes, to choose if you allow repainting or not, or by letting you choose which indicator you want to see on the chart. I know this may cause problems so feel free to send me a pm if you are stuck or if you have any questions! This was a custom request so please let me know if you want to see me publish any other scripts or if you want something custom done! Note: I'm republishing this because the original script couldn't be found in searches so this will fix that.Pine Script® インジケーターcheatcountryの投稿更新済 22112
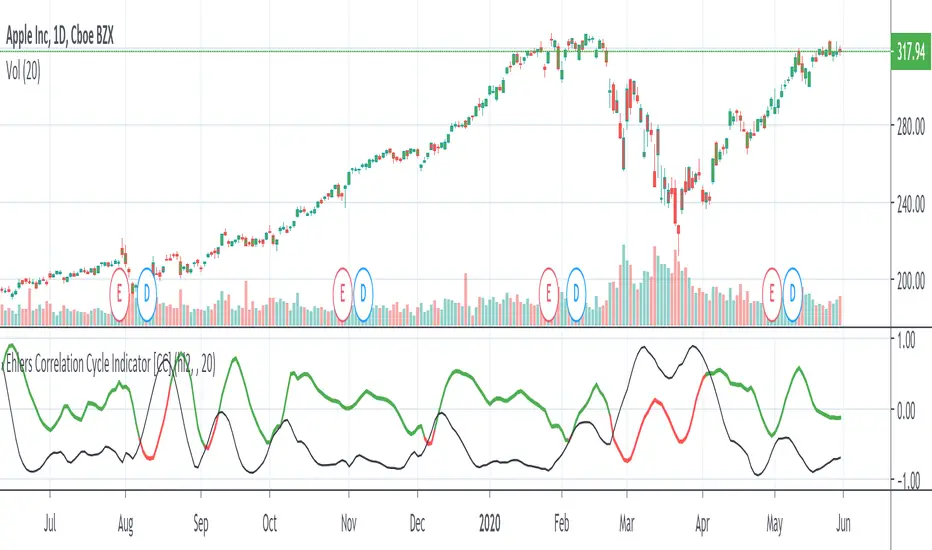
Ehlers Correlation Cycle IndicatorThe Correlation Cycle Indicator was created by John Ehlers (Stocks & Commodities V. 38:06 (8–15)) and this is technically part of three indicators in one so I'm splitting each one to a separate script. This particular indicator was designed for trend direction and trend strength and simply buy when it is green and sell when it turns red. Also keep in mind that the higher the indicator is above the signal then the stronger the trend and when they are close together, conditions get choppy. Let me know if you would like to see me publish other scripts or if you want something custom done!Pine Script® インジケーターcheatcountryの投稿更新済 88289
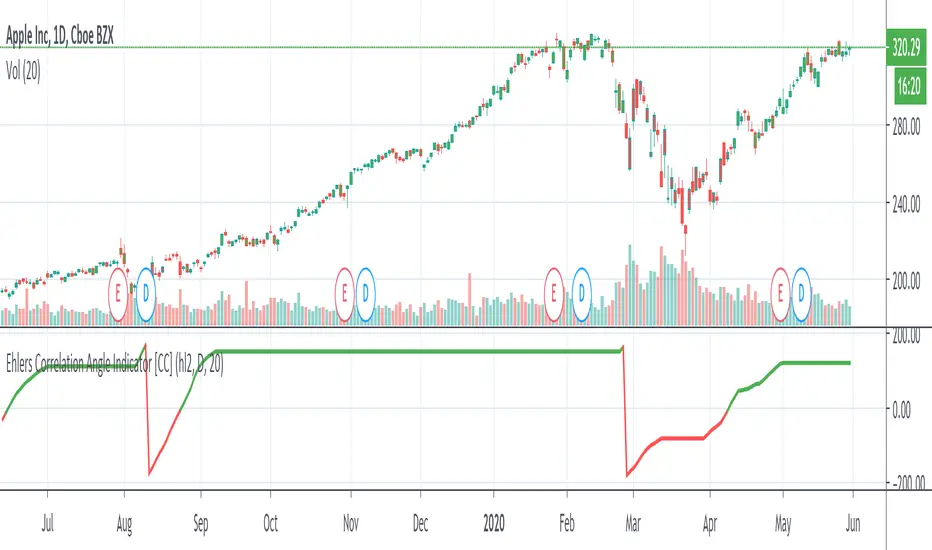
Ehlers Correlation Angle IndicatorThe Correlation Angle Indicator was created by John Ehlers (Stocks & Commodities V. 38:06 (8–15)) and this is technically three indicators in one so I'm splitting each one to a separate script. This particular indicator was designed for trend termination and simply buy when it is green and sell when it turns red. Let me know if you would like to see me publish other scripts or if you want something custom done!Pine Script® インジケーターcheatcountryの投稿更新済 33719