Pine Script® インジケーター
包み足

Ultimate Pullback IndicatorWhat is the Ultimate Pullback Indicator?
This indicator detects pullback trading opportunities by analyzing price action in a very specific manner.
By combining simple trend filters with various advanced candlestick patterns it detects high-probability trend-continuation setups (and optional exits).
If you use this script to set alerts then you will never miss a pullback trading opportunity ever again!
I personally use this indicator to profitably trade pullback signals in the forex markets on multiple timeframes, from the 15-Minute chart to the 4-Hour and Daily chart.
For more information visit my website: The Ultimate Pullback Indicator .
How Do I Access It?
I currently use this script to trade live money in the forex markets, but I’m also constantly testing and improving it. Therefore this is a constant work-in-progress and I’m always taking meticulous care to make it better.
That’s why this is a premium script that requires payment to access. The other advantage of charging for it is that it retains exclusivity to only a select few dedicated traders.
You can access the script by purchasing a monthly subscription on my website .
If you don’t want to pay for this script then I completely understand and I have plenty of other free scripts that you might be interested in!
Free Trial
I’m a trader myself and so I know how skeptical you might be that this indicator is worth your time and money.
That’s why I am offering a free 14 day trial of the indicator. All you need to do to initiate your trial is Join My Mailing List!
How It Works
When price is above the 50-EMA the script will wait for a pullback of at least two red candles. Once that condition is met, it begins searching for advanced entry patterns.
The opposite is true for short trades – price must be below the 50-EMA and must pull back by at least two green candles before it will begin searching for entry reasons.
Once it detects a valid entry reason it will draw a green arrow (for longs) or a red arrow (for shorts) as well as your stop loss and target price (the red and green lines).
But these settings can be customized however you like. You can change the EMA to any period you want, you can adjust your stop loss distance, you can enable or disable the entry and exit reasons as you wish, and you can adjust the rules for some of the patterns.
For a full list of features and visual examples visit the indicator page on my website: The Ultimate Pullback Indicator .
Pine Script® インジケーター

Engulfing Scanner v1This indicator helps you to quickly identify bullish and bearish engulfing patterns.
Works on currencies only (pips required).
Pine Script® インジケーター

Engulfing Pattern Hello Traders,
Sharing one of my favorite candlestick pattern with everyone. Feel free to use it.
Regards,
Intraday Guruji
Pine Script® インジケーター

Pine Script® インジケーター

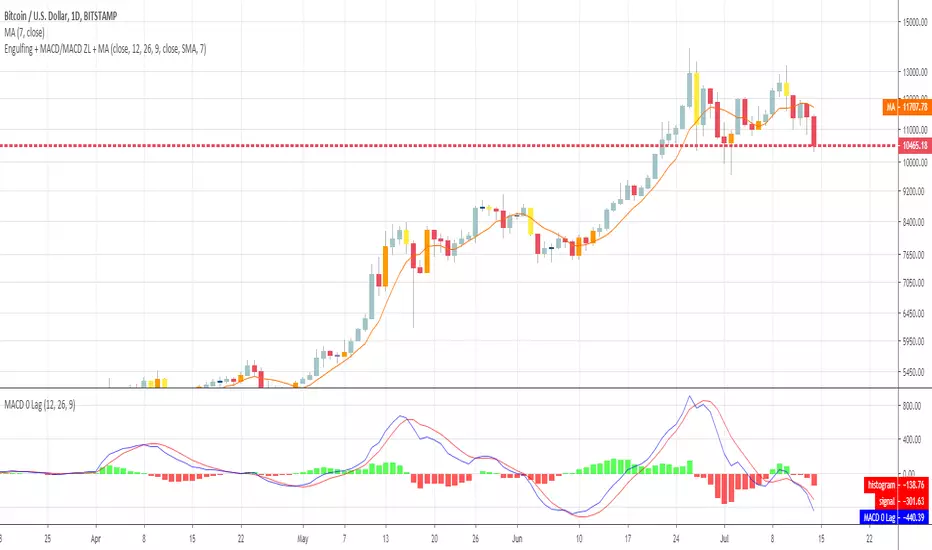
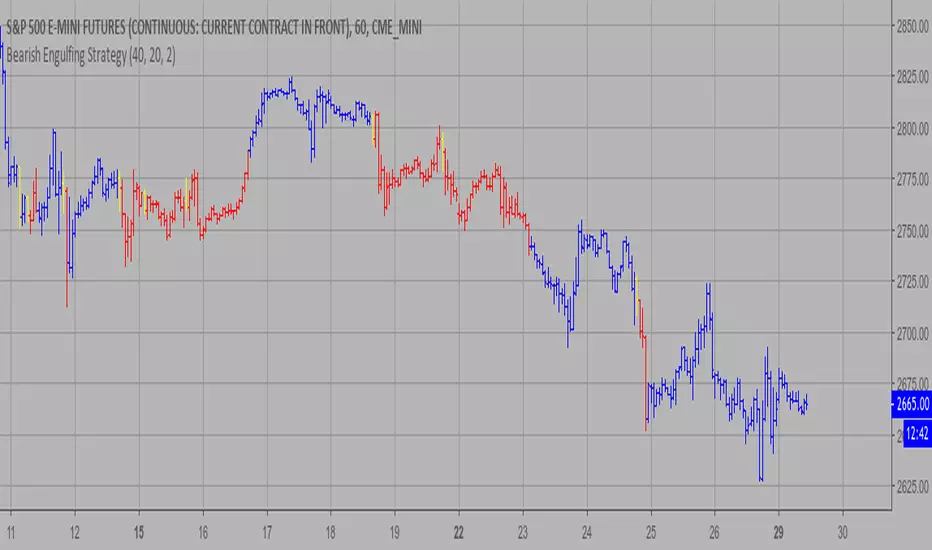
Engulfing + MACD/MACD ZL + MAHi everyone
This is a simple algorithm that I used on timeframe > m30 to detect strong reversal signals based on :
- Engulfing pattern
- MACD ZL 12, 26, 9
- Price vs SMA 7
Last two parameters are optional but gives more security. Otherwise, waiting for confirmation gives later entry.
Up to you to find the right balance between too much security (and taking the trade too late) and not enough confirmation (taking the trade too early and it will go the opposite way)
I recommend the novice traders (less than 2 years trading), to stick with the 3 parameters above .
It's to be used after a strong moment and as we're talking about reversals, I mean trade against the current trend.
Meaning they're more risky, so... you know the drill :) :
- Tight SL
- Protect the position quickly when going in the way you want
- Don't aim for very high TP. Have a few laddered obviously in any case
- Use a trailing stop to protect your gains
Hope you'll like it
Enjoy
Dave
Pine Script® インジケーター
Engulfing Candles DetectorHello traders
Credit to HPotter for that script
I took his script and added alerts to it. 2 lines lol
But anyway, useful to detect reversals by coloring bullish/bearish engulfing candles :)
Enjoy
David
Pine Script® インジケーター

S&R Zone SignalsThis indicator allows you to specify price zones in which to detect basic candlestick patterns.
In the example above, I have specified the most immediate support and resistance zones on GBP/USD and set the script to detect engulfing candles. If a bearish engulfing candle occurs within the resistance zone a signal will be generated; likewise for bullish engulfing candles within the support zone .
The purpose of this indicator is to generate trading alerts when these patterns occur in order to reduce the screen-time required to monitor setups. This indicator is intended for structure traders primarily, although it could be used by anyone who uses zones and candlestick patterns to enter trades.
If you leave either zone set to 0 then that zone will not be used, meaning that you can use this to detect both support and resistance signals, or only signals at support, or only signals at resistance.
Settings:
R1: First Resistance Price
R2: Second Resistance Price
S1: First Support Price
S2: Second Support Price
Draw Signals: Enable/Disable Visual Signals
How Far To Look Back: Used For Detecting Fractal Highs/Lows
Doji Size (in pips): This Changes the Size of Detected Doji Candles
Hammer Wick Size: This Changes the Size of Detected Hammers/Shooting Stars
Engulf Wick: If Enabled, Only Engulfing Candles That Engulf the Wick Will Be Valid
Show Engulfing Candles: Enable/Disable Visual Signals For Engulfing Candles
Show Doji Candles: Enable/Disable Visual Signals For Doji Candles
Show Hammer Candles: Enable/Disable Visual Signals For Hammer/Shooting Star Candles
Source Code:
Go to zenandtheartoftrading.com for the source code – it’s free!
Pine Script® インジケーター

Bearish&Bullish Engulfing (created by LucaBono)Questo indicatore (o price action pattern) stampa sul grafico delle frecce o barre colorate (modificabili dalle impostazioni) quando si verificano entrambi i segnali del Bearish e Bullish Engulfing ufficiali, ovvero quando il corpo della candela è più ampio dell'intera candela precedente.
Il segnale LONG si effettua quando il massimo della Bullish bar viene rotto dalla candela successiva.
Il segnale SHORT viceversa si effettua alla rottura del minimo.
E' più facile trovare questo tipo di segnali su timefrime giornaliero e mercati come azioni, futures e titoli che non stanno aperti 24h.
Consiglio sempre di accompagnare questi segnali ad altri tipi di segnali o analisi per maggiorare le probabilità di successo e di tenuta del trade.
This indicator (or price action pattern) prints on the graph arrows or colored bars (which can be changed from the settings) when both official Bearish and Bullish Engulfing signals occur, ie when the body of the candle is wider than the entire previous candle.
The LONG signal is made when the maximum of the Bullish bar is broken by the next candle.
The SHORT signal, on the other hand, is performed when the minimum is broken.
It is easier to find this type of signals on daily timefrime and markets like stocks, futures and stocks that are not open 24h.
I always advise to accompany these signals to other types of signals or analyzes to increase the chances of success and stability of the trade.
Pine Script® ストラテジー

PivotBoss TriggersI have collected the four PivotBoss indicators into one big indicator. Eventually I will delete the individual ones, since you can just turn off the ones you don't need in the style controller. Cheers.
Wick Reversal
When the market has been trending lower then suddenly forms a reversal wick candlestick , the likelihood of
a reversal increases since buyers have finally begun to overwhelm the sellers. Selling pressure rules the decline,
but responsive buyers entered the market due to perceived undervaluation. For the reversal wick to open near the
high of the candle, sell off sharply intra-bar, and then rally back toward the open of the candle is bullish , as it
signifies that the bears no longer have control since they were not able to extend the decline of the candle, or the
trend. Instead, the bulls were able to rally price from the lows of the candle and close the bar near the top of its
range, which is bullish - at least for one bar, which hadn't been the case during the bearish trend.
Essentially, when a reversal wick forms at the extreme of a trend, the market is telling you that the trend
either has stalled or is on the verge of a reversal. Remember, the market auctions higher in search of sellers, and
lower in search of buyers. When the market over-extends itself in search of market participants, it will find itself
out of value, which means responsive market participants will look to enter the market to push price back toward
an area of perceived value. This will help price find a value area for two-sided trade to take place. When the
market finds itself too far out of value, responsive market participants will sometimes enter the market with
force, which aggressively pushes price in the opposite direction, essentially forming reversal wick candlesticks .
This pattern is perhaps the most telling and common reversal setup, but requires steadfast confirmation in order
to capitalize on its power. Understanding the psychology behind these formations and learning to identify them
quickly will allow you to enter positions well ahead of the crowd, especially if you've spotted these patterns at
potentially overvalued or undervalued areas.
Fade (Extreme) Reversal
The extreme reversal setup is a clever pattern that capitalizes on the ongoing psychological patterns of
investors, traders, and institutions. Basically, the setup looks for an extreme pattern of selling pressure and then
looks to fade this behavior to capture a bullish move higher (reverse for shorts). In essence, this setup is visually
pointing out oversold and overbought scenarios that forces responsive buyers and sellers to come out of the dark
and put their money to work-price has been over-extended and must be pushed back toward a fair area of value
so two-sided trade can take place.
This setup works because many normal investors, or casual traders, head for the exits once their trade
begins to move sharply against them. When this happens, price becomes extremely overbought or oversold,
creating value for responsive buyers and sellers. Therefore, savvy professionals will see that price is above or
below value and will seize the opportunity. When the scared money is selling, the smart money begins to buy, and
Vice versa.
Look at it this way, when the market sells off sharply in one giant candlestick , traders that were short
during the drop begin to cover their profitable positions by buying. Likewise, the traders that were on the
sidelines during the sell-off now see value in lower prices and begin to buy, thus doubling up on the buying
pressure. This helps to spark a sharp v-bottom reversal that pushes price in the opposite direction back toward
fair value.
Engulfing (Outside) Reversal
The power behind this pattern lies in the psychology behind the traders involved in this setup. If you have
ever participated in a breakout at support or resistance only to have the market reverse sharply against you, then
you are familiar with the market dynamics of this setup. What exactly is going on at these levels? To understand
this concept is to understand the outside reversal pattern. Basically, market participants are testing the waters
above resistance or below support to make sure there is no new business to be done at these levels. When no
initiative buyers or sellers participate in range extension, responsive participants have all the information they
need to reverse price back toward a new area of perceived value.
As you look at a bullish outside reversal pattern, you will notice that the current bar's low is lower than the
prior bar's low. Essentially, the market is testing the waters below recently established lows to see if a downside
follow-through will occur. When no additional selling pressure enters the market, the result is a flood of buying
pressure that causes a springboard effect, thereby shooting price above the prior bar's highs and creating the
beginning of a bullish advance.
If you recall the child on the trampoline for a moment, you'll realize that the child had to force the bounce
mat down before he could spring into the air. Also, remember Jennifer the cake baker? She initially pushed price
to $20 per cake, which sent a flood of orders into her shop. The flood of buying pressure eventually sent the price
of her cakes to $35 apiece. Basically, price had to test the $20 level before it could rise to $35.
Let's analyze the outside reversal setup in a different light for a moment. One of the reasons I like this setup
is because the two-bar pattern reduces into the wick reversal setup, which we covered earlier in the chapter. If
you are not familiar with candlestick reduction, the idea is simple. You are taking the price data over two or more
candlesticks and combining them to create a single candlestick . Therefore, you will be taking the open, high, low,
and close prices of the bars in question to create a single composite candlestick .
Doji Reversal
The doji candlestick is the epitome of indecision. The pattern illustrates a virtual stalemate between buyers
and sellers, which means the existing trend may be on the verge of a reversal. If buyers have been controlling a
bullish advance over a period of time, you will typically see full-bodied candlesticks that personify the bullish
nature of the move. However, if a doji candlestick suddenly appears, the indication is that buyers are suddenly
not as confident in upside price potential as they once were. This is clearly a point of indecision, as buyers are no
longer pushing price to higher valuation, and have allowed sellers to battle them to a draw-at least for this one
candlestick . This leads to profit taking, as buyers begin to sell their profitable long positions, which is heightened
by responsive sellers entering the market due to perceived overvaluation. This "double whammy" of selling
pressure essentially pushes price lower, as responsive sellers take control of the market and push price back
toward fair value.
Pine Script® インジケーター

3 BAR ENGULFING SETUPScript that highlights bullish and bearish engulfing candles after two candles in the opposite direction.
Pine Script® インジケーター

EngulfingThe script highlights a Bullish/Bearish Engulfing 2 candlesticks pattern on the main chart screen, and has a preset alert condition. Please use an oscillator that shows oversold and overbought conditions with this script (i.e. StochRSI oscillator).
Pine Script® インジケーター

TCG Price Shear PlusThe Chart Guys Price Shear and Abnormal Volume Alerts all rolled into 1 FREE indicator
Based on TCG Price Shear V2 by urisma and Volume Spikes by OstapChester
This powerful script combines Abnormal Volume Alerts with Price Shear which can be based on either ATR or % deviation from an ema, which intern can also be filtered by Abnormal Volume for less false signals.
Look out for my next indicator which will be called TCG Price Shear Plus Scanner which will scan and alert you for several different assets at once!
Enjoy
Pine Script® インジケーター

Engulfing Candle IndicatorThis script shows you where a candle is either bullish or bearish engulfing the previous candle.
A GREEN triangle below the bar pointing UP indicates that the candle is BULLISH engulfing the previous candle
A RED triangle ABOVE the bar pointing DOWN indicates that the candle is BEARISH engulfing the previous candle
Pine Script® インジケーター

Bullish Engulfing Backtest This is a bullish reversal pattern formed by two candlesticks. Following a downtrend,
the first candlestick is a down candlestick which is followed by an up candlestick
which has a long real body that engulfs or contains the real body of the prior bar.
The Engulfing pattern is the reverse of the Harami pattern.
WARNING:
- For purpose educate only
- This script to change bars colors.
Pine Script® ストラテジー

Bullish Engulfing Strategy This is a bullish reversal pattern formed by two candlesticks. Following a downtrend,
the first candlestick is a down candlestick which is followed by an up candlestick
which has a long real body that engulfs or contains the real body of the prior bar.
The Engulfing pattern is the reverse of the Harami pattern.
WARNING:
- This script to change bars colors.
Pine Script® インジケーター

Bearish Engulfing Backtest This is a bearish candlestick reversal pattern formed by two candlesticks.
Following an uptrend, the first candlestick is a up candlestick which is
followed by a down candlestick which has a long real body that engulfs or
contains the real body of the prior bar. The Engulfing pattern is the reverse
of the Harami pattern.
WARNING:
- For purpose educate only
- This script to change bars colors.
Pine Script® ストラテジー

Bearish Engulfing Strategy This is a bearish candlestick reversal pattern formed by two candlesticks.
Following an uptrend, the first candlestick is a up candlestick which is
followed by a down candlestick which has a long real body that engulfs or
contains the real body of the prior bar. The Engulfing pattern is the reverse
of the Harami pattern.
WARNING:
- This script to change bars colors.
Pine Script® インジケーター
Graph Reader Pro 2.0Graph Reader Pro 2.0 for TradingView gives you abilities to see the stories hiding in the graphs of the stock, forex, and crypto currency markets. It counts CC59 and creates respectable support and resistance levels as well as marks and reminds you about important parameters that are happening in the graph so that you will not forget to consider them before placing orders. These parameters include:
Automatic CC59 counting that compares the close of the right price bar to that of left price bar in a group of 5 consecutive bars (ignoring 3 bars in the middle). If the right bar closed higher, the count positive number would be printed above the bar. If the right bar closed lower, the count negative number would be printed below the bar. Nine consecutive series of up counts will define the lowest price as CC59 support line and nine consecutive series of down counts will define the highest price as CC59 resistance line. The counted numbers, support and resistance lines are automatically printed on the graph if enabled.
Draw the high and low levels of the previous day, if enabled. The Previous Day's High and Low are often used as reversal levels in the few future days.
Draw the price range of each day based on Average Daily Range (ADR) value.
Paint the background areas with active Forex trading of Asian, London, and New York sessions, if enabled.
Draw simple moving average lines such as SMA5, SMA50 with ability to change the line color based on increasing or decreasing prices. A set of other simple moving average lines such as SMA13, SMA200, SMA800 can be drawn if enabled.
Draw a ribbon of simple moving average lines consisting of SMA3, SMA4, SMA6 and SMA7, if enabled. Twisting of the SMA ribbon gives a visual signal for price reversal.
Locate the price gaps in the graphs of stocks and indexes. The opened gaps are often closed later on. Hence, they are milestones for the price to come back and close them up.
Locate the pin bars having the body portion less than a specific percent of the range. The pin bars show hestitation for the price to continue the current trend. When a pin bar is covered or engulfed by the next larger bar, a trend reversal offen follows.
Draw Bollinger bands (50,2), if enabled.
Automatic printing of the events happening in the graph to remind the readers of parameters under considerations (if enabled) including:
- Print "C>SMA5" and "C13" and "SMA5<13" for SMA(5) crossed above and below SMA(13).
- Print "Max" and "Min" for local maximum and local minimum bars.
- Print "RSI>70" and "RSI<70" for RSI(14) that crossed above 70 % and below 70 %.
- Print "RSI<30" and "RSI>30" for RSI(14) that crossed below 30 % and above 30 %.
- Print "MACD>0" and "MACD<0" for MACD(12,26,9) that crossed above and below zero.
- Print "MACD>Sig" and "MACD
Pine Script® インジケーター

Engulfing Candle by Atilla YurtsevenI have been backtesting many known strategies. I have created this Engulfing Candle indicator which makes it easy to detect engulfing candles. I have also added a short/long signals.
Description:
Engulfing candle: If a candle's high is higher than the previous candle's high and low is lower than previous candle's low, it is called Engulfing Candle. If the Engulfing candle's color is red, it is bearish, if green it is bullish.
Strategy: There are many strategies out there. The most known is creating pending orders after a few pips away from the direction of the engulfing candle. Assuming we have a bullish engulfing candle. At the beginning of the next candle, we simply create a buy-stop order (pending order) over 5 pips of the previous candle's (engulfing candle) high. Let's say bullish engulfing candle's high was 1.16051. In this case, we create a buy-stop at 1.16101. Also please take spread into account! If our order is not filled in the same candle, simply cancel the pending order.
This indicator does not repaint. Once signal occurs, it will not be removed. However, engulfing candle's type (bearish or bullish) can only be confirmed by the end of the bar!
I actually don't use Engulfing candle's in my trading. I am sharing this indicator in case you may need it.
Disclaimer: Past performance is not an indication of future performance. All the information in this article, including the algorithm & indicator, was provided and published for informational purposes only and should not be considered legal or financial advice. Use at your own risk!
Happy trading :)
Atilla Yurtseven
Pine Script® インジケーター

Engulfing H4 + FilterI realized this indicator to facilitate the Backtesting operations.
The indicator autonomously detects the Engulfings to which filters can be placed. The available filters are:
- ATR (discards Engulfings which do not have a body greater than or equal to the value of ATR)
-SWING(SWING filter, the indicator ensures that the Engulfing minimum/maximum must be the absolute minimum/maximum with respect to the number of spark plugs selected in the settings)
- L3C/H3C (discards Engulfings that do not form an L3C or H3C)
- RSI (Discards Engulfing that is not in overbought/oversold in the first pattern candle)
In addition, the indicator draws 4 lines (2 for bullish Engulfings and 2 for bearish Engulfings) which are SL and TP.
The Stop Loss is calculated an ATR below/above the swing generated by the two Engulfing spark plugs and the Take Profit is calculated according to the return risk set in the indicator, which is 1.5 by default.
Pine Script® インジケーター

BAHbO - multi indicators and signals SMA,BB,RSI,Engulfing,Signal4 SMAs - 9,21,55,200
Bollinger Bands - 21
Engulfing patterns
Fractal Support Resistance
Bullish and Bearish Engulfing signals
Engulfing Candles
Bollinger Bands + RSI combined indicator with signals
Pine Script® インジケーター

RSI Swing SignalThis indicator is a tool designed to be used with Steven Hart's RSI Exhaustion strategy. For more information google TheTradingChannel or look him up on YouTube :)
The default RSI settings for this strategy are:
RSI Overbought: 80
RSI Oversold: 20
Length: 7
When the RSI gets above 80, the line will turn red and the script will begin looking for a specific type of engulfing candle to go short. The same is true when the RSI gets below 20, but the line will turn green and look for longs. It is best used as a back-testing aid, but it can also be used to send emails or SMS alerts whenever the conditions are met. It can also be used as an alternative colored RSI indicator by removing the signals in the settings menu and changing the RSI parameters to whatever you normally use. This can aid in RSI divergence and overbought/sold strategies.
Entries:
The bright green and bright red lines represent the first type of engulfing candle.
The dark green and red lines represent the second type of engulfing candle.
Some pairs perform best with only one of these entries, while others work fine with both.
This is a counter-trend or consolidation strategy, and is best used in combination with trend-continuation or trend-following strategies. As always, make sure you back-test it before you use it to trade as it works better on some pairs than others.
Pine Script® インジケーター
