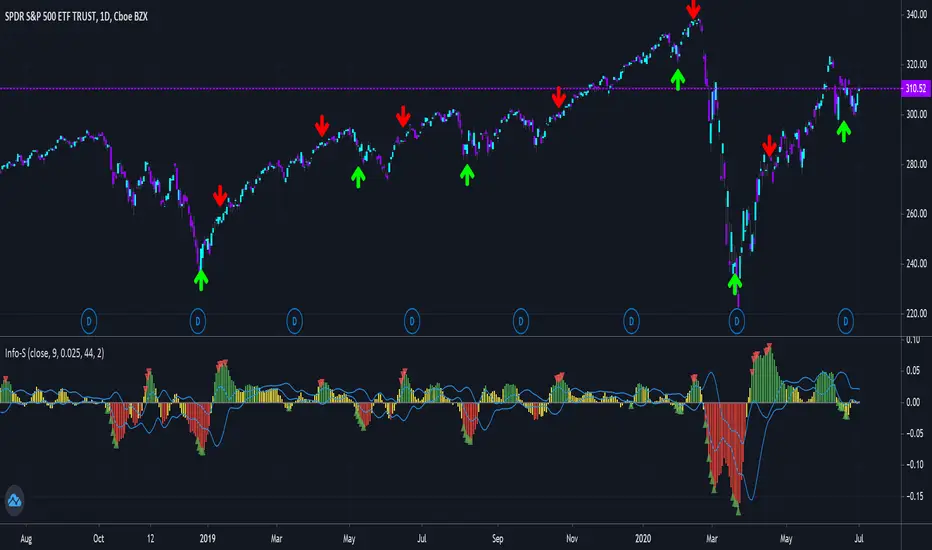
Bernoulli Process - Binary Entropy FunctionThis indicator is the Bernoulli Process or Wikipedia - Binary Entropy Function . Within Information Theory, Entropy is the measure of available information, here we use a binary variable 0 or 1 (P) and (1-P) (Bernoulli Function/Distribution), and combined with the Shannon Entropy measurement. As you can see below, it produces some wonderful charts and signals, using price, volume, or both summed together. The chart below shows you a couple of options and some critical details on the indicator. The best part about this is the simplicity, all of this information in a couple of lines of code.
Using the indicator:
The longer the Entropy measurement the more information you are capturing, so the analogy is, the shorter the signal, the less information you have available to utilize. You'll run into your Nyquist frequencies below a length of 5. I've found values between 9 and 22 work well to gather enough measurements. You also have an averaging summation that measures the weight or importance of the information over the summation period. This is also used for highlighting when you have an information signal above the 5% level (2 sigma) and then can be adjusted using the Percent Rank Variable. Finally, you can plot the individual signals (Price or Volume) to get another set of measurements to utilize. As can be seen in the chart below, the volume moves before price (but hopefully you already knew that)
At its core, this is taking the Binary Entropy measurement (using a Bernoulli distribution) for price and volume. I've subtracted the volume from the price so that you can use it like a MACD, also for shorter time frames (7, 9, 11) you can get divergences on the histogram. These divergences are primarily due to the weekly nature of the markets (5 days, 10 days is two weeks,...so 9 is measuring the last day of the past two weeks...so 11 is measuring the current day and the past two weeks).
Here are a couple of other examples, assuming you just love BTC, Stocks, or FOREX. I fashioned up a strategy to show the potential of the indicator.
BTC-Strategy
Stock-Strategy (#loveyouNFLX)
FOREX - (for everyone hopped up on 40X leverage)
Entropy

Shannon Entropy V2Version 2, Shannon Entropy
This update includes both a deadband (Plotting Optional) and PercentRank Indicating.
Here is a unique way of looking at your price & volume information. Utilize the calculated value of "Shannon Entropy". This is a measure of "surprise" in the data, the larger the move or deviation from the most probable value, the higher the new information gain. What I think is so interesting about this value, is the smoothness that it displays the information without using moving averages. There is a lot of meat on this bone to be incorporated in other scripts.
H = -sum(prob(i) * log_base2(prob(i)))
I've included the typical way that I've been experimenting with this, which is the difference between the volume information and price information. I've included the option to turn either price or volume data off to see the Shannon Entropy value of either value. There are a ton of complex scripts out there trying to do what this calculation is doing in 3 lines. As with anything, there are no free lunches, so you can nicely see as you lower the lengths you'll quickly learn where your nyquist frequencies are at, you'll want to work at about double the noisy value at a minimum.
Using this script is based on "Information" and it highlights places that need your attention, either because there is a large amount of change (new information) or there is minimal new information (complacency, institutional movements). Buy and Sell points are up to the user, this is just showing you where you need to provide some attention.
You can use it with or without volume data, you can also isolate either the source and volume. Below are some options for printing:
It can also with BTC (better with volume data)
Big shoutout to yatrader2 for great Shannon Entropy discussions.
And to Picte/ for his interesting inspiration STOCH-HVP-picte
Shannon EntropyHere is a unique way of looking at your price & volume information. Utilize the calculated value of "Shannon Entropy". This is a measure of "surprise" in the data, the larger the move or deviation from the most probable value, the higher the new information gain. What I think is so interesting about this value, is the smoothness that it displays the information without using moving averages. There is a lot of meat on this bone to be incorporated in other scripts.
H = -sum(prob(i) * log_base2(prob(i)))
I've included the typical way that I've been experimenting with this, which is the difference between the volume information and price information. I've included the option to turn either price or volume data off to see the Shannon Entropy value of either value. There are a ton of complex scripts out there trying to do what this calculation is doing in 3 lines.
As with anything, there are no free lunches, so you can nicely see as you lower the lengths you'll quickly learn where your nyquist frequencies are at, you'll want to work at about double the noisy value at a minimum.

P-Signal v2.0Description.
-------------
P-Signal v.2.0 is a modified and improved version of an earlier published P-Signal. This version allows to observe
the signal image for a multi frame - a specific set of periods. In this version it is {T, 2T, 4T, 8T, 16T},
where T equals the “working” time i.e. period for which a chart is observed. For example, if T=5m, one can observe
P-Signal not only for 5m period (ocher curve) but also an average image of P-Signal for 5m, 10m, 20m, 40m, 80m
periods (grey curve) without switching over frames.
Moreover p-Signal v2.0 allows to catch "winning" combinations with help of alerts. When alert is active, you'll receive
a notification if combination exists after working frame was closed. There are two combinations in this version:
“High” and “Straight”. The terminology is borrowed from poker game to more easily present trading ideas.
For example: " EUR.USD Straight SHORT on 4h " and so on.
The “High” alert corresponds to absolute value of Gauss error function of working frame (T) not less the value which
is defined by Alert on “High” parameter. The “Straight” combination is registered if same sign signals (poker “flush”)
are observed simultaneously over set of periods. The rank of “Straight” combination is defined by T and Alert on “Straight”
parameter. This combination is less frequent, but stronger the previous one if parameters are chosen reasonably.
Value of parameters depend on T. The lower T the closer parameters to 1. By default “High” equals to 0.98 and
“Straight” equals to 0.85. Both for T=1m. The other parameters correspond to the first version.
Important ! For correct operation T should not exceed the values of hourly time frames!
Good luck!
