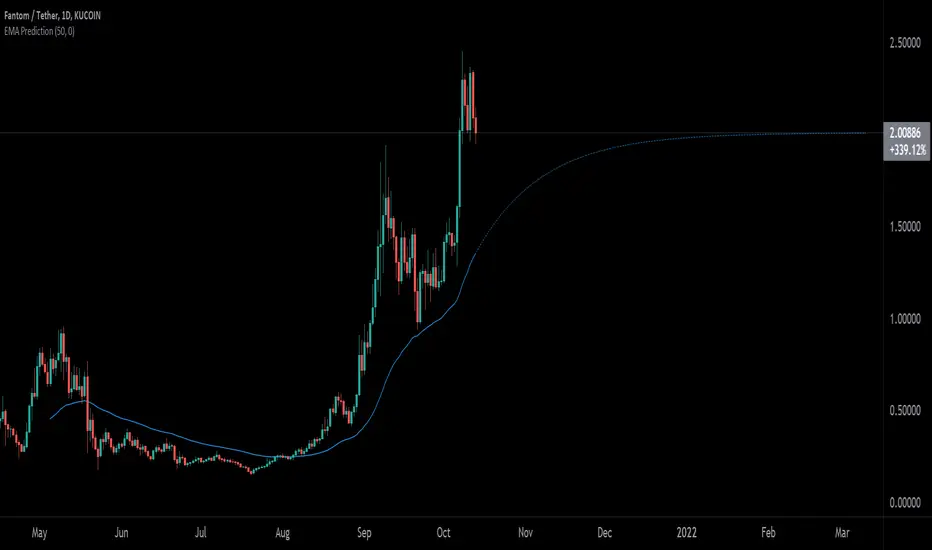
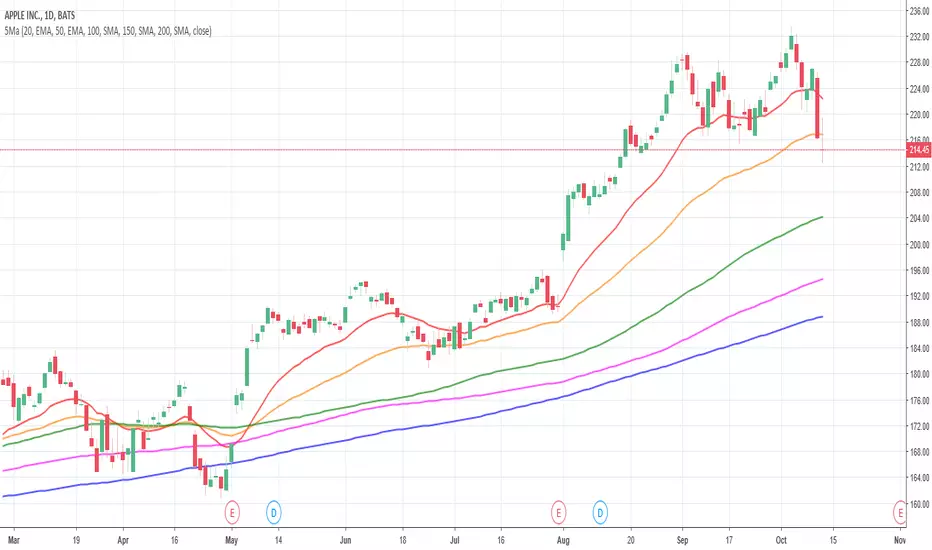
EMA PredictionThis script predicts future EMA values assuming that the price remains as configured (-50% to +50%).
Exponentialmovingaverage
3GBH - Multiple MA'sIncluded in this indicator:
- Fast/Slow EMA's
- Fast/Slow SMA's
- Fast/Slow WMA's
- Fast/Slow HMA's
- Fast/Slow RMA's
-----
Use of of the type of Moving Averages.
Or use them all.
-----
User-friendly.
You can change all the inputs, they are labelled for ease-of-use.
You can toggle On/Off any or all of the options.
Average Band by HarmanUsually, Moving Averages (Simple & Exponential) consider "close" of each candle to form a line for a particular period. In this indicator, we have considered all the parameters (Open, Close, Low & High) of each candle to form a Band or a wave which act as a zone to provide support & resistance. It works well on all the time frames. It perfectly works on lower time frames of 15 min & 5 min for intraday trades and even for scalping. There is a line that moves very near to candles known as "Candle Line" provide support & resistance to each individual candle and a leading line which moves ahead also acts as support & resistance and helps in determining trend direction.
How to use the indicator ?
Indicator consists of 3 components :
1) A Band or wave of 3 lines (upper, middle & lower line)
2) A "Candle Line" which moves along with the candles
3) A Leading line which moves ahead of the candles
Method 1 : When candles are being formed above the candle line (line near to candles) and it crosses the band or wave from below to upside, then long trade can be initiated. Similarly, When candles are being formed below the Candle line and it crosses the band or wave from upside then short trade can be initiated. Stop loss can be maintained below the band for Long trade and above the band for short trade. Candle line can be used to trail the stop loss.
Method 2: If candles moves above and below of the band very often and frequently and candle line is in the middle of candles then it is NO TRADING ZONE. If you still want to trade, then select a higher time frame and check the price movement. If there is a stability in the higher time frame, then take the trade in the higher timeframe with stable movement.
Method 3 : Candle line acts as "First line of Defence". In a uptrend, all the candles are formed above the candle line and in case of down trend, all the candles are formed below the candle line. When a newly formed candle cross the candle line then you can book profit. For Example : In uptrend , candles are being formed above the line, when a new candle started forming below the line and when the complete candle is formed below the line, profit can be booked. Vice-versa in case of downtrend.
Method 4: Direction of leading line, band and candle line helps in determining the trend. If all these three components are in upward direction, price trend is upward and if all these three components are in downward direction, then price trend is downward. When, leading line and band cross each other from opposite direction for consecutive 2-3 times, then price movement is sideways.
Method 5 : Thickness of band play an important role in determining price action. If band is narrow, it means small candles are being formed and no any huge price movement is observed in this period. When band started expanding, it signifies that big candles are begin to form and there is a more price movement than before. Similarly, If contraction of band started, it means that small candles are being formed and there is low price movement as compared to the price movement when Band was expanded. If Band is expanded (wider) and volumes are high, It means the Band will act as strong Support or Resistance than usual. In case, candles and candle line cross the expanded Band, you can enter the Long or Short trade.
Method 6: When the Band, leading line and candle line collides or meet at a single point, then it is either strong support or resistance.
Method 7 : Usage in Scalping : Select the shorter time frame of 1 min or 5 min. If the candles are crossing the band very frequently in 1 min, then select 5 min time frame or wait for few minutes for stability. Now, when candles started forming above the candle line and it crosses the band from below then take a long position and book profit after few candles above the band. Place stop loss below the Band. Similarly, when candles started forming below the candle line and it crosses the band from above, then enter into short trade and book profit after few candles. Place stop loss above the band in the case of short trade.
You can combine above methods to give a sharp edge to your trade and increase the probability of your winning in the trade.
Indicator Settings : Default period selected is 50 for both the Band and leading line. You can change the period to 26 or 100 or 200. Select the period and check the chart, if the indicator looks fine and smooth, then you can use your settings. For most of the time, default settings work perfectly.
Proudly Developed by :
Harmandeep Singh
Graduate in Computer Science with Physics & Mathematics
MBA in Business Marketing and Finance
Experienced Computer programmer & Software developer
Stock Market & Crypto Trader

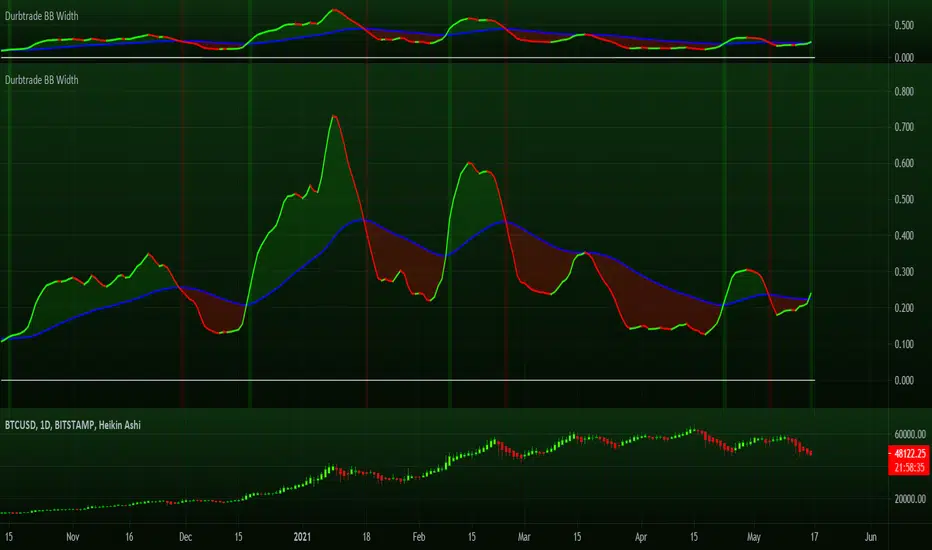
Durbtrade Bollinger Bands WidthFirst published script. Actually, this is my 1st script ever! I know its not flashy or anything, but I finally decided to try learning some pine... and to try and get rid of the dang 0 on my profile, haha. So here are the results after many hours.
I like using the BB Width indicator, and I wanted it to change color based on whether is was rising or falling. I also have it to automatically plot a horizontal line at 0 so I don't have to draw a line every time I apply the indicator to a new chart. And I changed the default precision to 3.
I noticed that there aren't that many BB Width scripts. and I don't think there is anything like this out there that I know of, so I hope someone else besides me will find it useful.
Please feel free to comment.
Moving Averages For All Timeframes [LevelUp]Manage moving averages, for every timeframe, from within one indicator.
Features:
■ Intraday - Up to 3 moving averages
■ Daily - Up to 4 moving averages
■ Weekly - Up to 2 moving averages
■ Monthly - Up to 2 moving averages
■ Choose between simple, exponential or volume weighted moving averages (SMA, EMA or VWMA)

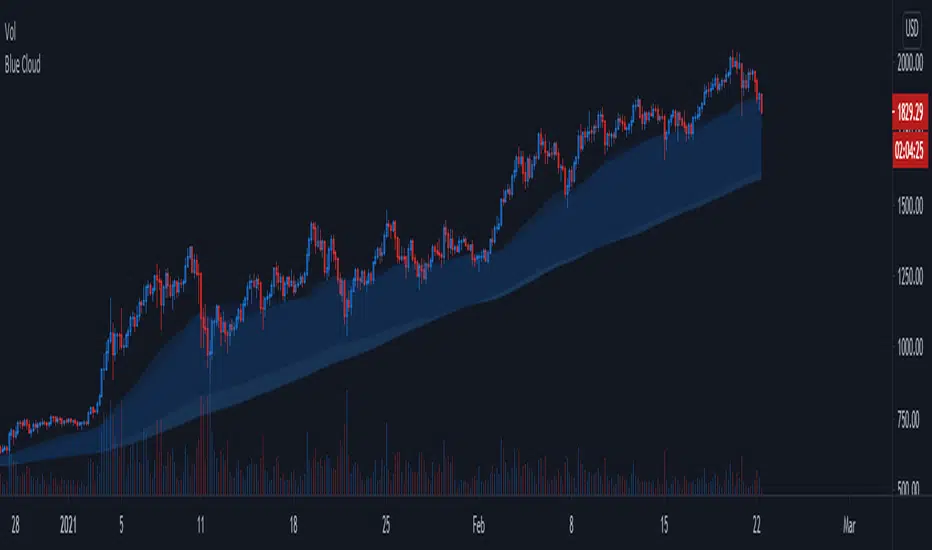
Blue CloudTrend Indicator
- Based on 4h 50/200 ma/ema
- Static, same accross all timeframes
- Works best with trending assets (espacially altcoins)
- 4h 50/200 ma/ema 's are transparent by default but can be enabled to improve visibility
Blue Cloud = Bullish, cloud often acts as support
Red Cloud = Bearish, cloud often acts as resistance

EMA with time-interval dependant visiblity settingThis scrip exposes 4 Exponential Moving Average (EMA) indicators which their visibility can be set to a daily or weekly time-frame (aka intervals). Based on your current chart time-frame, the matching EMA indicators come on and off.
This helps to have meaningful EMAs relevant to your time internal.
In a traditional 10 EMA indicates a plotted indicator would bear a meaning of a 10 day EMA when in daily and 10 week EMA when in weekly chart which may or may not be useful as some who for example only require a 10 week EMA for thier analysis and wouldn't want to cloud a daily chart with an EMA which won't resemble a valuable output for this particular user.
With EMA+, you can choose to see the 10 week EMA only when your chart is in the weekly time interval, so when switched to a daily interval a 10x EMA is not shown anymore.
If you prefer to see a 10 week EMA and a 21 day EMA on the other hand, you will only have 1 EMA shown when in weekly mode which is a 10 week EMA and one EMA when in daily mode with is 21 day EMA.

EMA 50 cross 200 with Strong TrendEMA 50 cross 200 with Strong Trend
Just Buy when Green apears and close it when disapear.
and
Just Sell when Red apears and close it when disapear.
if you combine with upper Time Frame , it will be supper decision
Good Luck

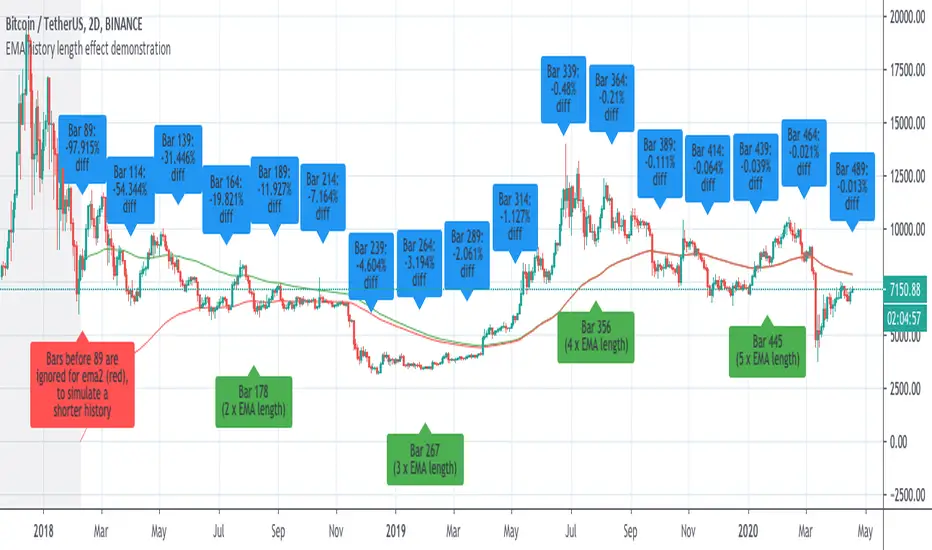
Demonstration of how history length affects all EMA valuesI saw some discussion of this so I whipped up an example to prove the that effect of history length on EMA values is pronounced, even for bars much further than the EMA length from the first candle of the chart.
This chart has two 89-bar EMAs of the close: a green one and a red one. However, for the red one, the first 89 bars of the graph are considered to have a close of "0", which is exactly whatTradingView's EMA calculation uses for bars before the start of the graph.
This is because unlike other moving averages, which reference the price of previous bars, the EMA references the EMA of previous bars. Therefore, bars closer to the beginning of the chart, where TradingView can't calculate an EMA because there is no previous EMA and therefore uses 0, will return substantially different values for the EMA() function that the same cart would with more history.
The further a bar is back in history, the less influence it has. However, every single historical bar has some influence on the EMA of every later bar.
To allow you to see this for yourself, this script contains the following inputs which you can change to see the effect:
-EMA period (default 89)
-Number of bars to ignore for EMA2 (default 89)
-decimal precision to show differences in. By making this a large number you can see that, although the effects diminish, history length affects all EMA values for the char.
-label spacing (increase this if you have a long history and run into TV's 50-label limit)
EMA 25, 50, 100, 200Use this script to reduce the amount of indicators. The darker the color, the longer timeframe the EMA is.
Multi EMA/SMA with Bollinger Bands Combo 1.0This script provides:
5 regular EMAs
5 regular SMAs
3 multiple time frame EMAs
3 multiple time frame SMAs
Bollinger Bands
All features can be turned on/off and customized regarding color, lines, etc.
Excellent for TradingView users with limited or free accounts.

4 Fibonacci EMAsAdd 4 Fibonacci EMAs to your charts with one indicator.
Configureable by value, so they don't necessarily have to use Fibonacci numbers, and by colors.

Multiple EMAMultiple EMA. Color switch of slowest EMA (def=200) when price close below or above. Trend marker when fastest EMA (def=9) cross slowest EMA (def=200).
Multiple EMAMultiple EMA lines. Color switch of slowest EMA (def=200) when price close above or below. Trend marker when fastest EMA (def=9) cross slowest one.

Pivot Boss 4 EMA + Bollinger Bands + Parabolic SARA combination of some of my favorite indicators.
All credit to original authors.
5 Moving Averages (SMA, EMA)5 moving averages in 1 indicator. Choose between SMA and EMA for each moving average.
Philakone 4EMAs + 3MAs (200+100+50)Hi guys ^^
This script combine all Philakone EMAs plus i added death and golden cross MAs which is ( 200 MA + 50 MA ) plus 100 MA
You can fully customize all moving averages MA EMA show or hide or change color or thickness and ofc 0.79% play with source code :)
BTC tip :
3BMEXA9mJMhMBJR9MR3t7othh7BijxUNW7
Thanks ^^

Uncle Mo's Ultimate Ichimoku V1Main features:
2 x Ichimoku Cloud
5 x EMA
2 x MA
1 x HullMA
Williams Fractals
Study is based around trader @br0qn 's Ichimoku script.
Credits also go to:
@RicardoSantos for the Bill Williams Fractals
@EmilianoMesa for the EMAs/MAs
@mohamed982 for the HullMA
The script is open source so please feel free to change it around. I'd greatly appreciate it if you could suggest ways to improve it.
Happy trading!

2xIchimoku Cloud + 4xMA + Williams FractalUpdated version of the previously published multi-indicator which includes
4x Moving Averages
2x Ichimoku Clouds
Bill Williams Fractals
Changes:
-Toggle switches for each indicator on input tab for easy on/off
-MA Type Selector (EMA/SMA/WMA/VWMA)
-Various default style change
Many thanks to both redwraith and jedireza for helping me work out the MA section
www.tradingview.com
www.tradingview.com
Next improvements: Ichimoku settings
Awesome Moving AveragesThis script allows you to add up to four simple and exponential moving averages the the chart instead of adding 4 simple moving averages and 4 exponential moving averages individually.
The stronger lines are SMA's and the thinner lines are EMA's.
White - "1st SMA" and "1st EMA"
Green - "2nd SMA" and "2nd EMA"
Blue - "3rd SMA" and "3rd EMA"
Red - "4th SMA" and "4th EMA"
You can modify which moving averages are visible on the chart and also modify the period of the moving averages.
There are four periods which you can edit - each period applies to a pair of moving averages (a pair of SMA and EMA). For example: "1st MA Length" option applies to "1st SMA" and "1st EMA" etc.
ibb.co
In addition to that Awesome Moving Averages script allows you to keep the daily moving averages resolution on intraday charts.
For example - here we have only "1st SMA" and "1st EMA" enabled and we are viewing a daily chart:
Now if we have "Keep Daily MA Resolution On Intraday Periods" option enabled we would see the daily moving averages (SMA and EMA) on intraday periods. Here we are viewing a 4h chart:
If you disable this option you would see the moving averages on intraday charts with the intraday MA lengths as you expect:
"Visible MA's On Intraday Periods" option allows you to choose which MA's you would like to be visible on intraday charts if the "Keep Daily MA Resolution On Intraday Periods" option is enabled.
If you have any thoughts or ideas on how to improve the "Awesome Moving Averages" script then let me know!
