[CP]6 EMA Multi Timeframe InceptionA collection of 6 EMAs.
Each EMA can be attached to a different timeframe and have a different offset.
Great for building strategies that combine EMAs from different timeframes.
Exponentialmovingaverages

Multiple Moving Averages in one indicatorHi, that's an "enhanced" version of this indicator gently published by myfye13 .
Here's the things I've implemented:
Up to 8 moving averages
Now you can set the source of each moving average
Now you can set the length of each moving average.
Hope this will help especially those who have an indicato limit or who use multiple emas and don't wan't to see a stack of indicators list on the upper left of the chart.

Daily/MTF Moving Averages (EMA20, EMA55, SMA50, SMA100, SMA200)Script to plot common daily/alternative timeframe moving averages on when viewing securities at other resolutions.
There's lots of different MA scripts out there, but I couldn't find one that just represented the standard support/resistance indicators that were typical for my markets. So, this is the DIY. :)
X+ - SMA/EMA Suite with MTF
I often use a mix of EMAs and SMAs in my analysis and turning them on and off and adding and removing them from the chart becomes a bit of a burden.
In this script you'll find the most common EMAs and SMAs that I use on just about every chart I look at.
If the feature ever becomes available to save settings as templates from within the script, then I will do that but for now there are two work-arounds.
www.dropbox.com
Work-Around 1: Create the suite that you want recalled by selecting what Moving Averages you want and then SAVE AS AN INDICATOR TEMPLATE. This has a fairly quick recall and you'll be able to access one that says "all EMA's" or "all SMAs" or "SMA/EMA for H4 Chart with MTF". Whatever you want.
That may work for some traders but others don't want the fuss of having their other indicators in the way or being added or removed from their templates, etc.
Work-Around 2: Add two instances or even three, whatever. I personally use two because the select on and select off can be a hassle when dealing with so many options.
I essentially use one that I have selected when I am looking at Daily or Higher Charts and then I hide that one an unhide the other one that is already setup for lower timeframe charts, from the M1 to the H4.
This allows me to run two full suites. I was looking for a way to save settings like we can with the Fibonacci tool but I simply could not find a solution. So, this will have to do.
The MTF - Multi-Time-Frame
I have it coded to display the 20 SMA from the M30, H1 and H4 Charts - no matter what timeframe you are currently viewing.
I also have the 200 EMA from the same charts (M30, H1, H4)
The Settings can be changed but the readout on the scales will stay 20 and 200.
www.dropbox.com
You can change the SMA and the EMA to whatever you want as well as the Source, an offset if desired and the timeframe from which it will display from.
Above is a screenshot of an H4 Chart with only the MTFs. So you will see the 20 SMA from the M30 as well as the H1 and H4. They have a checkered style to them that can be customized in the settings. Those are White and Black.
The Green and Black are the 200 EMAs from the M30 and the H1 and H4.
www.dropbox.com
If you want to be able to see the Label on the scale, you can head to Settings/Scales and Tick on "Indicator Name Label"
www.dropbox.com
www.dropbox.com
I have a pretty specific color format that I follow but I do a lot of teaching. For me, it's far easier to have the readout of what line is what right on the chart:
7 EMA is the 7 EMA and not just "EMA" or something even longer that takes up a good portion of your screen when you turn on the indicator name label option.
Anyway, I hope somebody finds a use for this and if so, Awesome.
Above are just some ideas of how I use it.
GODMODE PivotsGODMODE PIVOTS
******************************************************
Note : Read below before you use on live trading accounts and test on paper trading until you get used to of it
*** This script does not provide end to end signals like buy here and sell there ***
* I personally use this trading system for my trades so i have converted all of it into one script
* I got used to with these ema's and been using it from long time ago
* Take trades on your own risk
*******************************************************
# Script Signals :
* Pivot points for take profits
* UT ( up trend indication )
* DT ( down trend indication )
* Small triangles ( red ,green for continuation )
* Bar colors ( for overbought and oversold )
* 3 EMA's ( for support and resistance )
# how to use :
++++ made to use on 30 min and 1 hr time frame only ++++
* Ema's for support and resistance
* long after "UT" green signal
* short after "DT" red signal
* "Piv" labels (pivot points) for take profits
Piv red = take profits on longs
Piv green = take profits on shorts
* Small triangles shows continuation signals
green for up trend
red for downtrend
* Bar colors shows over sold and overbought price
Green and blue is for oversold price
Red and Orange is for overbought price
When these bar colors occurs i consider closing full position
* Use Ema's for stop placements
**look at the chart for reference
Dm for access
Thanks

EMA 20/100/200 alwaysThis script will always show the EMA 20/100/200 daily values across any time frame chart (e.g. showing daily 20 EMA while viewing the 5 minute chart)

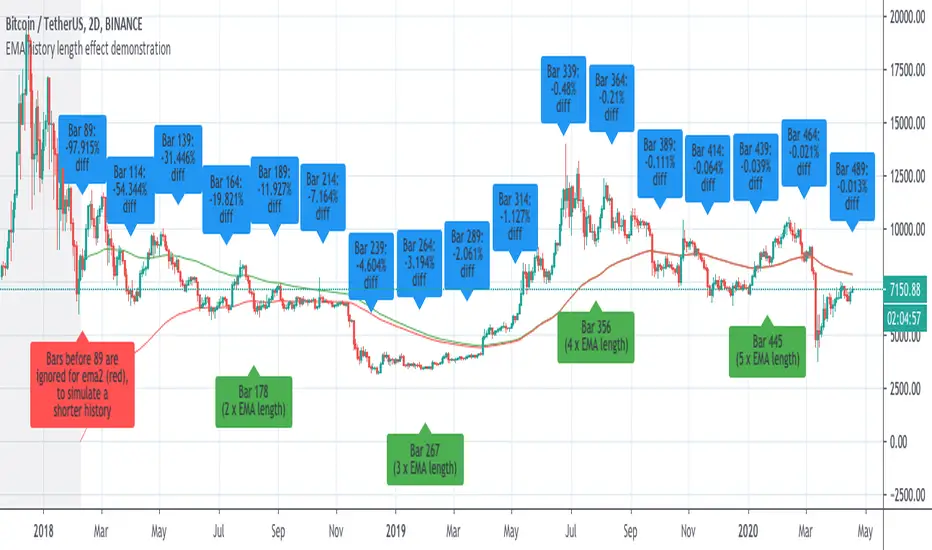
Demonstration of how history length affects all EMA valuesI saw some discussion of this so I whipped up an example to prove the that effect of history length on EMA values is pronounced, even for bars much further than the EMA length from the first candle of the chart.
This chart has two 89-bar EMAs of the close: a green one and a red one. However, for the red one, the first 89 bars of the graph are considered to have a close of "0", which is exactly whatTradingView's EMA calculation uses for bars before the start of the graph.
This is because unlike other moving averages, which reference the price of previous bars, the EMA references the EMA of previous bars. Therefore, bars closer to the beginning of the chart, where TradingView can't calculate an EMA because there is no previous EMA and therefore uses 0, will return substantially different values for the EMA() function that the same cart would with more history.
The further a bar is back in history, the less influence it has. However, every single historical bar has some influence on the EMA of every later bar.
To allow you to see this for yourself, this script contains the following inputs which you can change to see the effect:
-EMA period (default 89)
-Number of bars to ignore for EMA2 (default 89)
-decimal precision to show differences in. By making this a large number you can see that, although the effects diminish, history length affects all EMA values for the char.
-label spacing (increase this if you have a long history and run into TV's 50-label limit)
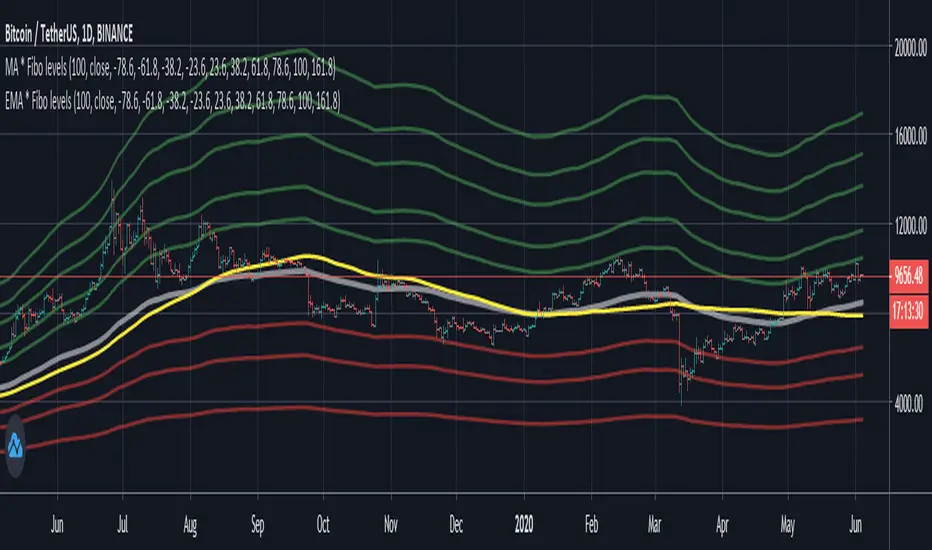
EMA / Fibonacci / Bollinger Indicator for Market Sniper SuiteHello all,
this script was created to be used in conjunction with Market Sniper - Trading/Scalping Suite . It was put together to make instrument analysis faster and less convoluted.
It includes
9 Fibonacci Exponential moving averages + 2 Simple moving averages
Auto Fibonacci levels - Tradingviews Auto Fib Retracement - with some modifications
Bollinger Bands - To faster spot squeeze momentum

Multi Timeframe Moving Averages This indicator allows you to view a moving average ( EMA or SMA ) of your choosing on other time frames than what you are currently on. You just need to edit the script and plot MAs that you want to see.
This is based on awesome work of @millerrh at but now instead of read inputs, I just plot what I desire with correct labels.
The reason I used that was that I wanted to see daily MAs in 15min, 5min and 1min charts.
To use the script add to your chart and edit it, you can add or remove any MA you want at end of file and then add it to your chart again.
The code off course is open source.

ATS Masters Indicator #2This ATS Master Indicator #2 is a collection of multiple useful indicators, which only requires one indicator slot in TradingView.
In this collection you will find the following 12 indicators:
Bollinger Bands (three different types: Fibonacci, Standard, Improved)
Moving Averages (up to two individual MA indicators)
Exponential Moving Averages (up to two individual EMA indicators)
Double Exponential Moving Averages (up to two individual DEMA indicators)
Tripple Exponential Moving Averages (up to two individual TEMA indicators)
Volume Weighted Moving Average
Weighted Moving Average
So, using this master indicator you are able to use up to 12 indicators in one.
If you would like to test this master indicator drop me a line and send a request for it.

Bollinger Bands Ema 50,200,800EMAs converted to Bollinger Bands The bands are 50, 200 and 800 period, forming a strategy and having clear trends and stronger supports and resistances (when the lines converge the area is stronger).
PRIME - EMAS - ETHUSD
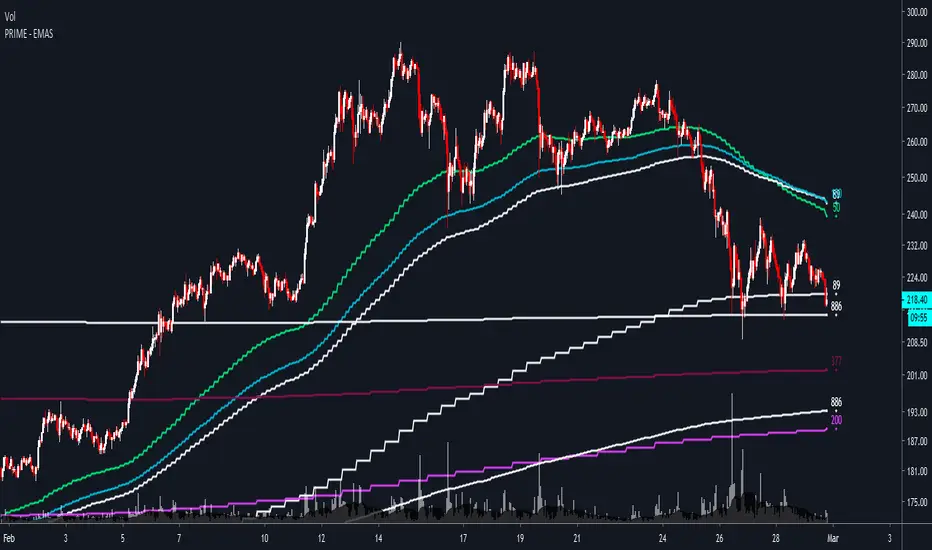
PRIME - EMAS - ETHUSD is an indicator that allows you to see some of the best hourly, daily, weekly and monthly EMAs/SMAs for trading ETHUSD .
These are timeframe-fixed EMAs/SMAs, which means that they will provide you with the same data in all timeframes, unlike most EMAs/SMAs indicators out there.
You also have the option to show them in full or a simplified version of them to declutter your chart.
For access and questions, please message me here on TradingView. I will be happy to help!
EMA Noodle Fan by KviateqJust a very simple EMA fan using Highs and Lows instead of closes. This results in these "EMA noodles". Price very rarely reacts rigidly to a close price of an EMA, sometimes it comes short, other times it overshoots it. Hence the idea behind the noodles.
You can obviously change the lengths of each of the noodle, I chose these lengths for a M5 timeframe and these represent your typical 50, 100 and 200 EMAs on higher timeframes.

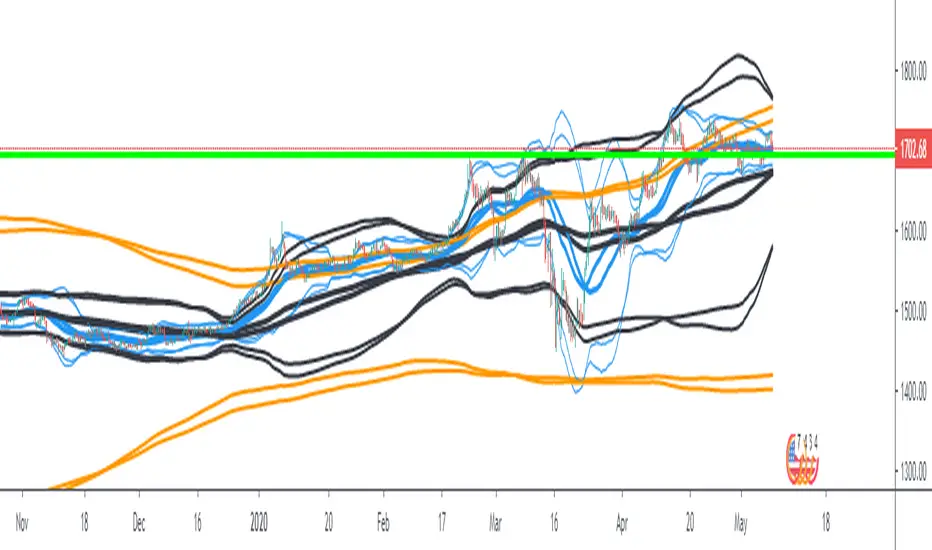
PRIME+ EMASPRIME+ EMAS is an indicator that allows you to see some of the best hourly, daily, weekly and monthly EMAs/SMAs for trading cryptocurrencies; in particular Bitcoin.
These are timeframe-fixed EMAs/SMAs, which means that they will provide you with the same data in all timeframes, unlike most EMAs/SMAs indicators out there.
You also have the option to show them in full or a simplified version of them to declutter your chart.
This PRIME+ version also has 3m timeframe EMAs for a more detailed analysis of the market.
For access and questions, please message me here on TradingView. I will be happy to help!

PRIME - EMASPRIME - EMAS is an indicator that allows you to see some of the best hourly, daily, weekly and monthly EMAs/SMAs for trading cryptocurrencies; in particular Bitcoin.
These are timeframe-fixed EMAs/SMAs, which means that they will provide you with the same data in all timeframes, unlike most EMAs/SMAs indicators out there.
You also have the option to show them in full or a simplified version of them to declutter your chart.
For access and questions, please message me here on TradingView. I will be happy to help!

Pivot Boss 4 EMA + BB + Parabolic SAR + IchimokuA combination of a few of my favorite indicators.
1) Pivot Boss 4 EMA
2) Bollinger Bands
3) Parabolic SAR
4) Ichimoku Cloud
All credit to original authors.

9.x IndexENGLISH
The 9-period exponential moving average setups are simple and efficient for upward or downward trends. Its creation is attributed to trader Larry Williams . In Brazil it is widely publicized by trader Alexandre Fernandes (Palex).
This indicator was created to show the setup that appeared in each candle and an arrow shows the direction that the operation must be made (up arrow, long, and down arrow, short).
Below are the rules that describe each setup.
9.1 Long
1) MME9 is descending;
2) The candle that changes the direction of the average upwards, after its closing, activates the setup, if its maximum is broken, the purchase is activated;
3) The stop loss is positioned below the candle low in step 2.
9.1 Short
1) MME9 is rising;
2) The candle that changes the direction of the average downwards, after its closing, activates the setup, if its minimum is lost the sale is activated;
3) The stop loss is positioned above the candle maximum in step 2.
9.2 Long
1) MME9 is rising;
2) The current candle must close below the minimum of the previous candle, if its maximum is broken, the purchase is activated;
4) If the maximum of the candle in step 2 is not broken, the purchase will occur when the maximum of the next candle is broken;
5) The stop loss is positioned below the minimum of the candle in step 2 or step 3.
9.2 Short
1) MME9 is descending;
2) The current candle must close above the maximum of the previous candle, if its minimum is lost the sale is activated;
4) If the minimum of the candle in step 2 is not lost, the sale will occur when the minimum of the next candle breaks;
5) The stop loss is positioned above the maximum of the candle in step 2 or step 3.
9.3 Long
1) MME9 is rising;
2) A reference candle must be followed by two closings in a row below its closing, the purchase occurs when the maximum of the last candle breaks;
3) If the last high is not broken, the purchase occurs when the maximum of the next candle breaks;
4) The stop loss is positioned below the minimum of the candle in step 2 or step 3;
9.3 Short
1) MME9 is descending;
2) A reference candle must be followed by two closings in a row above its closing, the sale occurs when the minimum of the last candle breaks;
3) If the last low is not broken, the sale occurs when the minimum of the next candle breaks;
4) The stop loss is positioned above the candle maximum of step 2 or step 3;
9.4 Long
1) A candle generates a 9.1 short;
2) The next candle should generate a 9.1 long without losing the minimum of the previous candle, the purchase occurs when the maximum is broken;
3) The stop loss is positioned at the low of the candle in step 2.
Setup 9.4 for sale
1) A candle generates a 9.1 long;
2) The next candle should generate a 9.1 short without losing the maximum of the previous candle, the sale occurs at the loss of its minimum;
3) The stop loss is positioned at the maximum of the candle in step 2.
PORTUGUÊS
Os setups da média móvel exponencial de 9 períodos são simples e eficientes em ativos em tendência de alta ou de baixa. Sua criação é atribuída ao trader Larry Williams . No Brasil é amplamente divulgado pelo trader Alexandre Fernandes (Palex).
Esse indicador foi criado para mostrar o setup que surgiu em cada candle e uma seta mostra a direção que deve ser feita operação (seta para cima, compra, e seta para baixo, venda).
Abaixo temos as regras que descreve cada setup.
Setup 9.1 de compra
1) A MME9 está descendente;
2) O candle que mudar a direção da média para cima, após o seu fechamento, ativa o setup, se sua máxima for rompida é ativada a compra;
3) O stop loss é posicionado abaixo da mínima do candle do passo 2.
Setup 9.1 de venda
1) A MME9 está ascendente;
2) O candle que mudar a direção da média para baixo, após o seu fechamento, ativa o setup, se sua mínima for perdida é ativada a venda;
3) O stop loss é posicionado acima da máxima do candle do passo 2.
Setup 9.2 de compra
1) A MME9 está ascendente;
2) O candle atual deve fechar abaixo da mínima do candle anterior, se sua máxima for rompida é ativada a compra;
4) Caso a máxima do candle do passo 2 não seja rompida, a compra o ocorrerá no rompimento da máxima do candle seguinte;
5) O stop loss é posicionado abaixo da mínima do candle do passo 2 ou do passo 3.
Setup 9.2 de venda
1) A MME9 está descendente;
2) O candle atual deve fechar acima da máxima do candle anterior, se sua mínima for perdida é ativada a venda;
4) Caso a mínima do candle do passo 2 não seja perdida, a venda ocorrerá no rompimento da mínima do candle seguinte;
5) O stop loss é posicionado na acima da máxima do candle do passo 2 ou do passo 3.
Setup 9.3 de compra
1) A MME9 está ascendente;
2) Um candle de referência deve seguido por dois fechamentos seguidos abaixo do seu fechamento, a compra ocorre no rompimento da máxima do último candle;
3) Se a última máxima não for rompida, a compra ocorre no rompimento da máxima do candle seguinte;
4) O stop loss é posicionado abaixo da mínima do candle do passo 2 ou do passo 3;
Setup 9.3 de venda
1) A MME9 está descendente;
2) Um candle de referência deve seguido por dois fechamentos seguidos acima do seu fechamento, a venda ocorre no rompimento da mínima do último candle;
3) Se a última mínima não for rompida, a venda ocorre no rompimento da mínima do candle seguinte;
4) O stop loss é posicionado acima da máxima do candle do passo 2 ou do passo 3;
Setup 9.4 de compra
1) Um candle gera um 9.1 de venda;
2) O candle seguinte deve gerar um 9.1 de compra sem perder a mínima do candle anterior, a compra ocorre no rompimento da sua máxima;
3) O stop loss é posicionado na mínima do candle do passo 2.
Setup 9.4 de venda
1) Um candle gerar um 9.1 de compra;
2) O candle seguinte deve gerar um 9.1 de venda sem perder a máxima do candle anterior, a venda ocorre na perda da sua mínima;
3) O stop loss é posicionado a máxima do candle do passo 2.

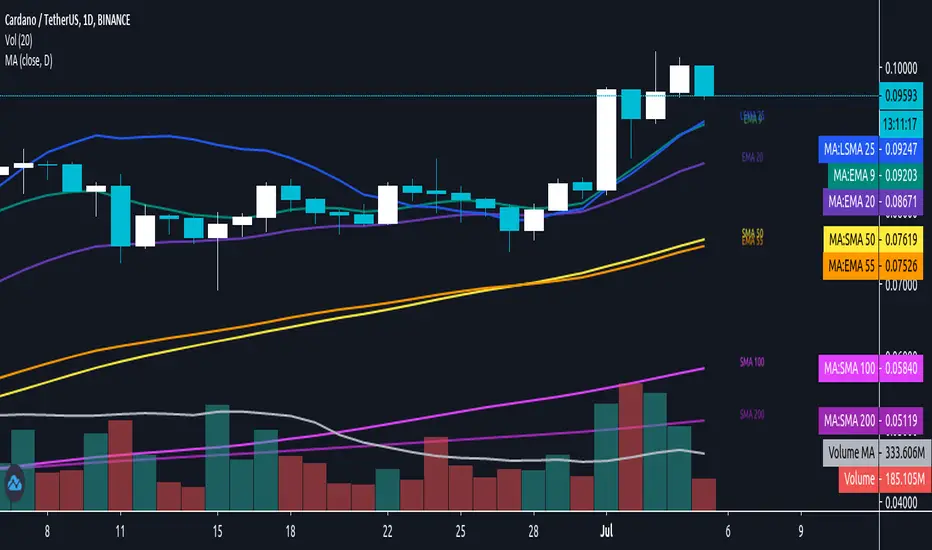
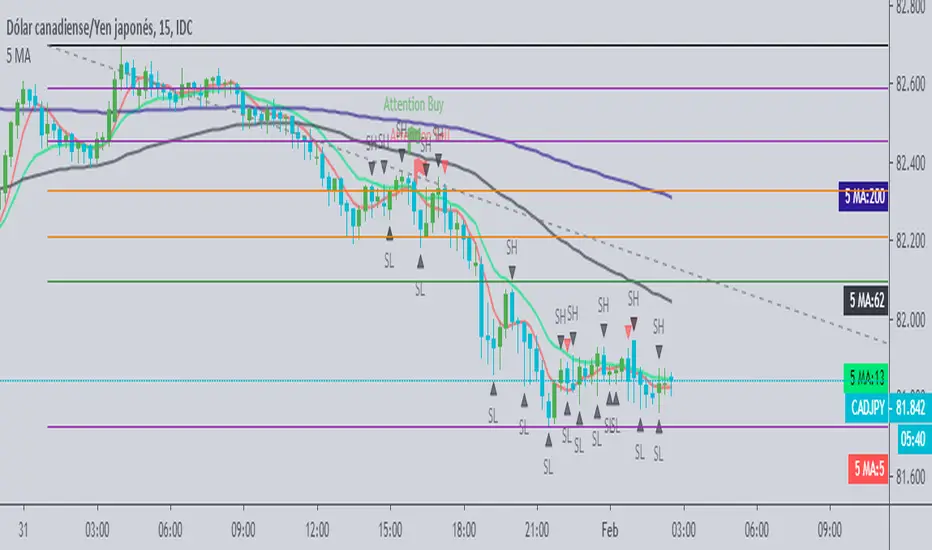
5 MAThis indicator can help you out to check for entry points, taking in concideracion ema cross, providing you an alert before the entry and as doble check once you get the confirmation you will be able to put you order
SMA by KGS 5 MA's in 1 indicatorIn this indicator you can use 5 moving averages in a single indicator.
You can also adjust the moving averages time period and color code.
Turning on/off is also available as per your convenience.

Chingas EMA/MA - White BackgroundI use a lot of Black Background as well as a lot of White background charts. Therefor when I made the Black Background version, I'd have to change all the settings when I was on a White Background. And thus, the White Version was born!
Those who love their Dynamic Support and Resistance will hopefully find some value with this indicator.
This is not the end all be all EMA/MA but something that I wanted for myself and figured some other traders may like to use it as well.
I have one for BLACK Background as well and that has already beed posted.
By Default I have the following EMAs:
9
21
50
70
100
200
By default I have the following SMAs:
20
50
100
200
350
www.dropbox.com
www.dropbox.com
If you go into your settings and select
INDICATOR NAME LABEL and
INDICATOR LAST VALUE
then you will be able to see a super easy and super clean representation on your scale for exactly which EMA/MA you want the value of.
www.dropbox.com
Obviously you can change the colors to whatever you want and you can change the source to whatever you want.
You can also change the length to whatever you want but the names are coded in. In other-words if you want to use a 99 EMA instead of a 100, you can change it to 99 from 100 BUT the name will always be 100.
Enjoy.
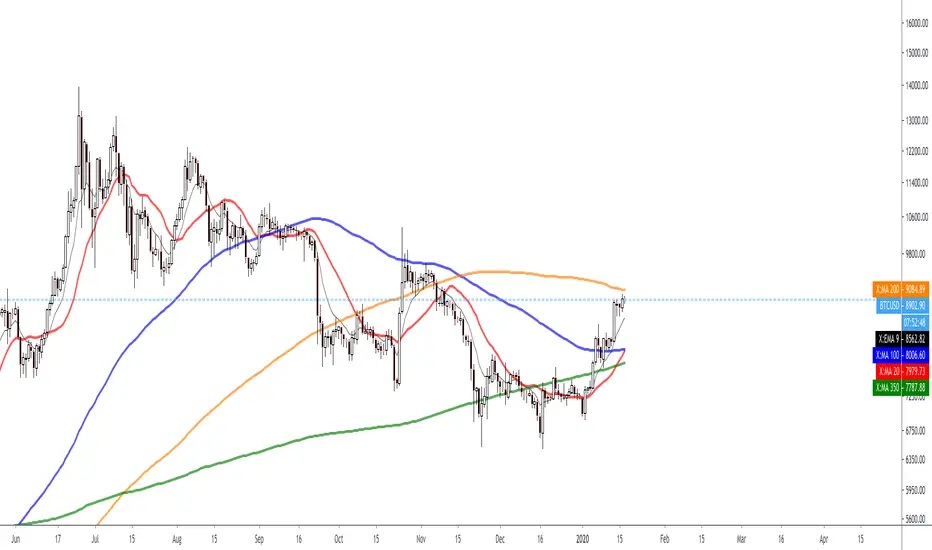
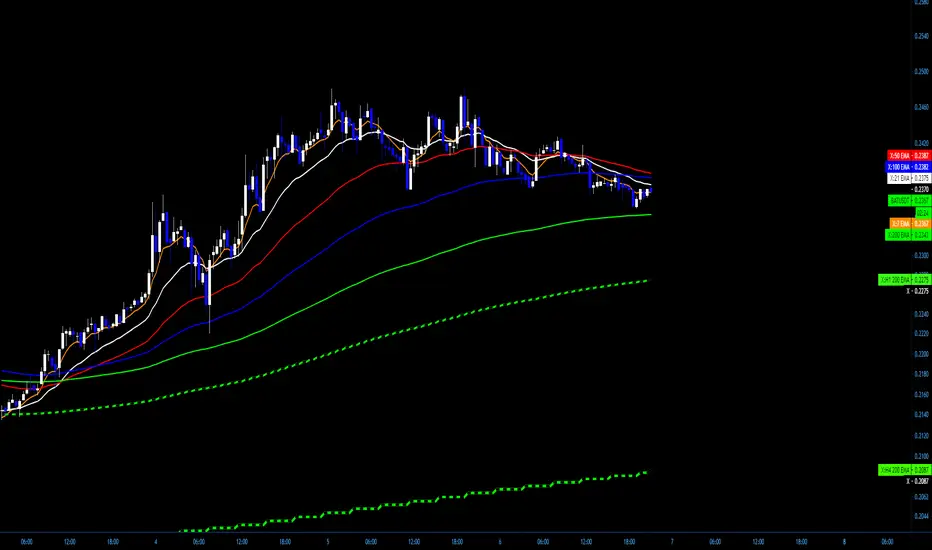
Chingas EMA/MA - Black BackgroundThose who love their Dynamic Support and Resistance will hopefully find some value with this indicator.
This is not the end all be all EMA/MA but something that I wanted for myself and figured some other traders may like to use it as well.
I have one for WHITE Background as well and I'll post that shortly.
By Default I have the following EMAs:
9
21
50
70
100
200
By default I have the following SMAs:
20
50
100
200
350
www.dropbox.com
www.dropbox.com
If you go into your settings and select INDICATOR NAME LABEL and INDICATOR LAST VALUE then you will be able to see a super easy and super clean representation on your scale for exactly which EMA/MA you want the value of.
www.dropbox.com
Obviously you can change the colors to whatever you want and you can change the source to whatever you want.
You can also change the length to whatever you want but the names are coded in. In other-words if you want to use a 99 EMA instead of a 100, you can change it to 99 from 100 BUT the name will always be 100.
Enjoy.

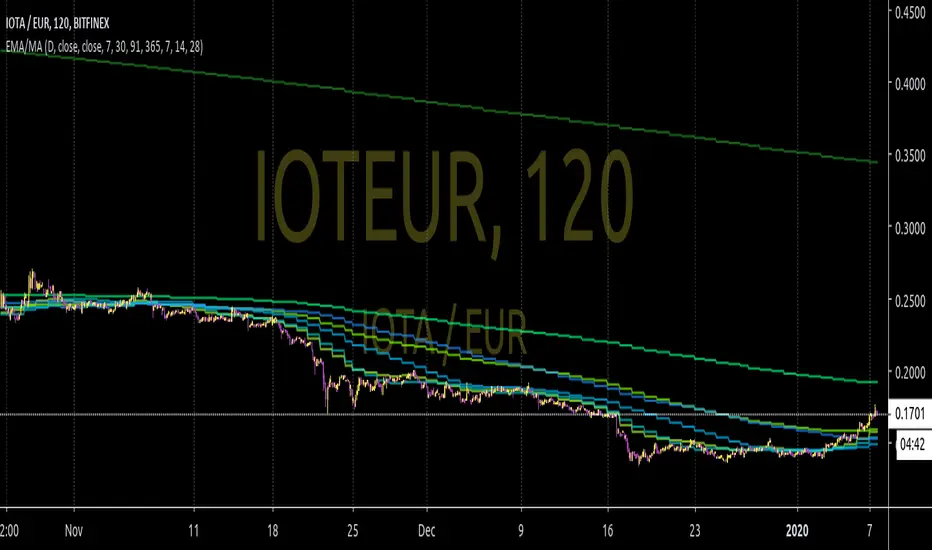
Multi EMA/MA with fixed timeframe by TopsyKrettThis script shows several EMAs and MAs, fully editable
The moving averages dont change when changing candlelength
Unedited it gives:
- 4 EMA (weekly, monthly, quarterly, anual)
- 3 MA (7day, 14day, 28day)
based on daily close
In the script are two additional EMAs and MAs mutet, easy to activate with pine editor