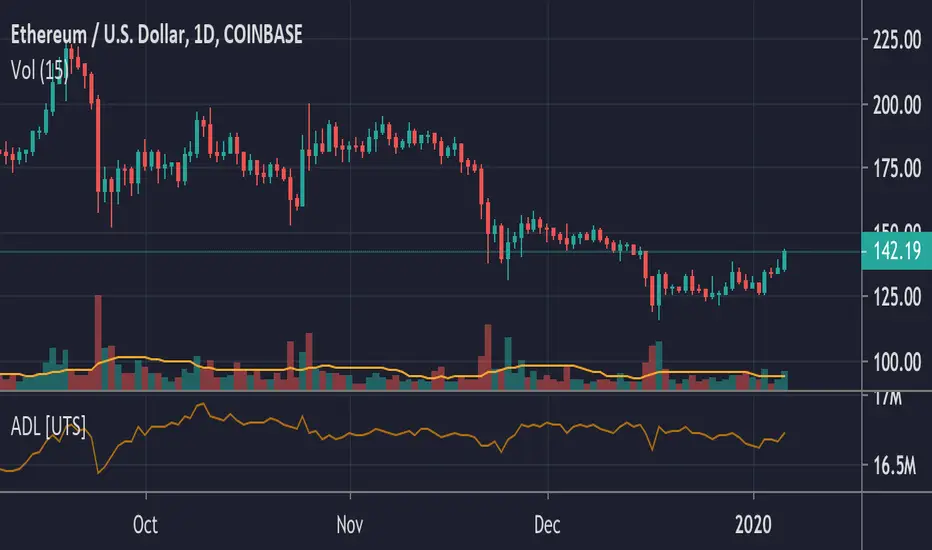
ADL - Accumulation Distribution Line [UTS]an underlying asset.
It is determined by the changes in price and volume. The volume acts as a weighting coefficient at the change of price — the higher the coefficient (the volume) is the greater the contribution of the price change (for this period of time) will be in the value of the indicator. The indicator is also known as Accumulation / Distribution Index.
Common known variants of this type of indicator are the On Balance Volume, Chaikin Oscillator or Chaikin Money Flow.
Based on www.metatrader5.com
FLOW
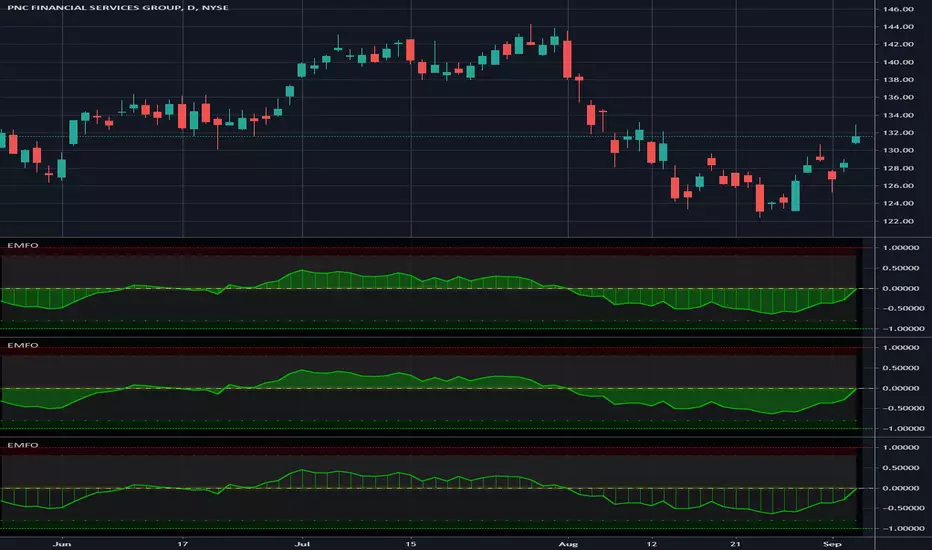
Enhanced Money Flow Oscillator - Vitali ApirineThis is my "Enhanced Money Flow Oscillator" indicator using Pine Script version 4.0, freely available to ALL! This originates from an October 2015 TASC magazine article written by Vitali Apirine. While the original was simplistically designed, I enhanced it by adding a multitude of features listed below.
Note: This script has volume detection built-in. When no volume is available, the background color will be overwhelmingly red AND the indicator will cease to function. At a minimal, this script can used to detect when volume is available in an asset or when it is not.
Features List Includes:
I.P.O.C.S.(Initial Public Offering Clean Start) Technology
Enable/disable dark background for enhanced visibility
"Period" adjustment
"Line Width" adjustment
"Display Area" selection for visual mutations displayed above
Ranges and thresholds are enable/disable capable
Upper threshold adjustment
Red/green secondary range that adjusts +/- from the upper/lower thresholds
Lower threshold adjustment
Adjustable centered medial zone
The comments section below is solely just for commenting and other remarks, ideas, compliments, etc... regarding only this indicator, not others. If you do have any questions or comments regarding this indicator, I will consider your inquiries, thoughts, and ideas presented below in the comments section, when time provides it. When my indicators achieve more prevalent use by TV members, I will implement more ideas when they present themselves as worthy additions. As always, "Like" it if you simply just like it with a proper thumbs up, and also return to my scripts list occasionally for additional postings. Have a profitable future everyone!
Volume Flow v3 (Rescaled Update)This is a rescaled version of the script (www.tradingview.com...) by oh92. Rescaling allows to represent data in a more contrastive way. All thanks, bells and whistles are to be attributed to the author.))

Volume Based Color Bar (VBCB)Português/English
Pt:
Esse indicador colore as barras ou candles de acordo com o volume de negociação daquela barra em comparação ao volume médio. A codificação é a seguinte:
Barras de alta (Fechamento>Abertura):
- Cor da barra por default: Sem volume expressivo
- Verde: volume acima da Média.
- Azul: volume bem acima da média.
- Amarelo: volume muito acima da média.
Barras de baixa (FechamentoOpen):
- Bar color by default: No expressive volume
- Green: volume above average.
- Blue: volume well above average.
- Yellow: volume way above average.
Bearish bars (Close
Chaikin Money FlowThis script plots the original Chaikin Money Flow in addition of highlighting positive/negative pressure areas.

Stoch Money Flow (ADMF) & Absolute Strength Index (ASI) [cI8DH]This indicator can apply my previous indicator, Historical and Standard Stochastic, to Money Flow (ADMF) or Absolute Strength Index (ASI) or both at the same time. It can also display those two indicators in regular mode as well as showing visual cues when the indicators make new ATH or ATL.
ASI is basically a new name I am giving to my Gain/Loss Moving Average indicator. If you normalize ASI with the moving average of all the changes in price, it becomes identical to RSI. So ASI is basically non-normalized RSI, that is why it should be a more accurate representation of price momentum.
ADMF is an accumulation/distribution and money flow momentum indicator. Both ASI and ADMF are not range-bound so it is not easy to compare them against each other. When stochastic equation is applied to them, they both become range-bound and comparable. The gaps between the two indicator can reveal valuable information about market dynamics. The chart below shows some examples (note the settings).
For conventional usages of stochastic, please read www.tradingview.com(STOCH) and www.tradingview.com(STOCH_RSI). I recommend you to find the optimal length by playing with the stoch length in the indicator settings. If this parameter is calibrated properly, this indicator can be a powerful tool for identifying market cycle.
You can get these features ( ATH , ATL detection and historical stochastic) for any other indicator using the script below:

Twiggs Money Flow Fisher Transform// Credits to @LazyBear
// This is an experimental indicator (Originaly coded by Lazybear) modified by @haidinurhasfi by applying the Fisher Transform to Twiggs Money Flow.
// Tune the length according to your trading style and instrument
DepthHouse MTF Volume FlowDepthHouse MTF Volume Flow Indicator is an amazing tool used to help determine market direction on multiple time-frames based on the the traded volume.
This indicator is a superb upgrade to my original volume flow indicators.
You now how the option to adjust the displayed volume timeframe, which in turn adjusts the Volume Flow Moving Averages , along with the new Breakout Candle feature.
Additionally, the background colors represent the volume flow crossovers on the primary time-frame, along with three addition time-frames that are user adjustable.
The primary volume flow crossover is shown on the top of the grid, followed by the First Additional Time Frame and then so on down to the bottom.
I generally have this set with the lowest timeframe value at the top, followed by the next one in line.
For those of you who wish to set the current timeframe greater than the rest. I have built in a grid separator feature which will separate it from the rest of the background crossovers.
My MA Settings:
I generally have my Moving Averages set anywhere from 7-14
Breakout Factor:
I generally have the breakout factor set at 1.5 or 2.5
Note: Since volume amounts vary across the board. The background height is set to readjust based on the highest bars. This lookback amount is adjustable by the user and it does not affect calculations what so ever.
How to get:
As you can see this is an invite only script. In the coming month this indicator, along with many others will become pay to use only. (website on my profile page)
However all my indicators will be FREE until May 1, 2018 . So please try them out!
To take advantage of this FREE trial:
1. Leave comment on this indicator post! Maybe even give me a follow :D
2. Check out and take advantage of all my other indicators!
I hope you all enjoy!

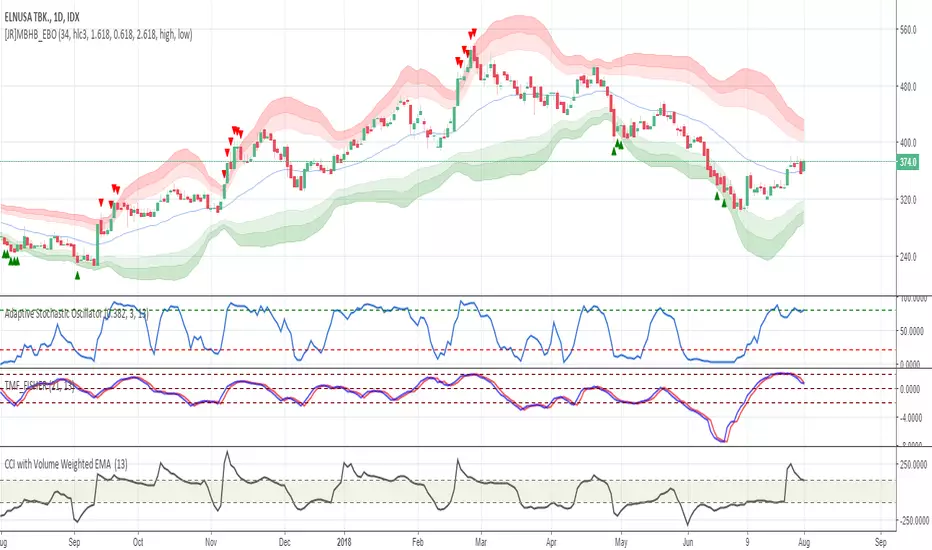
Flow of Fund Divergence with alertThe Flow of fund(FOF) divergence signal indicator consists of the following parts: The Flow of fund histogram, FOF trend line and divergence signal. The signal is instantly drawn on current bar and will not repaint.
HISTOGRAM shows an approximate amount of money get in or out of the market within 1 bar. If selling pressure is stronger than buying pressure, it will be a red histogram, otherwise, it will be a green histogram.
Flow of fund trend line indicates the short or long term movement of the flow, determined by the "Length of FOF" input you set.
Divergence
The divergence signal has two types, bearish and bullish.
A bullish divergence occurs when the price hit a lower low and the FOF line is in uptrend. A down arrow will be drawn above the current FOF line when there is a bearish divergence between FOF and price trend.
A bearish divergence occurs when the price hit a higher high and the FOF line is in downtrend. A up arrow will be drawn below price candle bar when there is a bullish divergence between FOF and price trend.

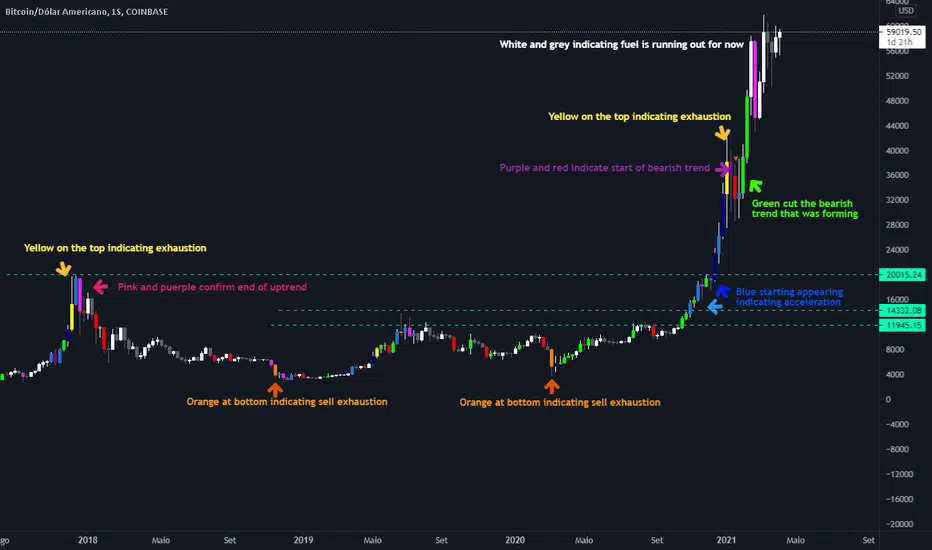
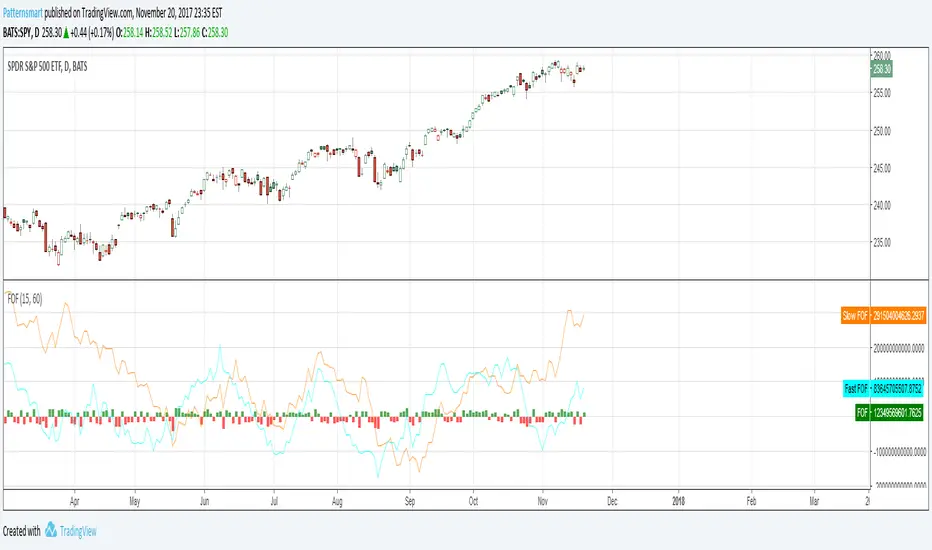
Flow of fund (FOF) indicator
Flow of fund (FOF) simply refers to the direction of money in the market. FOF indicator shows how the flow of funds impacts market price.
The idea of this indicator is very intuitive, prices raise when cash flowing into the market and drop when cash flowing out of market.
The calculation of FOF involves three basic but the most important elements of the financial market: TIME, PRICE and VOLUME.
Flow of fund indicator consists of two parts:
HISTOGRAM shows the total amount of money get in or out of the market within 1 bar.
If selling pressure is stronger than buying pressure, it will be a red bar,
otherwise, it will be a green bar.
Two Flow of fund trend lines, indicating the short and long term movement of money flow.
Fast trend line uses a shorter period of time.
Slow trend line uses a longer period of time.
The length of period of both trend line is adjustable by user.
The orange line in the images is slow FOF, the blue line is fast FOF.
It works within all time period (Tick, Minutes, Daily, Weekly, Monthly) with VOLUME.
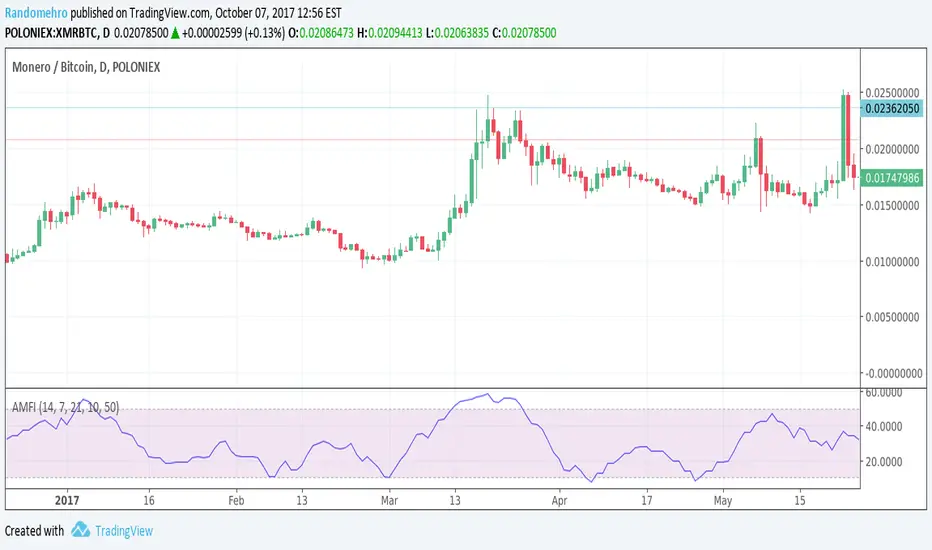
AMFI (Adjusted money flow indicator)Adjusted money flow indicator (AMFI)
Differences between AMFI and MFI:
- AMFI is weighted by the typical price SMA(shortterm)/SMA(longterm) ratio
- For AMFI the days with lower volume than previous but rising price are counter twice, similarly days with falling price and lower valume
Version: 1alpha
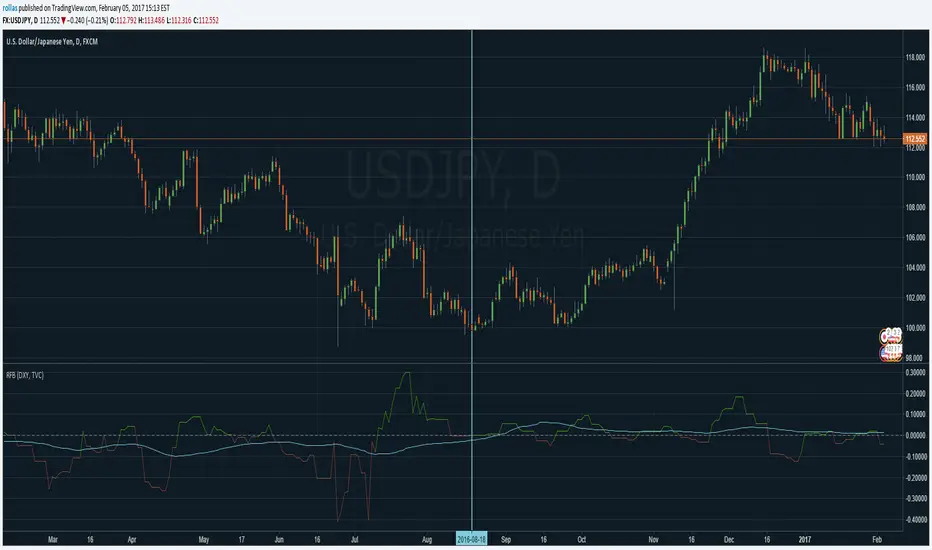
Free BirdShows the move of the symbol When not correlated with the source index. Gives the upward or downward tendency when symbol moves uncorrelated that can be used to determine the flow.
The flow curve gives an general idea while the move is more precise showing pure price action.
Gain Over LossSelf adjusting gain over loss indicator. Shows price movement and momentum. If you want to reach to the parameters you can use the old version.

Ro Hidden Volatility OverlayWorks only on Forex pairs. See the inside bar volatility. Use precision to get data from lower time frames. Be aware that script initialization will be slower with the precision going higher. Added an option to show average volatility for long term as forex market transactions grow rapidly, suppressing all other markets. Bar color changes to green when volatility exceeds average.

Ro Hidden Volatility V2.0Works only on Forex pairs. See the inside bar volatility. Use precision to get data from lower time frames. Be aware that script initialization will be slower with the precision going higher. Added an option to show average volatility for long term as forex market transactions grow rapidly, suppressing all other markets.
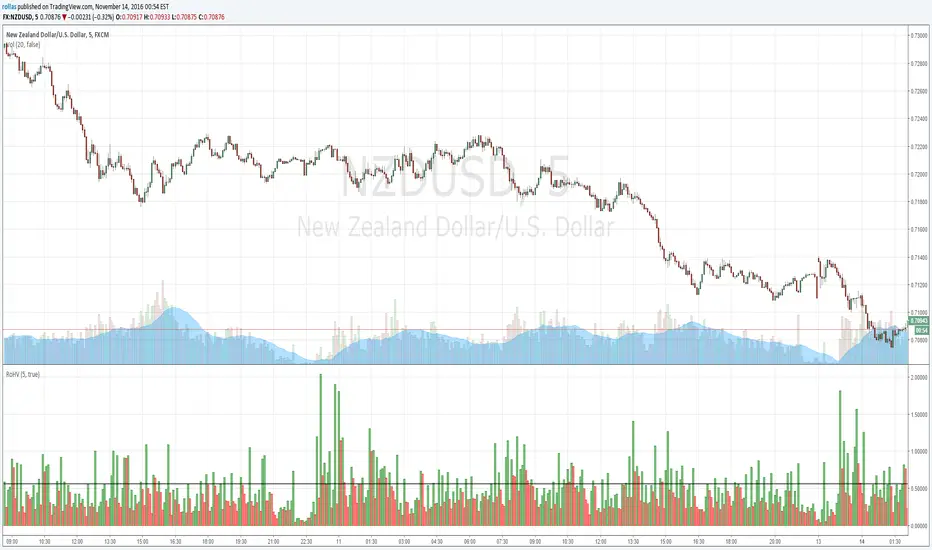
Ro Hidden VolatilityWorks only on Forex pairs. See the inside bar volatility. Use precision to get data from lower time frames. Be aware that script initialization will be slower with the precision going higher.
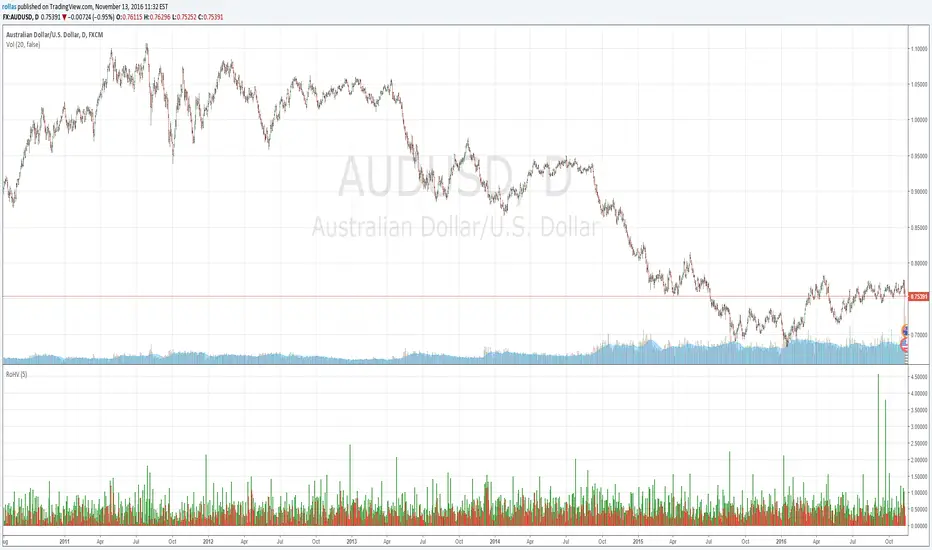
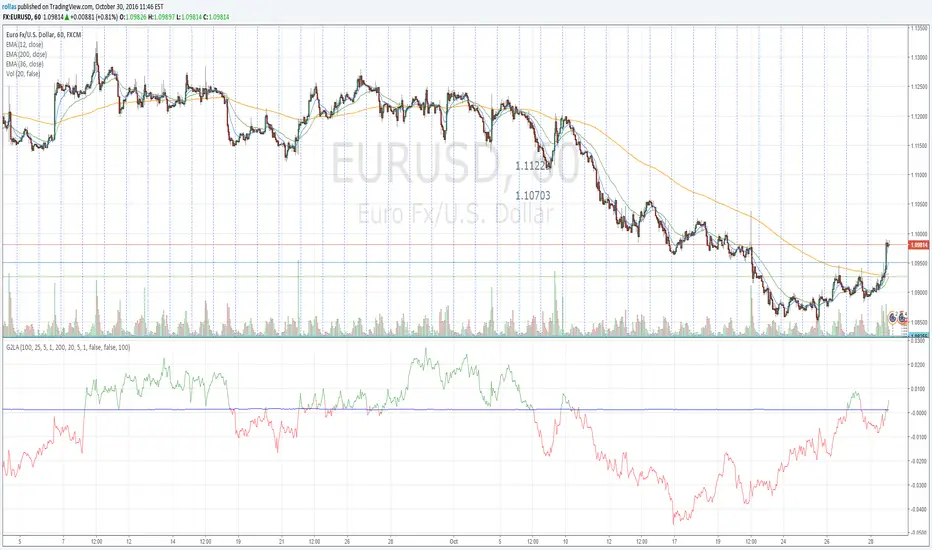
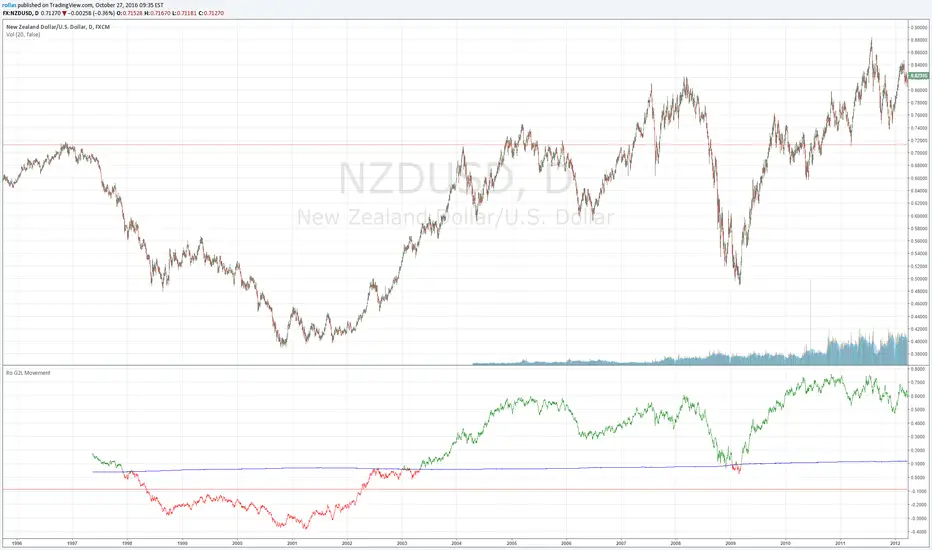
Ro G2L AdvancedGain over Loss Movement indicator with adjustable parameters. Also added an option to show cumulative gain/loss graph.
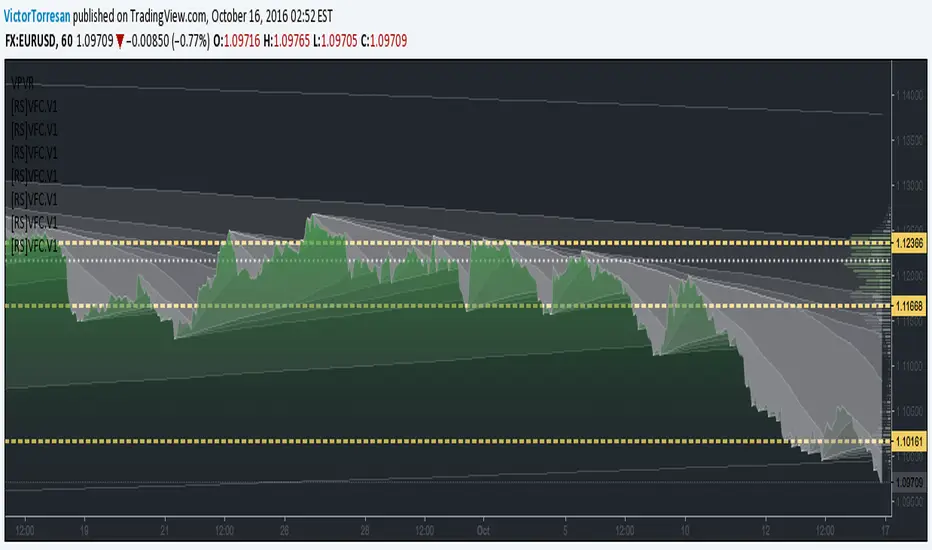

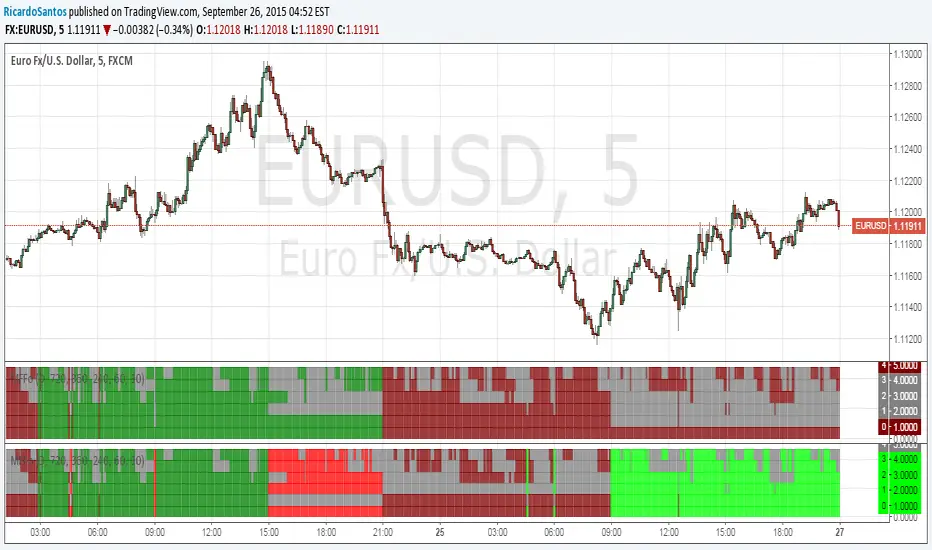
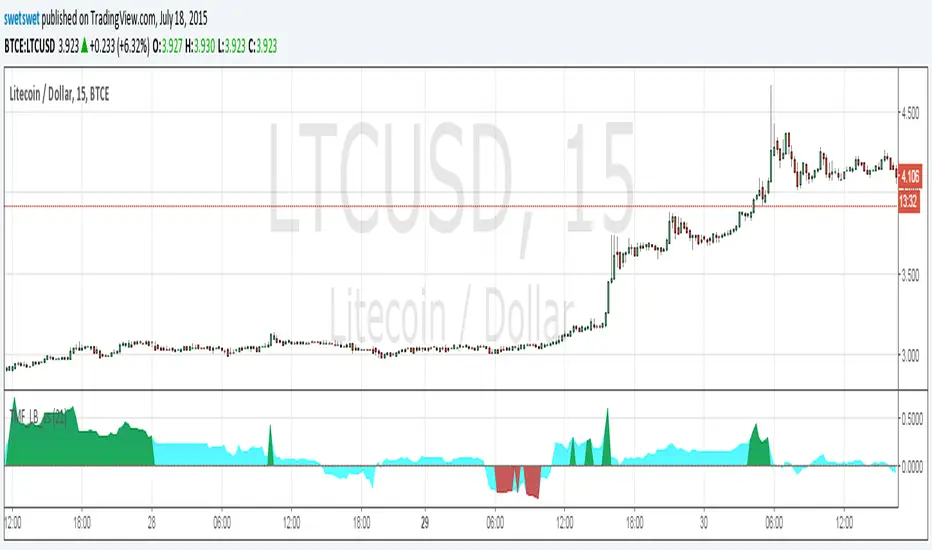
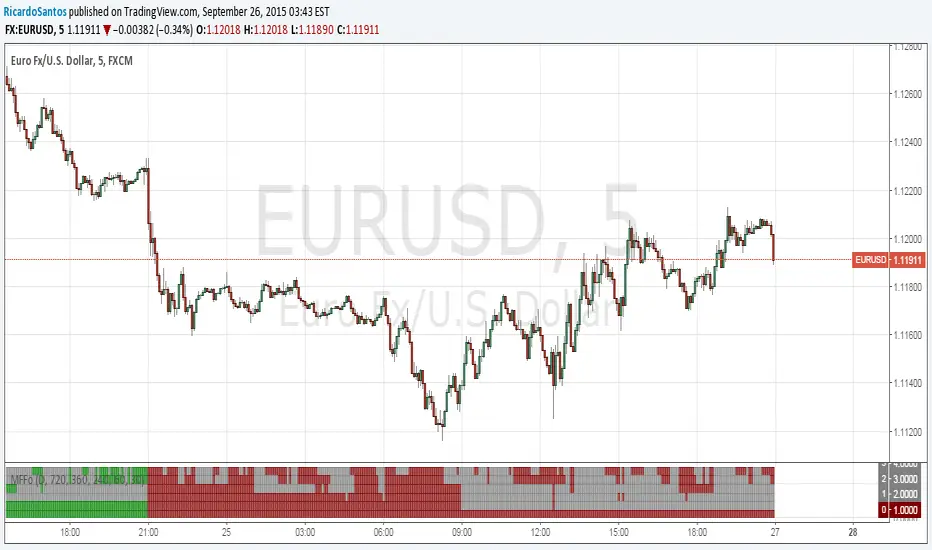
[RS]Market Fractility Flow Oscillator V0EXPERIMENTAL:
same as MTF-BIAS. but slightly more practical, reads market fractality flow into a oscillator.
Twiggs Money Flow_LB [SwetSwet]The modified indicator Twiggs Money Flow more convenient. The critical value is colored in green or red.