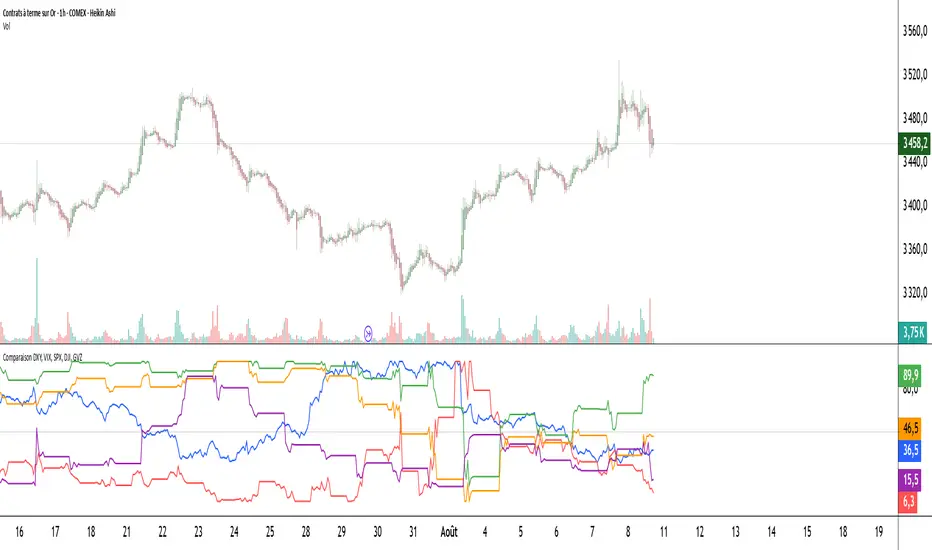
Comparaison DXY, VIX, SPX, DJI, GVZPine Script indicator compares the normalized values of DXY, VIX, SPX, DJI, and GVZ indices on a single scale from 0 to 100. Here's a breakdown of what it does:
Data Requests: Gets closing prices for:
US Dollar Index (DXY)
VIX Volatility Index
S&P 500 (SPX)
Dow Jones Industrial Average (DJI)
Gold Volatility Index (GVZ)
Normalization: Each index is normalized using a 500-period lookback to scale values between 0-100, making them comparable despite different price scales.
Visualization:
Plots each normalized index with distinct colors
Adds a dotted midline at 50 for reference
Uses thicker linewidth (2) for better visibility
Timeframe Flexibility: Works on any chart timeframe since it uses timeframe.period
This is useful for:
Comparing relative strength/weakness between these key market indicators
Identifying divergences or convergences in their movements
Seeing how different asset classes (currencies, equities, volatility) relate
You could enhance this by:
Adding correlation calculations between pairs
Including options to adjust the normalization period
Adding alerts when instruments diverge beyond certain thresholds
Including volume or other metrics alongside price
Forecasting
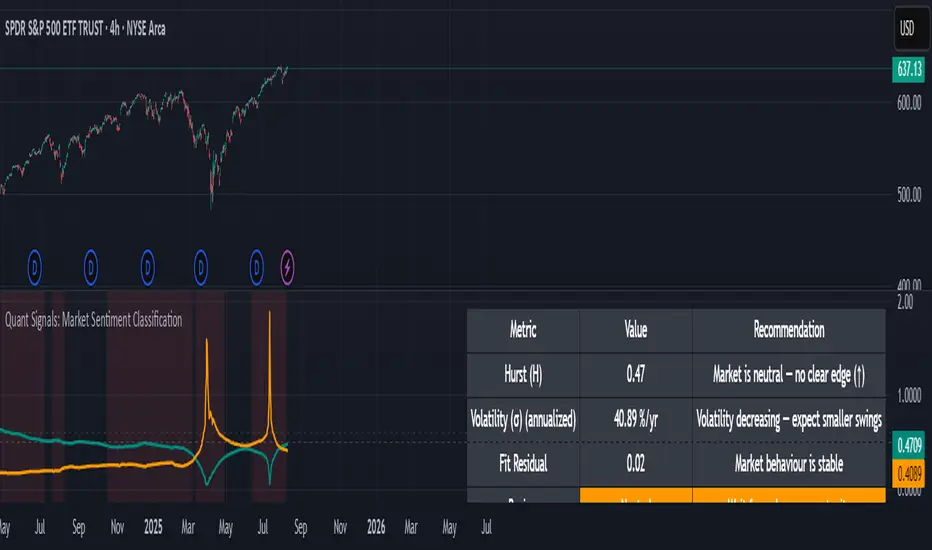
Quant Signals: Market Sentiment Monitor HUDWavelets & Scale Spectrum
This indicator is ideal for traders who adapt their strategy to market conditions — such as swing traders, intraday traders, and system developers.
Trend-followers can use it to confirm trending conditions before entering.
Mean-reversion traders can spot choppy markets where reversals are more likely.
Risk managers can monitor volatility shifts and regime changes to adjust position size or pause trading.
It works best as a market context filter — telling you the “weather” before you decide on the trade.
Wavelets are like tiny “measuring rulers” for price changes. Instead of looking at the whole chart at once, a wavelet looks at differences in price over a specific time scale — for example, 2 bars, 4 bars, 8 bars, and so on.
The scale spectrum is what you get when you measure volatility at several of these scales and then plot them against scale size.
If the spectrum forms a straight line on a log–log chart, it means price changes follow a consistent pattern across time scales (a power-law relationship).
The slope of that line gives the Hurst exponent (H) — telling you whether moves tend to persist (trend) or reverse (mean-revert).
The height of the line gives you the volatility (σ) — the average size of moves.
This approach works like a microscope, revealing whether the market’s behaviour is consistent across short-term and long-term horizons, and when that behaviour changes.
This tool applies a wavelet-based scale-spectrum analysis to price data to estimate three key market state measures inside a rolling window:
Hurst exponent (H) — measures persistence in price moves:
H > ~0.55 → market is trending (moves tend to continue).
H < ~0.45 → market is choppy/mean-reverting (moves tend to reverse).
Values near 0.5 indicate a neutral, random-walk-like regime.
Volatility (σ) — the average size of price swings at your chart’s timeframe, optionally annualized. Rising volatility means larger price moves, falling volatility means smaller moves.
Fit residual — how well the observed multi-scale volatility fits a clean power-law line. Low residual = stable behaviour; high residual = structural change (possible regime shift).
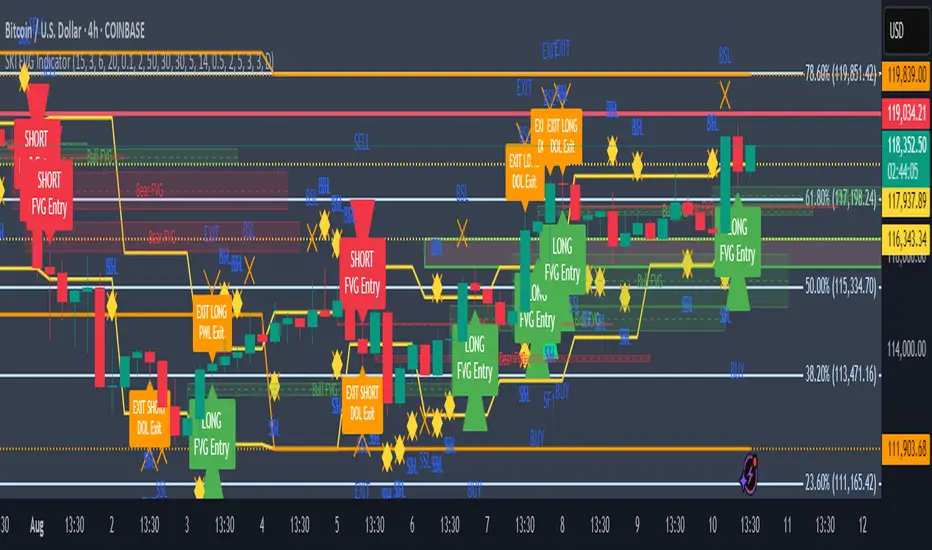
SKI FVG IndicatorIt uses ICT concepts and takes entries and exits. Identifies good FVG and shows an entry to buy or short and also exits at swing high or low , discount areas, primary areas, DOL (draw on liquidity)
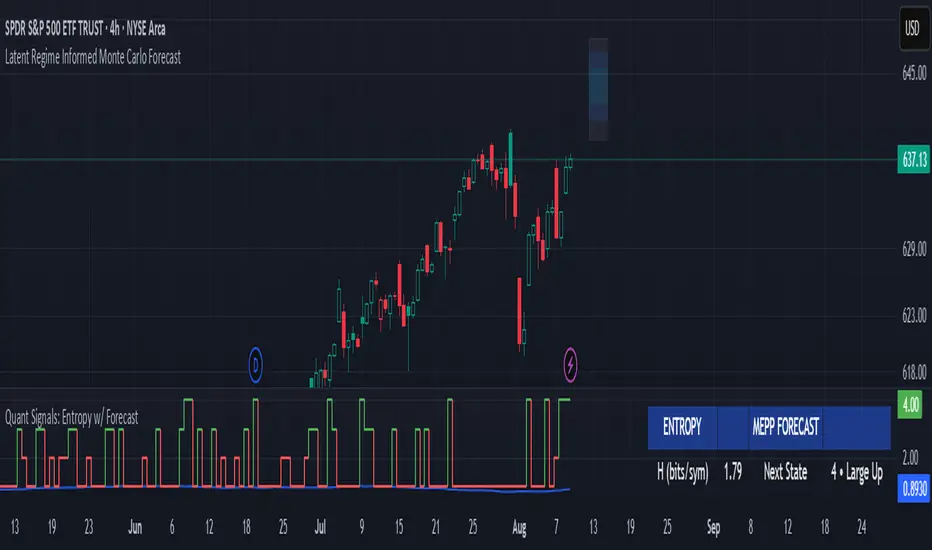
Quant Signals: Entropy w/ ForecastThis is the first of many quantitative signals I plan to create for TV users.
Most technical analysis (TA) tools—like moving averages, oscillators, or chart patterns—are heuristic: they’re based on visually identifiable shapes, threshold crossovers, or empirically chosen rules. These methods rarely quantify the information content or structural complexity of market data. By quantifying market predictability before making a forecast, this method filters out noise and focuses your trading only during statistically favorable conditions—something traditional TA cannot objectively measure.
This MEPP-based approach is quantitative and model-free:
It comes from information theory and measures Shannon entropy rate to assess how predictable the market is at any moment.
Instead of interpreting price formations, it uses a data-compression algorithm (Lempel–Ziv) to capture hidden structure in the sequence of returns.
Forecasts are generated using a principle from statistical physics (Maximum Entropy Production), not historical chart patterns.
In short, this method measures the market's predictability BEFORE deciding a directional forecast is worth trusting. This tool is to inform TA traders on the market's current regime, whether it is smooth and predictable or it is volatile and turbulent.
Technical Introduction:
In information theory, Shannon entropy measures the uncertainty (or information content) in a sequence of data. For markets, the entropy rate captures how much new information price returns generate over time:
Low entropy rate → price changes are more structured and predictable.
High entropy rate → price changes are more random and unpredictable.
By discretizing recent returns into quartile-based states, this indicator:
Calculates the normalized entropy rate as a regime filter.
Uses MEPP to forecast the next state that maximizes entropy production.
Displays both the regime status (predictable vs chaotic) and the forecast bias (bullish/bearish) in a dashboard.
Measurements & How to Use Them
TLDR: HIGH ENTROPY -> information generation/market shift -> Don't trust forecast/strategy
1. H (bits/sym)
Shannon entropy rate of the last μ discrete returns, in bits per symbol (0–2).
Lower → more predictable; higher → more random.
Use as a raw measure of market structure.
2. H_max (log₂Ω)
Theoretical maximum entropy for Ω states. Here Ω = 4 → H_max = 2.0 bits.
Reference value for normalization.
3. Entropy (norm)
H / H_max, scaled between 0 and 1.
< 0.5–0.6 → predictable regime; > 0.6 → chaotic regime.
Main regime filter — forecasts are more reliable when below your threshold.
4. Regime
Label based on Entropy (norm) vs your entThresh.
LOW (predictable) = higher odds forecast will be correct.
HIGH (chaotic) = forecasts less reliable.
5. Next State (MEPP Forecast)
Discrete return state (1–4) predicted to occur next, chosen to maximize entropy production:
Large Down (strong bearish)
Small Down (mild bearish)
Small Up (mild bullish)
Large Up (strong bullish)
Use as your bias direction.
6. Bias
Simplified label from the Next State:
States 1–2 = Bearish bias (red)
States 3–4 = Bullish bias (green)
Align strategy direction with bias only in LOW regime.
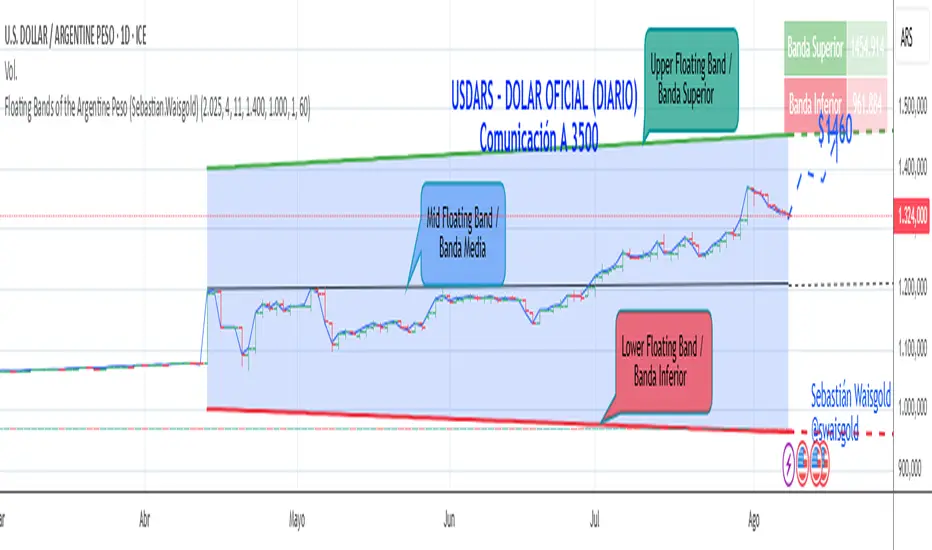
Floating Bands of the Argentine Peso (Sebastian.Waisgold)
The BCRA ( Central Bank of the Argentine Republic ) announced that as of Monday, April 15, 2025, the Argentine Peso (USDARS) will float within a system of divergent exchange rate bands.
The upper band was set at ARS 1400 per USD on 15/04/2025, with a +1% monthly adjustment distributed daily, rising by a fraction each day.
The lower band was set at ARS 1000 per USD on 15/04/2025, with a –1% monthly adjustment distributed daily, falling by a fraction each day.
This indicator is crucial for anyone trading USDARS, since the BCRA will only intervene in these situations:
- Selling : if the Peso depreciates against the USD above the upper band .
- Buying : if the Peso appreciates against the USD below the lower band .
Therefore, this indicator can be used as follows:
- If USDARS is above the upper band , it is “expensive” and you may sell .
- If USDARS is below the lower band , it is “cheap” and you may buy .
It can also be applied to other assets such as:
- USDTARS
- Dollar Cable / CCL (Contado con Liquidación) , derived from the BCBA:YPFD / NYSE:YPF ratio.
A mid band —exactly halfway between the upper and lower bands—has also been added.
Once added, the indicator should look like this:
In the following image you can see:
- Upper Floating Band
- Lower Floating Band
- Mid Floating Band
User Configuration
By double-clicking any line you can adjust:
- Start day (Dia de incio), month (Mes de inicio), and year (Año de inicio)
- Initial upper band value (Valor inicial banda superior)
- Initial lower band value (Valor inicial banda inferior)
- Monthly rate Tasa mensual %)
It is recommended not to modify these settings for the Argentine Peso, as they reflect the BCRA’s official framework. However, you may customize them—and the line colors—for other assets or currencies implementing a similar band scheme.
Painel Técnico — Múltiplos TFs (5m,15m,1h,4h,1D) BrenoGtechnical table with inflection points that help me buy

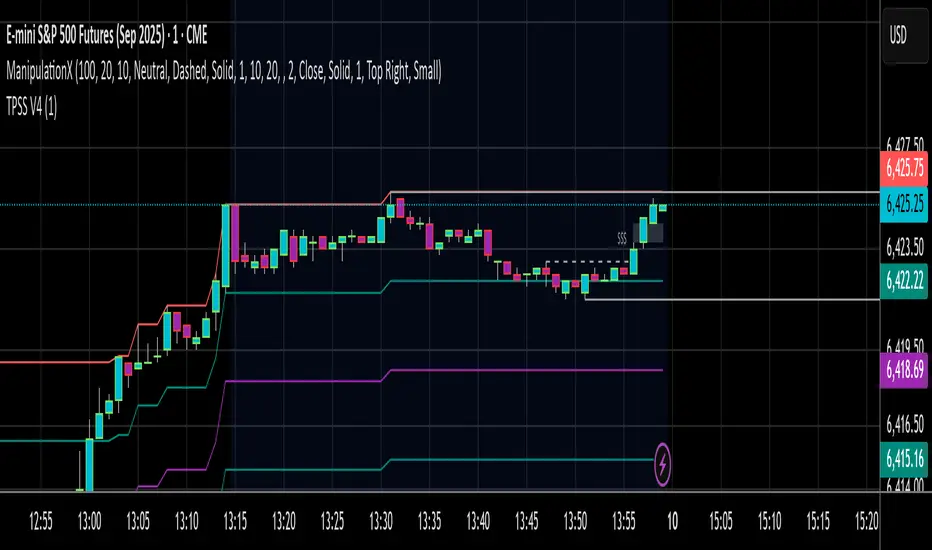
TAKEPROFITS SECRET SAUCE V4Plots daily 4hr 1kr and 15min levels
adjustable colors
This indicator auto plots for you
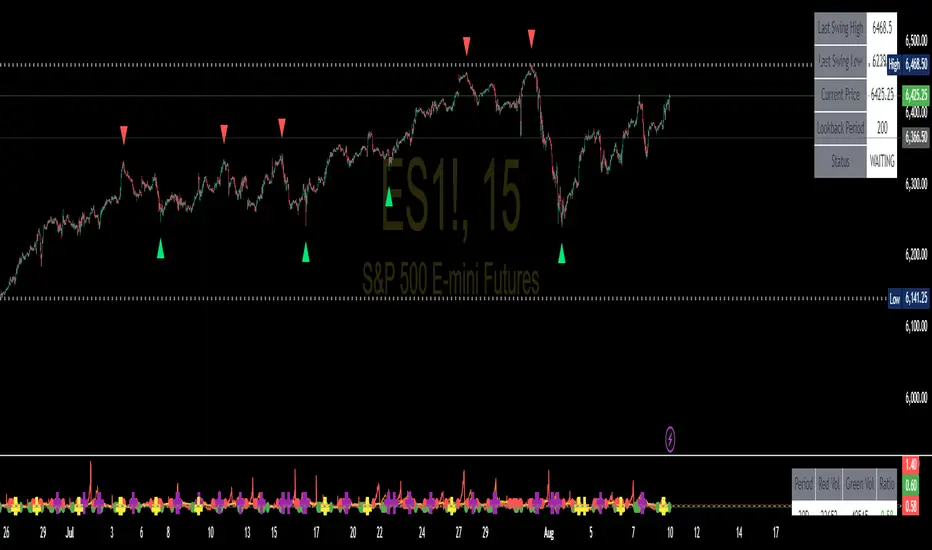
Swing High/Low SignalsSwing High/Low Signals – profit gang
Quickly spot recent market turning points with this clean swing high/low indicator.
Marks swing highs & lows with labels or triangles
Optional connecting lines & background highlights
Alerts when new swings form
Info table showing last swing levels & current price
Fully adjustable lookback period for any timeframe.
Disclaimer: For educational use only. Not financial advice.
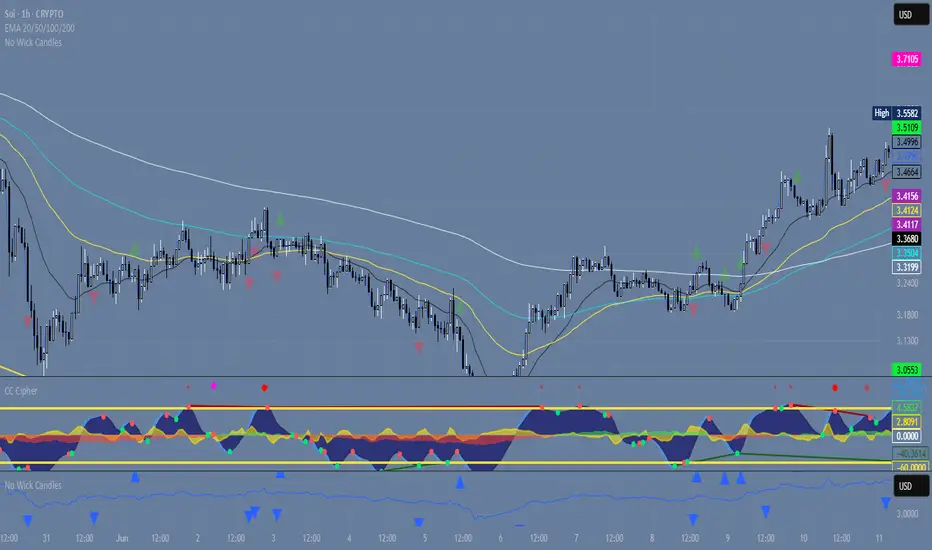
Wickless Precision IndicatorThe Wickless Precision Indicator is a powerful tool designed to identify and highlight wickless and tailless candlestick patterns on your TradingView charts. A wickless candle, where the open or close price equals the high or low, signals strong directional momentum and potential support or resistance levels. This indicator automatically detects these unique candles, drawing customizable horizontal lines at their key price levels to help traders spot critical zones for entries, exits, or reversals.
Key Features:
Automatic Wickless Detection: Identifies bullish (no lower wick) and bearish (no upper wick) candles with precision.
Dynamic Line Plotting: Draws horizontal lines at the high or low of wickless candles, extending until price interaction or user-defined conditions.
Customizable Settings: Adjust line styles, colors, and sensitivity thresholds to suit your trading style.
Visual Markers: Highlights wickless candles with distinct shapes (e.g., triangles or crosses) for easy identification.
Alert Integration: Set real-time alerts to stay notified when wickless candles form, ensuring you never miss a potential trading opportunity.
Use Cases:
Pinpoint strong support/resistance zones where price rejection is evident.
Identify high-probability entry or exit points based on momentum-driven candles.
Enhance price action strategies with clear visual cues for market sentiment shifts.
Perfect for traders seeking to capitalize on clean, wickless price movements, the Wickless Precision Indicator simplifies technical analysis and boosts trading confidence.
CoinSidual SR Top3What it does
Plots up to 3 Resistance (red) and 3 Support (green) zones using confirmed swing highs/lows. Nearby levels are clustered by tolerance (bps) to avoid duplicates. Lines extend left/right and auto-update.
Inputs
• Swing Length – pivot lookback/forward
• Lookback Bars – analysis window size
• Cluster Tolerance (bps) – merge distance
• Line Extend Bars – label/line span
• Show R/S Labels – toggle labels
Notes
Works on any symbol/timeframe. No alerts. For educational use only.
Entropy (Fiedor/Kontoyiannis) - Part 2 of Fiedor's TheoryThis indicator estimates the Shannon entropy of a price series using a Markov chain model of binary returns, following the approach of Fiedor (2014) and Kontoyiannis (1997).
% of Max shows current entropy as a percentage of its theoretical maximum (1 bit for binary up/down moves).
Percentile ranks the current entropy against historical values in the chosen lookback window.
High entropy suggests price movement is less predictable by frequentist models; low entropy implies more structure and predictability.
Use this as an informational oscillator, not a trading signal.
This is a visualization of Part 1 of Fiedor's Theory. The same entropy logic is already embedded in Part 1 however the second pane is a nice reminder of why it works.

GLD GC Price Converter Its primary function is to fetch the prices of the Gold ETF (ticker: GLD) and Gold Futures (ticker: GC1!) and then project significant price levels from one or both of these assets onto the chart of whatever instrument you are currently viewing.
Core Functionality & Features
Dual Asset Tracking: The script simultaneously tracks the prices of GLD and Gold Futures (GC).
Dynamic Price Level Projection: The script's main feature is its ability to calculate and draw horizontal price levels. It determines a "base price" (e.g., the nearest $100 level for GC) and then draws lines at specified increments above and below it. The key is that these levels are projected onto the current chart's price scale.
On-Chart Information Display:
Price Table: A customizable table can be displayed in any corner of the chart, showing the current prices of GLD and GC. It can also show the daily percentage change for GC, colored green for positive changes and red for negative ones.
Last Price Label: It can show a label next to the most recent price bar that displays the current prices of both GLD and GC.
Extensive Customization: The user has significant control over the indicator's appearance and behavior through the settings panel.
This includes:
Toggling the display for GLD and GC levels independently.
Adjusting the multiplier for the price levels (e.g., show levels every $100 or $50 for GC).
Changing the colors, line styles (solid, dashed, dotted), and horizontal offset for the labels.
Defining the number of price levels to display.
Controlling the text size for labels and the table.
Choosing whether the script updates on every tick or only once per candle close for better performance.

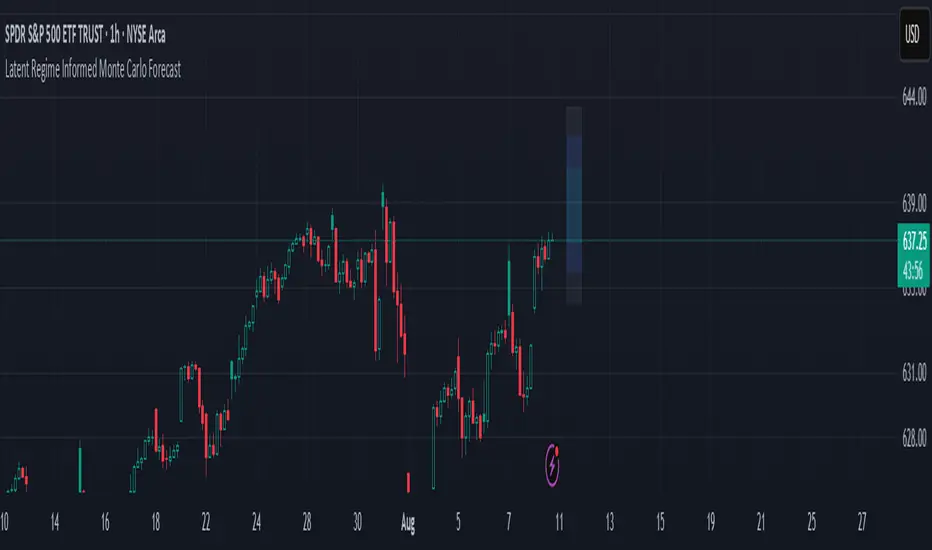
Latent Regime Informed Monte Carlo ForecastThis script uses a Monte Carlo simulation to forecast where price might be a set number of bars into the future (default 6 bars ahead). It generates hundreds of possible future price paths based on an average move (drift) and random shocks (volatility). The result is a distribution of outcomes, displayed as probability zones: the median (most likely), inner bands (50% confidence), and wider bands (80% and 95% confidence). Due to the randomness assumption in Monte Carlo simulations, the paths are not very important so to minimize cluttering on the graphs we only plot bands. These zones help you visualize uncertainty, set stops and targets based on probabilities, and spot when market behavior changes.
The accuracy of any Monte Carlo forecast depends heavily on how well you estimate trend and volatility. By default and no prior information the Monte Carlo simulation gives you a parabolic forecast that assumes absolute randomness. This is where the Kalman filter comes in. The filter (derived from control theory) aims to detect latent (unobservable) traits about the system by continuously updating its transition probabilities to better understand how the latent traits affect the observable measurement (price). With each new observable state we get better and better transition probabilities and enhances our understanding about the latent and unobservable market characteristics like trend and volatility. Both crucial measurements for short term market sentiment.
Extracting these measurements for market sentiment informs us how to better parametrize the Monte Carlo simulation for a better forecast. Each bar, the KF updates its estimates based on how close its last prediction was to reality. In calm periods, it holds estimates steady; in volatile periods, it adapts quickly. This gives you real-time, low-lag measurements of both trend and volatility.
By feeding these adaptive estimates into the Monte Carlo simulation, the forecast becomes much more responsive to current market conditions. In trends, the predicted paths tilt toward the direction of movement; in choppy markets, they spread wider but stay centered; when volatility spikes, the probability zones expand immediately. The result is a dynamic forecast tool that adjusts on every bar, giving you a clearer, probability-based picture of where the market could go next.
This is my very first script and I would love feedback/ideas for different topics.
My background is in economics/mathematics and interests lie in time series analysis/exploring financial features for DS
JOSITOThis indicator marks equal points that XAU will go to reach; it doesn’t work on other pairs, but on XAU it is quite accurate.
Preguntar a ChatGPT

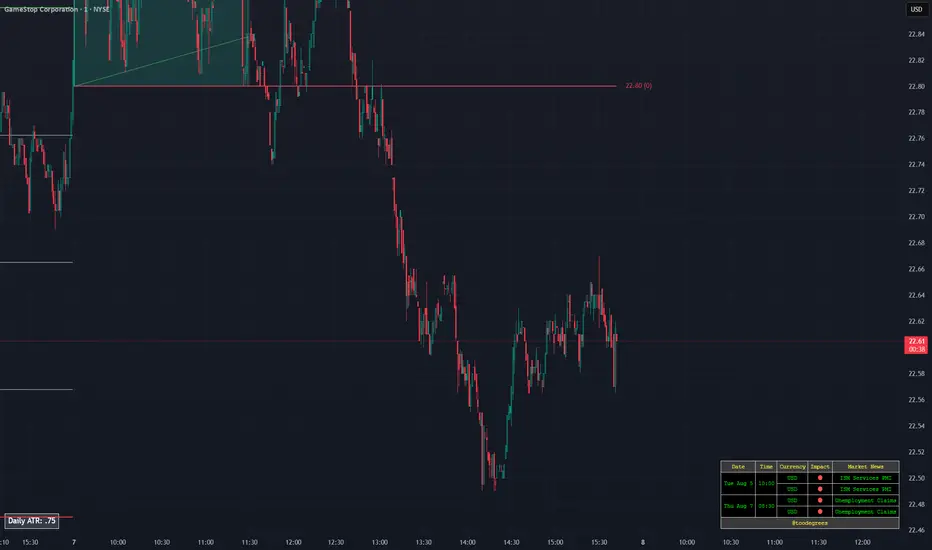
Thors Economic NewsThe Live Economic Calendar indicator seamlessly integrates with external news sources to provide real-Time, upcoming, and past financial news directly on your Tradingview chart.
By having a clear understanding of when news are planned to be released, as well as their respective impact, analysts can prepare their weeks and days in advance. These injections of volatility can be harnessed by analysts to support their thesis, or may want to be avoided to ensure higher probability market conditions. Fundamentals and news releases transcend the boundaries of technical analysis, as their effects are difficult to predict or estimate.
Designed for both novice and experienced traders, the Live Economic Calendar indicator enhances your analysis by keeping you informed of the latest and upcoming market-moving news.
ZoneShift+StochZ+LRO + AI Breakout Bands [Combined]This composite Pine Script brings together four powerful trend and momentum tools into a single, easy-to-read overlay:
ZoneShift
Computes a dynamic “zone” around price via an EMA/HMA midpoint ± average high-low range.
Flags flips when price closes convincingly above or below that zone, coloring candles and drawing the zone lines in bullish or bearish hues.
Stochastic Z-Score
Converts your chosen price series into a statistical Z-score, then runs a Stochastic oscillator on it and HMA-smooths the result.
Marks momentum flips in extreme over-sold (below –2) or over-bought (above +2) territory.
Linear Regression Oscillator (LRO)
Builds a bar-indexed linear regression, normalizes it to standard deviations, and shows area-style up/down coloring.
Highlights local reversals when the oscillator crosses its own look-back values, and optionally plots LRO-colored candles on price.
AI Breakout Bands (Kalman + KNN)
Applies a Kalman filter to price, smooths it further with a KNN-weighted average, then measures mean-absolute-error bands around that smoothed line.
Colors the Kalman trend line and bands for bullish/bearish breaks, giving you a data-driven channel to trade.
Composite Signals & Alerts
Whenever the ZoneShift flip, Stoch Z-Score flip, and LRO reversal all agree and price breaks the AI bands in the same direction, the script plots a clear ▲ (bull) or ▼ (bear) on the chart and fires an alert. This triple-confirmation approach helps you zero in on high-probability reversal points, filtering out noise and combining trend, momentum, and statistical breakout criteria into one unified signal.

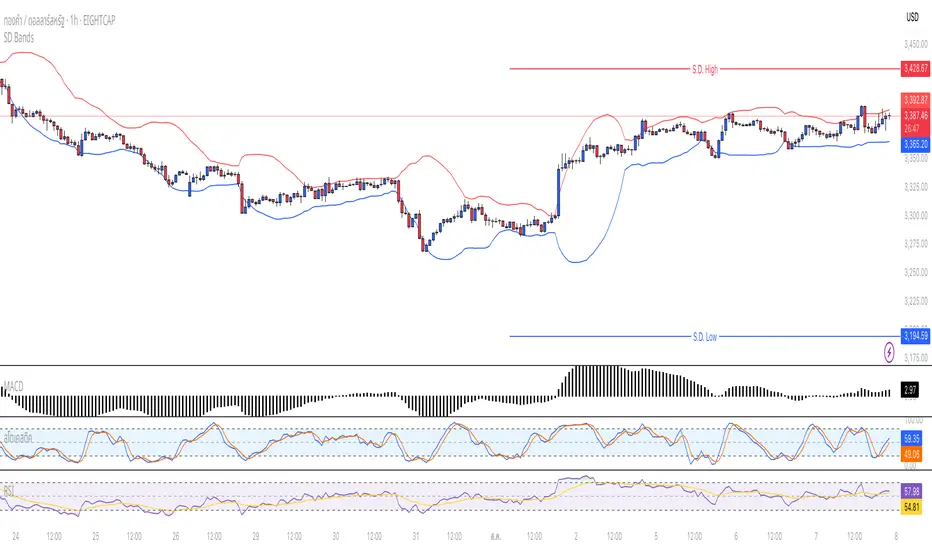
Standard Deviation BandsStandard Deviation Bands
คำอธิบายอินดิเคเตอร์:
อินดิเคเตอร์ SD Bands (Standard Deviation Bands) เป็นเครื่องมือวิเคราะห์ทางเทคนิคที่ออกแบบมาเพื่อวัดความผันผวนของราคาและระบุโอกาสในการเทรดที่อาจเกิดขึ้น อินดิเคเตอร์นี้จะแสดงผลเป็นเส้นขอบ 2 เส้นบนกราฟราคาโดยตรง โดยอ้างอิงจากค่าเฉลี่ยเคลื่อนที่ (Moving Average) และค่าส่วนเบี่ยงเบนมาตรฐาน (Standard Deviation)
* เส้นบน (Upper Band): แสดงระดับที่ราคาเคลื่อนไหวสูงกว่าค่าเฉลี่ย
* เส้นล่าง (Lower Band): แสดงระดับที่ราคาเคลื่อนไหวต่ำกว่าค่าเฉลี่ย
ความกว้างของช่องระหว่างเส้นทั้งสองบ่งบอกถึงระดับความผันผวนของตลาดในปัจจุบัน
วิธีการใช้งานอย่างละเอียด:
คุณสามารถนำอินดิเคเตอร์ SD Bands ไปประยุกต์ใช้ได้หลายวิธีเพื่อประกอบการตัดสินใจ ดังนี้:
1. การใช้เป็นแนวรับ-แนวต้านแบบไดนามิก (Dynamic Support & Resistance)
* แนวรับ: เมื่อราคาวิ่งลงมาแตะหรือเข้าใกล้เส้นล่าง (เส้นสีน้ำเงิน) เส้นนี้อาจทำหน้าที่เป็นแนวรับชั่วคราวและมีโอกาสที่ราคาจะเด้งกลับขึ้นไปหาเส้นกลาง
* แนวต้าน: เมื่อราคาวิ่งขึ้นไปแตะหรือเข้าใกล้เส้นบน (เส้นสีแดง) เส้นนี้อาจทำหน้าที่เป็นแนวต้านชั่วคราวและมีโอกาสที่ราคาจะย่อตัวลงมา
2. การวัดความผันผวนและสัญญาณ Breakout
* ช่วงตลาดสงบ (Low Volatility): เมื่อเส้น SD ทั้งสองเส้นบีบตัวเข้าหากันเป็นช่องที่แคบมาก (คล้ายกับ Bollinger Squeeze) แสดงว่าตลาดมีความผันผวนต่ำมาก ซึ่งมักจะเป็นสัญญาณว่ากำลังจะเกิดการเคลื่อนไหวครั้งใหญ่ (Breakout)
* ช่วงตลาดเป็นเทรนด์ (High Volatility): เมื่อเส้น SD ขยายตัวกว้างออกอย่างรวดเร็ว พร้อมกับที่ราคาวิ่งอยู่นอกขอบ แสดงว่าตลาดเข้าสู่ช่วงเทรนด์ที่แข็งแกร่งและมีโมเมนตัมสูง
3. สัญญาณการกลับตัว (Reversal Signals)
* เมื่อราคาปิดแท่งเทียน นอกเส้น SD Bands อย่างชัดเจน (โดยเฉพาะหลังจากที่เทรนด์นั้นดำเนินมานาน) อาจเป็นสัญญาณว่าแรงซื้อ/แรงขายเริ่มอ่อนกำลังลง และมีโอกาสที่จะเกิดการกลับตัวของราคาในไม่ช้า
การตั้งค่าอินพุต (Input Parameters):
* ระยะเวลา (Length): กำหนดจำนวนแท่งเทียนที่ใช้ในการคำนวณค่าเฉลี่ยและ SD
* 20: สำหรับการวิเคราะห์ระยะสั้นถึงกลาง
* 50 หรือ 100: สำหรับการวิเคราะห์ระยะยาว
* ตัวคูณ (Multiplier): กำหนดระยะห่างของเส้น SD จากค่าเฉลี่ย
* 1.0 - 2.0: เส้นจะอยู่ใกล้ราคามากขึ้น ทำให้เกิดสัญญาณบ่อยขึ้น
* 2.0 - 3.0: เส้นจะอยู่ห่างจากราคามากขึ้น ทำให้เกิดสัญญาณที่น่าเชื่อถือมากขึ้น แต่จะเกิดไม่บ่อย
ข้อควรระวังและคำเตือน:
* อินดิเคเตอร์นี้เป็นเพียง เครื่องมือวิเคราะห์ เพื่อช่วยในการตัดสินใจ ไม่ใช่สัญญาณการซื้อขายที่ถูกต้อง 100%
* ควรใช้ร่วมกับเครื่องมืออื่นๆ เช่น RSI, MACD, หรือ Volume เพื่อยืนยันสัญญาณ
* การเทรดมีความเสี่ยงสูง ควรบริหารจัดการความเสี่ยงและตั้งจุด Stop Loss ทุกครั้ง
คุณสามารถใช้โครงสร้างนี้ในการเขียนโพสต์บน TradingView ได้เลยนะครับ ขอให้ประสบความสำเร็จกับการโพสต์อินดิเคเตอร์ของคุณครับ!
English
Standard Deviation Bands
Indicator Description:
The SD Bands (Standard Deviation Bands) indicator is a powerful technical analysis tool designed to measure price volatility and identify potential trading opportunities. The indicator displays two dynamic bands directly on the price chart, based on a moving average and a customizable standard deviation multiplier.
* Upper Band: Indicates price levels above the moving average.
* Lower Band: Indicates price levels below the moving average.
The width of the channel between these two bands provides a clear picture of current market volatility.
Detailed User Guide:
You can use SD Bands in several ways to enhance your trading decisions:
1. Dynamic Support and Resistance:
These bands can act as dynamic support and resistance levels.
* Support: When the price moves down and touches or approaches the lower band, it can act as support, offering the possibility of a rebound to the average.
* Resistance: When the price moves up and touches or approaches the upper band, it can act as resistance, offering the possibility of a rebound.
2. Volatility Measurement and Breakout Signals:
* Low Volatility (Squeeze): When the two bands converge and form a narrow channel. Indicates very low market volatility. This condition often occurs before significant price movements or breakouts.
* High Volatility (Expansion): When the bands expand and widen rapidly, it indicates that the market is entering a period of strong trending momentum with high momentum.
3. Reversal Signals:
* When the price closes significantly outside the SD Bands (especially after a long-term trend), it may signal that the current momentum has expired and a reversal may be imminent.
Input Parameters:
The indicator's parameters are fully customizable to suit your trading style:
* Length: Defines the number of bars used to calculate the moving average and standard deviation.
* 20: Suitable for short- to medium-term analysis.
* 50 or 100: Suitable for long-term trend analysis.
* Multiplier: Adjusts the sensitivity of the signal bars.
* 1.0 - 2.0: Creates narrower signal bars, leading to more frequent signals.
* 2.0 - 3.0: Creates wider signal bars, providing fewer but potentially more significant signals.
Important Warning:
* This indicator is an analytical tool only. It does not provide guaranteed buy or sell signals.
* Always use it in conjunction with other indicators (such as RSI, MACD, and Volume) for confirmation.
* Trading involves high risk. Proper risk management, including the use of stop-loss orders, is recommended.
You can use this structure for your posts on TradingView. Good luck with your indicators!

RS Ratio vs Benchmark (Colored)📈 RS Ratio vs Benchmark (with Color Change)
A simple but powerful tool to track relative strength against a benchmark like QQQ, SPY, or any other ETF.
🔍 What it Shows
RS Ratio (orange line): Measures how strong a stock is relative to a benchmark.
Moving Average (teal line): Smooths out RS to show trend direction.
Color-coded RS Line:
🟢 Green = RS is above its moving average → strength is increasing.
🔴 Red = RS is below its moving average → strength is fading.
📊 How to Read It
Above 100 = Stock is outperforming the benchmark.
Below 100 = Underperforming.
Rising & Green = Strongest signal — accelerating outperformance.
Above 100 but Red = Consolidating or losing momentum — potential rest period.
Crosses below 100 = Warning sign — underperformance.
✅ Best Uses
Spot leading stocks with strong momentum vs QQQ/SPY.
Identify rotation — when strength shifts between sectors.
Time entries and exits based on RS trends and crossovers.

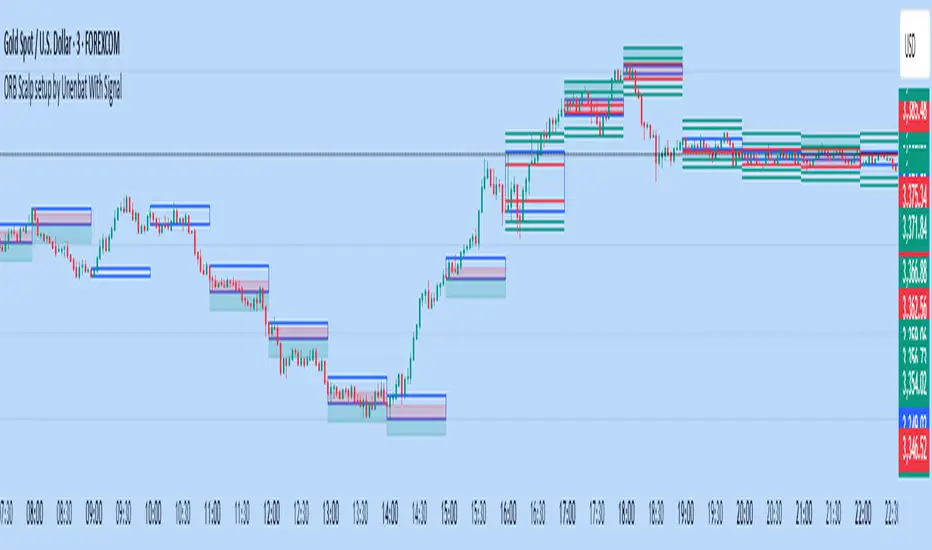
ORB Scalp setup by Unenbat With Signal**ORB Scalp Setup by Unenbat with Signal**
This indicator visualizes a custom Opening Range Breakout (ORB) strategy using a 6-minute range split across the end of one hour and the start of the next. It identifies two key trade setups using 1-hour candles:
* **Reverse Signals:** Triggered when the second 1H candle breaks the previous high/low but closes back inside, signaling a reversal.
* **Continuation Signals:** Triggered when the second 1H candle breaks and closes beyond the previous candle’s range, confirming trend continuation.
SL/TP zones are plotted accordingly, with optional fill coloring. No trades are displayed during "inside bars" or "manipulation" candles.
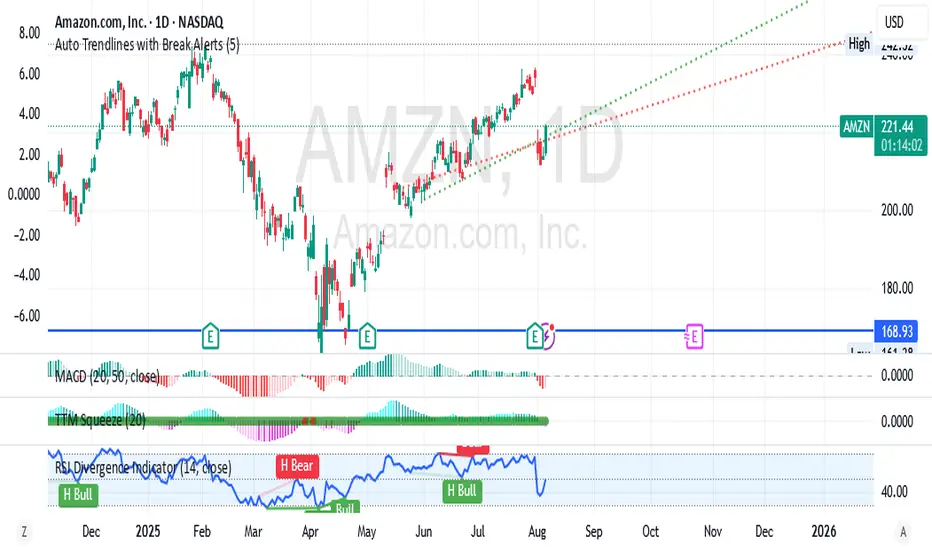
Auto Trendlines with Break AlertsIdentify the two most recent significant swing highs and swing lows based on a customizable pivot length.
Draw trendlines extending from these points.
Provide an optional visual signal (a small diamond on the chart) and a alertcondition for sound/push notifications when a trendline is broken.
Configure: Once the indicator is on your chart, you can click on the gear icon (⚙️) next to its name to adjust the settings. You will see a checkbox to enable/disable alerts and a slider to change the pivot length.
Configuring Alerts in TradingView
The alertcondition lines in the code allow you to set up official TradingView alerts for sound and push notifications.
Create an Alert: Click the clock icon (⏰) on the right-side toolbar of your TradingView chart.
Set the Condition: In the "Condition" field, select the name of the indicator: "Auto Trendlines with Break Alerts".
Choose the Alert Type: A second dropdown will appear. Select either "High Trendline Broken" or "Low Trendline Broken" to specify which break you want to be alerted for.
Select Notification Options: In the "Notifications" section, you can check the boxes for "Play sound," "Send email," "Send push notification," etc.
Create the Alert: Click "Create" to save your alert.
ACR(Average Candle Range) With TargetsWhat is ACR?
The Average Candle Range (ACR) is a custom volatility metric that calculates the mean distance between the high and low of a set number of past candles. ACR focuses only on the actual candle range (high - low) of specific past candles on a chosen timeframe.
This script calculates and visualizes the Average Candle Range (ACR) over a user-defined number of candles on a custom timeframe. It displays a table of recent range values, plots dynamic bullish and bearish target levels, and marks the start of each new candle with a vertical line. All calculations update in real time as price action develops. This script was inspired by the “ICT ADR Levels - Judas x Daily Range Meter°” by toodegrees.
Key Features
Custom Timeframe Selection: Choose any timeframe (e.g., 1D, 4H, 15m) for analysis.
User-Defined Lookback: Calculate the average range across 1 to 10 previous candles.
Dynamic Targets:
Bullish Target: Current candle low + ACR.
Bearish Target: Current candle high – ACR.
Live Updates: Targets adjust intrabar as highs or lows change during the current candle.
Candle Start Markers: Vertical lines denote the open of each new candle on the selected timeframe.
Floating Range Table:
Displays the current ACR value.
Lists individual ranges for the previous five candles.
Extend Target Lines: Choose to extend bullish and bearish target levels fully across the screen.
Global Visibility Controls: Toggle on/off all visual elements (targets, vertical lines, and table) for a cleaner view.
How It Works
At each new candle on the user-selected timeframe, the script:
Draws a vertical line at the candle’s open.
Recalculates the ACR based on the inputted previous number of candles.
Plots target levels using the current candle's developing high and low values.
Limitation
Once the price has already moved a full ACR in the opposite direction from your intended trade, the associated target loses its practical value. For example, if you intended to trade long but the bearish ACR target is hit first, the bullish target is no longer a reliable reference for that session.
Use Case
This tool is designed for traders who:
Want to visualize the average movement range of candles over time.
Use higher or lower timeframe candles as structural anchors.
Require real-time range-based price levels for intraday or swing decision-making.
This script does not generate entry or exit signals. Instead, it supports range awareness and target projection based on historical candle behavior.
Key Difference from Similar Tools
While this script was inspired by “ICT ADR Levels - Judas x Daily Range Meter°” by toodegrees, it introduces a major enhancement: the ability to customize the timeframe used for calculating the range. Most ADR or candle-range tools are locked to a single timeframe (e.g., daily), but this version gives traders full control over the analysis window. This makes it adaptable to a wide range of strategies, including intraday and swing trading, across any market or asset.

Ayman – Full Smart Suite Auto/Manual Presets + PanelIndicator Name
Ayman – Full Smart Suite (OB/BoS/Liq/FVG/Pin/ADX/HTF) + Auto/Manual Presets + Panel
This is a multi-condition trading tool for TradingView that combines advanced Smart Money Concepts (SMC) with classic technical filters.
It generates BUY/SELL signals, draws Stop Loss (SL) and Take Profit (TP1, TP2) levels, and displays a control panel with all active settings and conditions.
1. Main Features
Smart Money Concepts Filters:
Order Block (OB) Zones
Break of Structure (BoS)
Liquidity Sweeps
Fair Value Gaps (FVG)
Pin Bar patterns
ADX filter
Higher Timeframe EMA filter (HTF EMA)
Two Operating Modes:
Auto Presets: Automatically adjusts all settings (buffers, ATR multipliers, RR, etc.) based on your chart timeframe (M1/M5/M15).
Manual Mode: Fully customize all parameters yourself.
Trade Management Levels:
Stop Loss (SL)
TP1 – partial profit
TP2 – full profit
Visual Panel showing:
Current settings
Filter status
Trend direction
Last swing levels
SL/TP status
Alerts for BUY/SELL conditions
2. Entry Conditions
A BUY signal is generated when all these are true:
Trend: Price above EMA (bullish)
HTF EMA: Higher timeframe trend also bullish
ADX: Trend strength above threshold
OB: Price in a valid bullish Order Block zone
BoS: Structure break to the upside
Liquidity Sweep: Sweep of recent lows in bullish context
FVG: A bullish Fair Value Gap is present
Pin Bar: Bullish Pin Bar pattern detected (if enabled)
A SELL signal is generated when the opposite conditions are met.
3. Stop Loss & Take Profits
SL: Placed just beyond the last swing low (BUY) or swing high (SELL), with a small ATR buffer.
TP1: Partial profit target, defined as a ratio of the SL distance.
TP2: Full profit target, based on Reward:Risk ratio.
4. How to Use
Step 1 – Apply Indicator
Open TradingView
Go to your chart (recommended: XAUUSD, M1/M5 for scalping)
Add the indicator script
Step 2 – Choose Mode
AUTO Mode: Leave “Use Auto Presets” ON – parameters adapt to your timeframe.
MANUAL Mode: Turn Auto OFF and adjust all lengths, buffers, RR, and filters.
Step 3 – Filters
In the Filters On/Off section, enable/disable specific conditions (OB, BoS, Liq, FVG, Pin Bar, ADX, HTF EMA).
Step 4 – Trading the Signals
Wait for a BUY or SELL arrow to appear.
SL and TP levels will be plotted automatically.
TP1 can be used for partial close and TP2 for full exit.
Step 5 – Alerts
Set alerts via BUY Signal or SELL Signal to receive notifications.
5. Best Practices
Scalping: Use M1 or M5 with AUTO mode for gold or forex pairs.
Swing Trading: Use M15+ and adjust buffers/ATR manually.
Combine with price action confirmation before entering trades.
For higher accuracy, wait for multiple filter confirmations rather than acting on the first arrow.
6. Summary Table
Feature Purpose Can Disable?
Order Block Finds key supply/demand zones ✅
Break of Structure Detects trend continuation ✅
Liquidity Sweep Finds stop-hunt moves ✅
Fair Value Gap Confirms imbalance entries ✅
Pin Bar Price action reversal filter ✅
ADX Trend strength filter ✅
HTF EMA Higher timeframe confirmation ✅
