Price in BitcoinHi folks,
This script simply converts the price of assets from USD to bitcoin and displays that price in a separate chart. Currently, only assets quoted in USD will work but I will add more currencies in the future.
Use:
1. Make sure the asset you're viewing is quoted in USD or USX. To check, hover over the symbol on the top left part of the chart, click the "More" ellipsis and select "Symbol Info". The currency will be among the info displayed.
2. Apply the script and view the chart at your own risk.
Math:
price(btc) = (x/usd) / (btc/usd)
Cheers!
Jared
FX

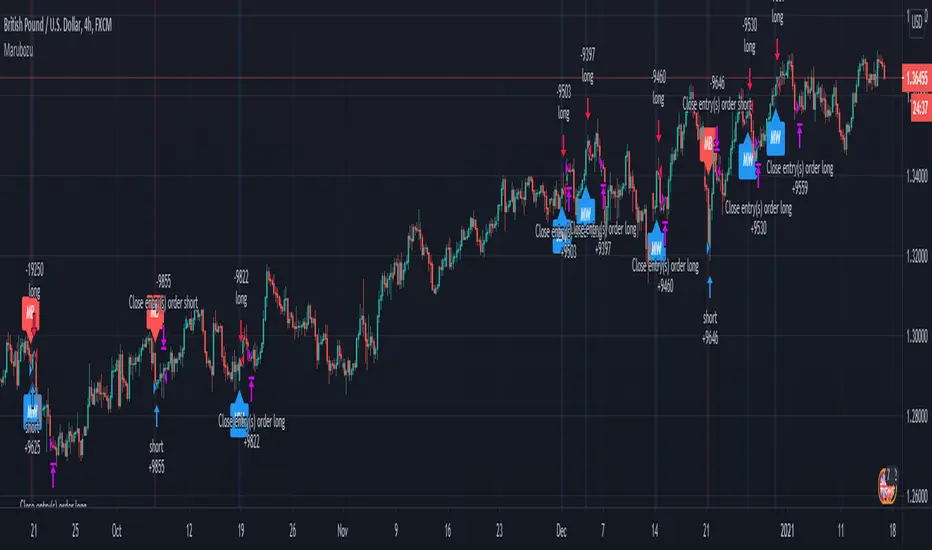
Marubozu Forex Price actionHi, today I bring you a price action strategy/indicator for Forex, made out for Marubozu candle type.
For the entries of it check if we have a long or a short marubozu.
For exit we have for long when the actual candle is green and the last previous two were red.
For exit we have for short, when the actual candle is red and the last previous two were green.
If you have any questions private message me !
London Breakout/Session GBP/USD Forex DaytradeThis is a forex strategy suited for day traders, specialized in the london breakout session
The key elements for this strategy are the specific london time session, together with an exit time(before asian trade/at the end of new york session).
At the same time, as logic elements we only use price action inside like :
For long we have 3 ascending candles, and for short we have 3 descending candles.
For exit we have both TP/SL based on price percentage movement, or we exit if we reach the end of the day.
If you have any questions message me in private !

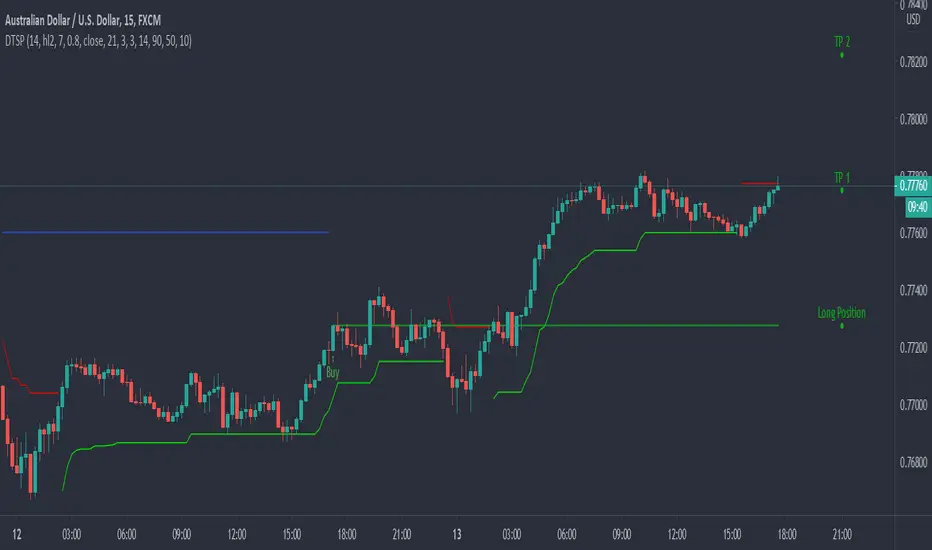
Dynamic Take Profit & Signals (AussieBogan)Dynamic Take Profit & Signals (DTS) help us to dynamically place potential take profit levels. These levels are measured based on standard deviation in conjunction with swing high and low points. Head over to the settings to control your take profit and multiplicative factor setting.
In short, higher values of either setting will return more spread out between tp's. The logic behind using the standard deviation is that a low value of it will return tp closer to where you entered the trade, as such it will have higher chances of the price reaching them.
The Indicator also has alert features for buy and sell so any trader can be aware of every potential signal the indicator produces.
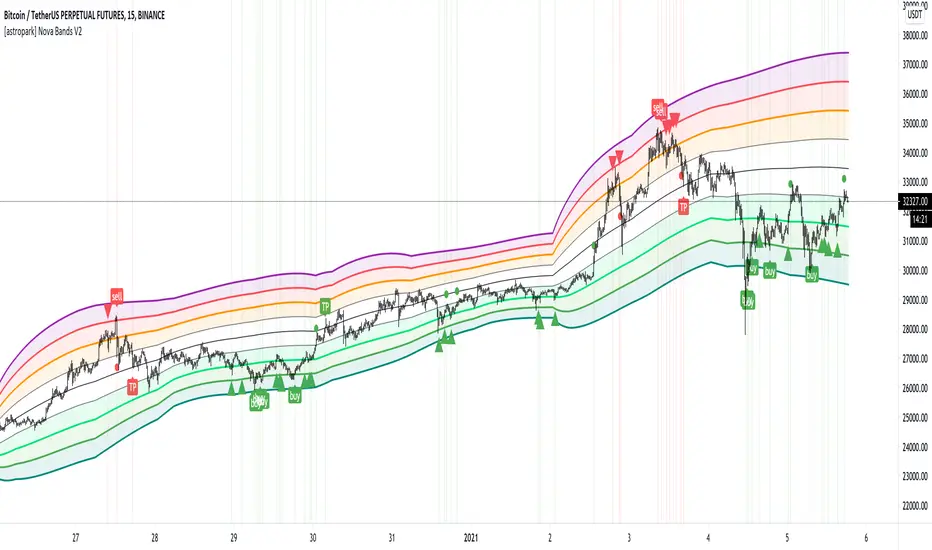
[astropark] Nova Bands V2Dear followers,
today an upgraded version of Nova Bands indicator, here below the previous V1
This is a great analysis and scalping tool for day trading on low timeframes (5-15 minutes) or to plan swing trades on hourly timeframes. It can be used also on high timeframes just for analysis current market trend.
The indicator plots a series of levels which create a nice bands flow.
The slope of levels make you easily understand when price is in consolidation, in uptrend or in downtrend.
The golden rule is always the same: buy low and sell high .
This indicator plots:
3 "price is low here" levels (from dark green to light green)
3 "price is average here" levels
3 "price is high here" levels (from purple to orange)
You can find more details on how to use the indicator in the description of V1.
Please, always remember that:
when bands are flat, price is in consolidation and this is best condition to trade with nova bands
when bands get nearer and nearer is called "Bands Squeeze": price is next to a main breakout move, volatility is coming!
The basic improvement in V2 is a different way to calculate the bands based on different timeframe resolution, default is setup to daily timeframe for example.
A trader who wants to be a winner must understand that money and risk management are very important, so manage your position size and always have a stop loss in your trades.
This is a premium indicator , so send me a private message in order to get access to this script.
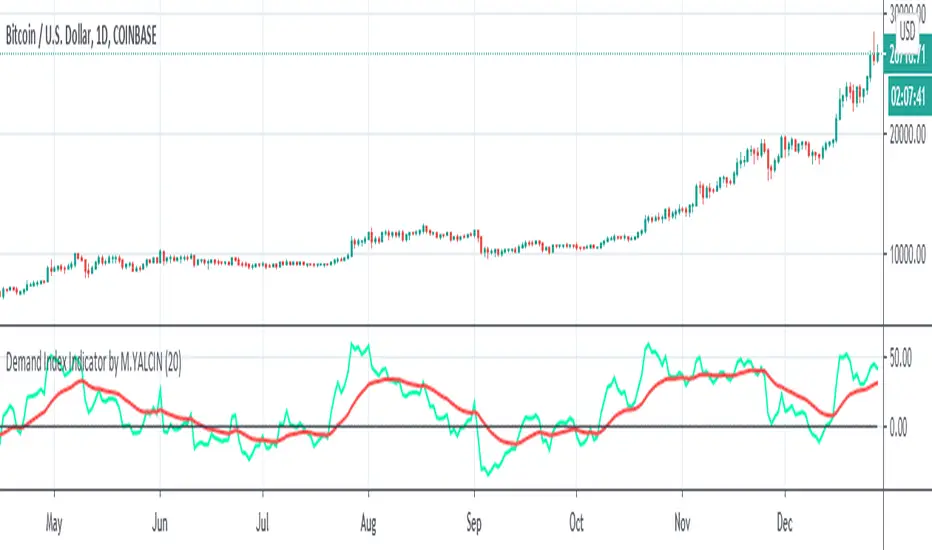
Demand Index Indicator by M.YALCINThe Demand Index is a complex technical indicator developed by James Sibbet that utilizes over 20 columns of data to measure the ratio of buying pressure to selling pressure. James Sibbet established six rules for using Demand Index:
1.A divergence between the Demand Index and price is a bearish indication.
2.Prices often rally to new highs following an extreme peak in the Demand Index.
3.Higher prices with a low Demand Index often indicate a top in the market.
4.The Demand Index moving through the zero line suggests a change in trend.
5.The Demand Index remaining near the zero line indicates weak price movement that won’t last long.
6.A long-term divergence between the Demand Index and price predicts a major top or bottom.
This indicator differs from other demand index indicators on this site in terms of indicator values. However, I think the low number of zigzags highlights this style. On the other hand, I think important points in terms of trading are added to the indicator: 1) According to many observations, the moments when this indicator crosses the zero line are interpreted as buy signals, and vice versa as a sell signal so the 0 line is shown. 2) Again, according to many observations, when the indicator crosses up its own 20-day (bar) exponential moving average is interpreted as a buy signal, and vice versa as a sell signal. Happy New Year ... NOTE: All these ideas do not contain financial advice.
Analog/Digital World Clock by DGTWorld Clocks - something for fun
Happy New Year!
ps: in case no update on the charts then the clock will not update too and will lag or stop till a new update is received

PpSignal Impulse V1.20PpSignal impulse is based on the concept of relative strength index, Rsi its acronym in English.
Although the calculation is similar, it differs in how the force is calculated. To calculate the force we are based on the analysis of the trend through a WMA.
It is important to clarify that you must do a prior analysis of the asset that you are going to trade, such as resistance supports, channels, chart formations, etc.
Buy when the sign is white.
Sell when the signal is red.
You can also perform buy or sell boosts if you activate impulse 2 and 3.

PpSignal Haiken Ashihere is the development of ppsignal Heiken Ashi with a formula of ours.
It also has a Smooth move average.
When HA this green is buying, when red is selling... simple entry system for scalping.
Enjoy it

Heiken Ashi MTF Strategy- IndicatorHello, this is both a strategy and indicator that revolves around Heikin Ashi candles.
In this case we take 3 different time frames, in this example we use daily , weekly and monthly.
The conditions for entry are :
For long : we check that we have a green daily candle, at the same time we check that the weekly and monthly candles are also green.
For short : We check that all candles, daily, weekly and monthly and red.
For exit of long : as soon as 1 of the 3 candles, daily or weekly or monthly converts to red, we exit.
For exit of short : as soon as 1 of the 3 candles converts to green, we exit.
This strategy- indicator can be adapted to any type of market.

Profit MAX MTF HeatMapThis is a powerfull strategy which is made from combining 3 multi timeframes into one for profit max indicator
In this case we have daily, weekly and montly.
Our long conditions are the next ones :
if we have an uptrend on all 3 at the same time, we go long.
If we have a downtrend on all 3 of them at the same time we go short.
For exit, for long, as soon as one of the 3 converts into downtrend we exit the trade.
For exit, for short, as soon as one of the 3 converts into uptrend we exit the trade.
This tool can be used on all types of markets, and can also be changed the time frames.

BE - Volume v2.8Volume´s Indicator Draft
Intend to determinate the volume strengh (whales movements) for comodities and forex
Defaults Set for a regular Volume indicator
Not so Obvious Inputs...
AV = Absolute values (if not, show as negatives, weak´s vol movements)
MA Source = Volume, Positive Vol, Negative Vol. (Identifies Upcommings Price changes)
As already said..
Its a Draft, comments will be appreciated

Forex Breakout AlertThe indicator plots breakout events of user-defined Forex list, providing alert setting for breakout events.
Any big trend begins with a couple of price breakouts. By watching breakout events, we overlook the panorama of the whole market.
---------- Features --------------
User-Defined Forex Asset List, Up To 30 Assets
User-Defined Breakout Threshold
Accessible for wide timeframes: 1m - 1 Month
Plot the Breakouts History of whole market
Progressive color according to the strength of the breakthrough
--------- Indicator Settings -----------
"Show Bull or Bear?": To show Bull Breakout, Bear Breakout or Both
"User-Defined Breakout Threshold": User can defined the threshold of breakout, default value 999 means using default setting
"Use Green for Bull? ": Toggle color for Bull, defval: true, if your region use red for bull, toggle it.
"Exchange": Your exchange name, which is used to defined tickerid, defval="", optional - can be empty
"Asset PostFix": postfix of your asset symbol, which is used to define tickerid, defval="", change it if necessary
---------- Versions Description ----------
The features may change later without advance notice.
DEMO version has basic features.
---------- Access to Indicators ----------
Contact the author by Private Chat for access to Invite-Only versions and a trial.
---------- Install Invite Only Version----------
Open the chart -> Add Indicators (On the Top or press /) -> Invite-Only Scripts (last button of the left bar)
Like/Favorite the indicator
Click to install on the chart
---------- About Loading Time ----------
It may take up to 1-3 minutes for your browser to load a new setting, depending on the your computer and network speed. For convenience, you can keep related pages open continuously.
---------- FAQ -----------
1. Why can't I see older breakout labels?
Due to system limit, 500 is the maximum of labels.
In order to see older breakout events, please Select Bull or Bear, instead of Both; Or Increase the threshold to filter weak breakouts.
2. How to watch more than 30 Forex?
Due to system limit, 30 assets is the maximum.
In order to watch more assets, user can open the indicator in another sub-chart, add your 2nd assets list, save the layout, set alerts for different lists respectively.
---------- Disclaimer ----------
By using or requesting access to the indicator, you acknowledge that you have read and accepted that the indicator and any related content, including but not limited to: user manual, tutorials, ideas, videos, chats, emails, blog, are for the purpose of trading strategies studying and paper trading.
If a customer or user uses the indicator or related content mentioned above for live trading or investment, she/he should take all risks and responsibility.
---------- Updates ----------
The latest updates override the previous description.
To activate a update: Close the browser, Reopen the chart and apply the indicator.
【外汇资产突破预警】指标绘制一系列外汇资产的突破事件,提供突破预警
任何大趋势都开始于一系列的价格突破。通过监控突破事件,可以俯瞰市場的運動
---------- 产品特征------------
用户自定义的交易品种列表,多达30个品种
用户自定义的突破门槛
适用于宽泛的时间维度:1分钟--1月
绘制整个市场的突破历史
漸進顏色 根據突破的力度
------------- 指标设置说明 -------------------
"展示牛熊突破?": 展示牛突破,熊突破或者两者
“用户自定义突破门槛”: 自己定义突破门槛,999代表默认的设置
"綠色為牛?": 切換標籤顏色,默認綠色為牛
“交易所”:用来定义资产前缀,可以为空
“资产后缀”: 用来定义资产后缀,可以为空
---------- 版本描述 ----------------
產品特徵後續可能變化,恕不事先通知
DEMO版本供試用
----------- 獲取指標使用權 ------------
通過私信聯繫作者,要求訂閱或試用
----------- 安裝指標 -----------------
加指標 -》 Invite-Only (左邊欄目)
點贊或者收藏指標
點擊安裝指標
----------- 關於載入時間 ---------------
可能需要1--3分鐘來完成載入,取決於用戶的電腦和網絡速度,方便起見可以保持相關頁面持續開啟
------- FAQ ----------
1. 如何查看更早的突破歷史
由於系統限制,500 個標籤是上限
為了查看更早的突破,請選擇牛或者熊,而不是兩者;或者提高"用戶自定義突破門檻" 來過濾掉弱突破
2. 如何監控更多資產?
由於系統限制,30個資產是上限
為了監控更多資產,可以在第二個子圖表加載指標,保存圖表,分別在不同的圖表設置突破預警
---------- 免責聲明 ----------
在要求獲得本指標使用權之前以及在使用本指標之前,用戶認可已經完全了解和接受:本指標僅供學習交流目的, 它不構成任何交易建議或者投資建議。用戶如果將指標用於其他用途,應自行承擔所有風險和責任。
本指標的開發者並非專業投資顧問,因此不對用戶的任何行为負責。
最近的更新會覆蓋之前的說明。請參閱更新來查看指標的新特徵和功能

PpSignal Momentum TraderThis is a combination of the PERCENTAGE of PRICE OSCILLATOR (PPO) and Momentum.
When both oscillators are up in the same direction it is buying (green bottom and green oscillators), when both oscillators are down it is sell (red bottom and red oscillators. When they do not agree (silver bottom) it is to keep doing nothing .
You can also see the change in trend with the candles as well. same colors as the background and the oscillators.

pSignal CFB and Slope Trend Folow This indicator shows the trend of an asset (nifty, crypto, forex, stock, etc., taking as a starting point the volatility and direction of the market.
When the moving average slope crosses up CFB (see CFB explanation below) it is BUY.
When the Moving Average Slope crosses CFB down it is sell.
The system also has a support and resistance (daily, weekly, or mouth) identifier.
The alarm of resistance or support signal: When price close and volume break daily support or resistance the general system is a visual signal.
Bull Wick= the high price broke the resistance.
Bear wick = the low price broke the support.
Break Out color blue color = the close price and the volume broke the resistance.
Break Out color maroon color = the close price and the volume broke the support.
The system also has the Bollinger bands that show us the volatility of the market and when it is up or down. Read more about the use of the Bollinger band
CFB
his indicator was designed to filter out lower price actions for a clearer view of trends. Inspired by QQE's volatility filter, this filter applies the process directly to price rather than a smoothed RSI . Range Filter and bands are now calculated in a singular function. There are now two different calculation methods for the filter. Select the type you want to use through the "Filter type" entry. Type 1 is the original formula. Multiple range size methods are now available.
You can choose between the following scales:
- Points
- Pips (Works best with currency pairs, obviously)
- Ticks -% of the price - ATR - Average change (default. This is the original sizing method). - Standard Deviation
- Absolute (absolute numerical value)
- Smoothing with the range elder is now optional, and you can specify its smoothing length.
Smoothing only affects dynamic scales (ATR, average change, and standard deviation).
- Filter movement can now be determined using highlights or closing price. This can be specified through the input.

Price action strategy FOREX with amazing results
Hello, today I bring another amazing strategy for forex .
Its made of T3 moving average , combined together with a pattern rule and a specific entry time.
We take all of that and we trade it in inverse.
So what normally for long would be : close higher than the previos high and close higher than the average, we use this as a short condition. We do the same stuff for long condition.
So in the end we end up with an amazing product.
It also has a risk management inside, with a TP/SL based on % move of the price .
Let me know how it goes .

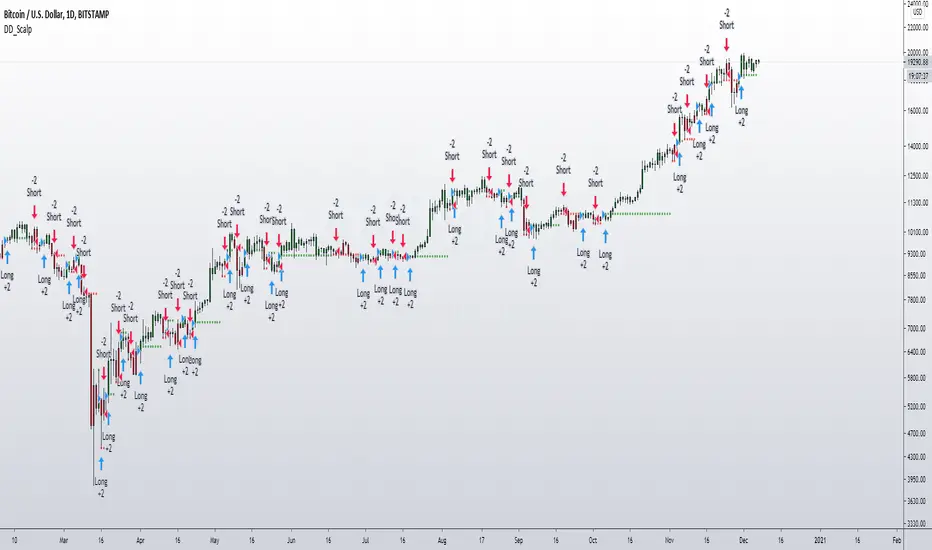
DD_ScalpDD_Scalp is a buy/sell trading strategy based on momentum from breakout levels. It works well on 1D and 4H timeframes. It is a helpful indicator for scalping short range profits on a daily basis or for booking profits in a high time frame setups such as those given by my DD_Echo indicator. It works for all major cryptos such as BTC, ETH, LINK, and other alts. It also works for forex.
If you want to access this, please DM me.
Swing Reversal IndicatorSwing Reversal Indicator was meant to help identify pivot points on the chart which indicate momentum to buy and sell. The indicator uses 3 main questions to help plot the points:
Criteria
Did price take out yesterday's high or low?
Is today's range bigger than yesterday? (Indicates activity in price)
Is the close in the upper/lower portion of the candle? Thus, indicating momentum in that direction
This indicator was built to help me find pivot points for directional options trading however can be used for equities and forex swing trading and other strategies. Used in conjunction with a BB extreme can provide good setups.
Alerts are available for both the long and the short positions and the indicator will repaint as price moves.
The character Plotted can be changed in the settings
The size of the candle area can be changed as well if you want to tighten/loosen the trigger points based on the third question above.

GreenCrypto PR Strategy for Swing TradesThis is a very good strategy for Swing Trading, I have been using this strategy for very long time and made good amount of profit using this. This works great for both long trades and short trades, Stop loss and Take profit target is must while entering the trade, this make sure that the trade ends up in good profit and in case if the market revers, ends in only small loss.
This strategy works using the pivot points, we calculate the pivot point using the number of candles mentioned in the input field "leftBars" and "rightBars", if you add more number of bars then the frequency of the trade decreases. for example with the leftBars as 4 you will get less trades than the leftBar=2. Every trade entry is represented using "Buy" and "Sell" signals, whenever there is a new signal chart shows buy/sell signal for limit price, you need to add a limit order for the same price.
Parameters:
LeftBars = Number of left bars should be used for calculating the pivot pints, (more bars means less frequent trades)
RightBars = Number of right candle bars used for calculating the pivot points (more bars means less frequent trades)
Date/month/day : for selecting the right backtesting the period (currently it set to Jan 2018 to current day )
for this backtesting i have used 1000$ capital and with 10% capital used for each trade, free to modify it as per your needs.
This strategy works best on 4H time frame but you can also try backtesting on other time periods.
The default parameters present in the strategy is works best for most of famous cryptocurrencies on 4H time period.
Please DM me if you would like to tryout 7 Days free trail.

Forex SWING TraderThis strategy is mainly designed for swing trading applied to FOREX.
In this case we make use of 2 moving averages but with different time frame, lets say 1h and 1 day.
When they cross above we would initially have a long trade, but in this strategy we trade it in reverse, so we would actually enter a short position.
The same for short trade.
At the same time we make use of hours for entry, so we can filter even better between the trades, and select the best possible hours for entries.
For exit we have 2 conditions : one is when we receive an opposite signal ( by default ).
The other is when a certain movement between moving averages, like lets say 1% of price movement, we will exit. This can act both as TP and SL.

Momentum Explosion 2CCI RSI"Momentum Explosion Template for Mobile Metatrader", that is a trading system trend momentum based on two Commodity Channel Index (CCI) , RSI and two Moving Averages.The trading signals are generated by the crossing of the moving averages confirmed by the agreement of the two CCIs and the RSI.
Two Moving averages Filtered by double CCI and RSI
Credit is to Dimitri Author Beejay (Forex Factory)
Trading Rules Momentum Explosion
Buy
EMA 8 crosses upward SMA 26.
CCI 34 periods > 0
CCI 55 periods > 0
RSI 26 > 48.
Sell
EMA 8 crosses downward SMA 26.
CCI 34 periods < 0
CCI 55 periods < 0
RSI 26 < 48.

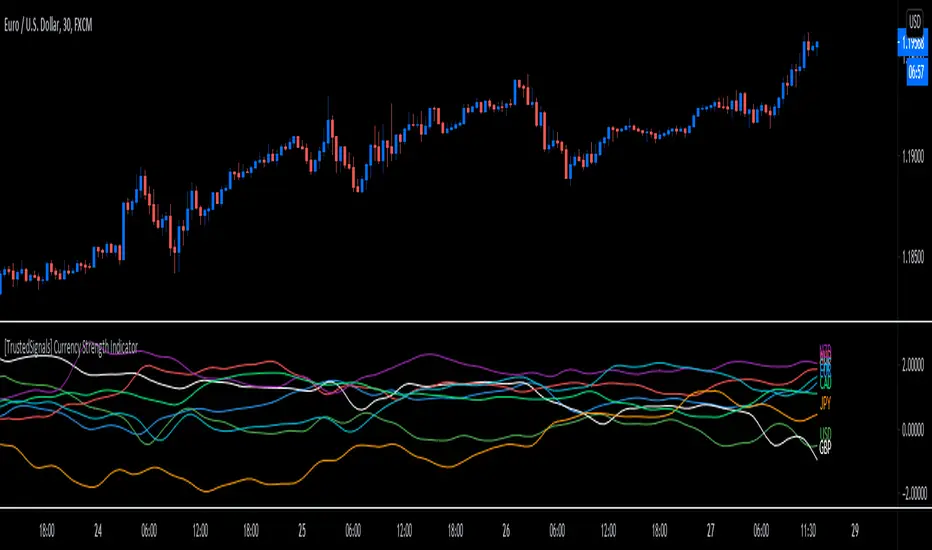
[TrustedSignals] Currency Strength IndicatorOur own branded currency strength meter gives you a quick visual guide to which currencies are currently strong, and which ones are weak.
The meter measures the strength of all forex cross pairs and applies calculations on them to determine the overall strength for each individual currency.
It is useful as a quick guide to which currencies you might want to trade, and which might be worth staying away from. For instance, if a certain currency is very strong, and another suddenly turns weaker, you may find a trading opportunity
The indicator has an extra option the user can activate, to show only the 2 indexes correlated to the displayed pair on the chart. For example, if the EURUSD pair is displayed on the chart, the indicator will only show the EUR index and the USD index.
It is recommended to use a lookback length of over 90 for Timeframes higher than 60min, and under 60 for lower intraday timeframes
Use the link below to obtain access to this indicator
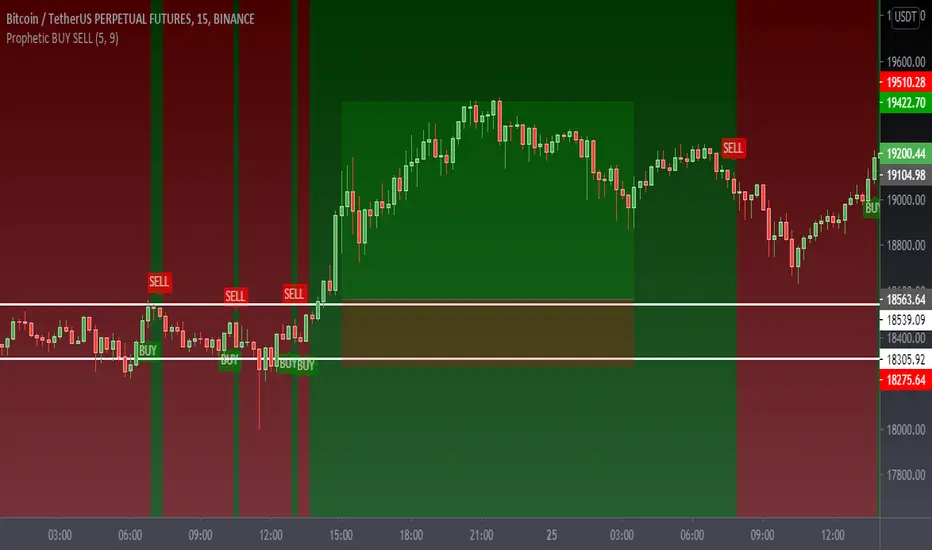
Prophetic BUY SELL IndicatorThis premium indicator will help you to do quick scalping on Cryptocurrencies, Forex, and Stocks.
This indicator is very simple to understand.
Green BUY Alert - Buy Signal Market is up
Red SELL Alert - Sell Signal Market is down
Caution:- Do not use it during market being choppy or sideways
Once the BUY signal appears the background changes green and same with SELL it turns red
can change the color according to requirements
It also has a moving average which also changes the color as the candles close above the MA or the below Default color are green and red
Please Like Share and Follow and if required please contact:- @mobudd (TELEGRAM)
or Ping me on trading view
Guys, It takes effort so please do not ask for free access.
You're always welcome to share any type of suggestion & feedback.