Break of structure (BOS) forex StrategyPlease read all Details before using this indicator
This strategy is based on taking position after the break of a Previous High/Low swing happens (fixed time frame), the break of structure happens because of the swing happens then we go long or short respectively in this strategy.
I will be discussing the setting details through which you can make it work on different forex pairs.
Does it work on other pairs?
Yes, I have found similar back test results on other USD pairs.
Does it works on smaller time frame?
Yes it does work on smaller time frame , you have to understand the below concepts used and try different settings.
For the user the most important thing is to understand the settings of the indicator so that they can optimize the setting and get the best results:
This indicator contains the following IMPORTANT setting:
i. Fixed trading session for long trades (long position can be taken in that period of time only)
ii. Fixed trading session for short trades (Short position can be taken in that period of time only)
The concept behind restricting the time to go long or short is because in forex the particular pair move in a particular direction depending upon the currency and time zones.
This strategy works on different forex pairs, you need to find the best settings. I will be providing the best settings which works for this strategy and different pairs.
2. Choose Previous High/Low Timeframe
This is the most important option where you have to choose the timeframe for which you want H/L by default it is set to “D”. This timeframe H/L reference will be taken for taking trading decisions.
3.Setting for back test selection date range you can check the beck test of a particular time range.
4.You can check Long and Short positions performance separately, by unchecking the “Go_long” option it will remove all long positions from back test. Vice versa for “Go_short option”
5.Internal Bar Strength
IBS is simply an indicator where you buy on weakness and sell on strength, the cornerstone of any mean-reverting strategy.
It oscillates from zero to one and measures the relative position of the closing price relative to the High and Low.
IBS = (Close – Low) / (High – Low)
In the input setting the you can disable enable the IBS option from the strategy.
6. Parkinson volatility
Parkinson volatility is a volatility measure that uses the stock’s high and low price of the day (can be changed in the setting, instead of day it can be set to any bar length)
The main difference between regular volatility and Parkinson volatility is that the latter uses high and low prices for a day, rather than only the closing price.
In the setting you have three option
i. Enter Volatility Threshold
If the Parkinson volatility value is greater than the the threshold value then it lets the trade happen.
ii.Set the high/low bar time frame for calculating Parkinson volatility. ( Set 60m by default)
Formula used as below:
high_=security(syminfo.ticker, input("60"), high)
low_=security(syminfo.ticker, input("60"), low)
hourlyRangeSquared = pow((log(high_) - log(low_)), 2)
dailyParkinsonVol = sqrt(sum(hourlyRangeSquared, 24) / (4 * log(2)))
7. "Enter no of contract size"
This setting helps you to set the contract size , by default it is set to 100000.
8. “Zigzag Filter Length” this setting is for SWING H/L Lookback. With the help of this I have ploted Swing Support and Resistance.
9.Futrther confirmation of trade is done through the RSI criteria. In this I have provided four kind of RSI confirmation you can test all by selecting any one of the four.
i. filter trade on the basis of BB of RSI (as shown in the image)
ii. filter trade on the basis of RSI Levels (RSI>50 for long, vice versa for short)
iii. filter trade by rsi>basis of BB of RSI(for long) & rsi<50(for short)
iv. filter trade by rsi>50(long) & rsi< basis of BB of RSI(short)
SELECT ONLY ONE OF THE ABOVE IN SETTING.
10.For Exiting the trade I have used the trailing SL you can change it in setting.
You can exit the trade using two targets (two take profit) using different size for exiting the trade.
If you want to take only on target then you have to make QANTITY of shares for 1st Exit as 100. Then you will exit all your position in the first target.
A big thanks to kodify.net there articles are very helpful kodify.net
Thanks to Mickey for providing assistance.
Thanks to stack overflow community for clearing the doubts.
Trading view official documentation on V4 of pine script also helped me.
Forextrading

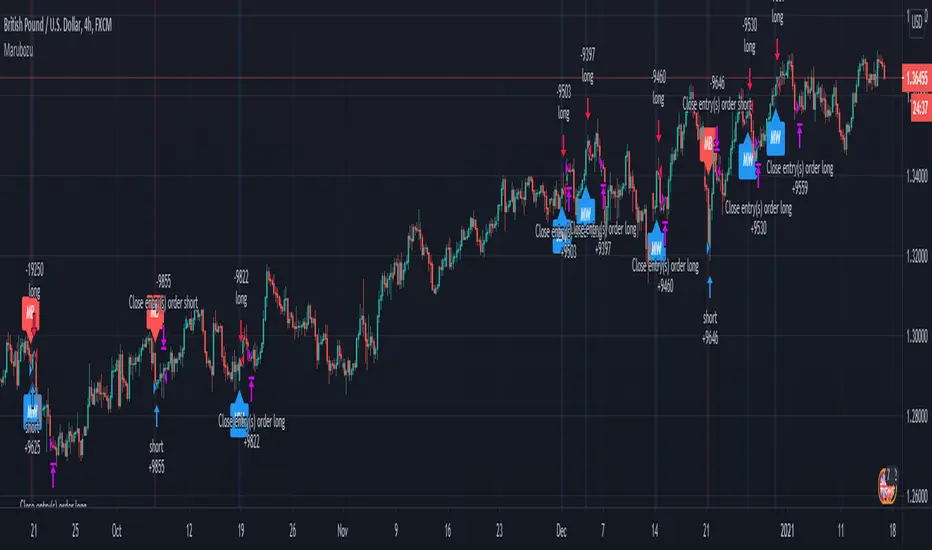
Marubozu Forex Price actionHi, today I bring you a price action strategy/indicator for Forex, made out for Marubozu candle type.
For the entries of it check if we have a long or a short marubozu.
For exit we have for long when the actual candle is green and the last previous two were red.
For exit we have for short, when the actual candle is red and the last previous two were green.
If you have any questions private message me !
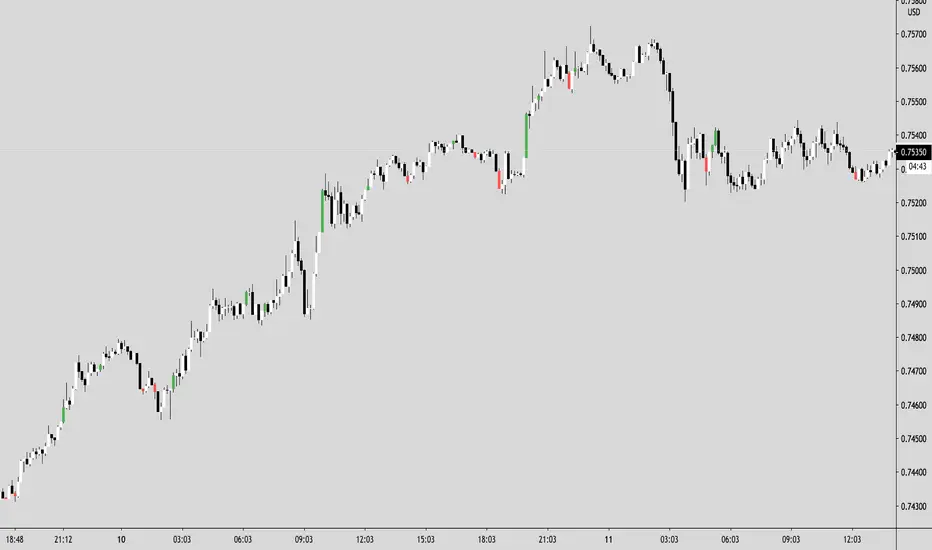
SERIES - EQOP - A
CONCEPT: Produce consistently profitable trading results
KNOWNS: Candle closes, Targets, High volume time periods
HYPOTHESIS: Upon the print of a "color bar", buy above, sell below, aim for a target, analyze every candle to determine continuation or reversal status and probabilities.
OUTCOME: There are four possible outcomes listed by assumed preference here: 1.) Make money and learn self discipline 2.) Make money and not learn self discipline 3.) Not make money and learn self discipline 4.) Not make money and not learn self discipline
Please dearly beloved also remember that there are much more important aspects to this existence than the acquisition of material sustenance and fortification. What we leave behind is not etched into stone nor our bank accounts, but into the lives of others. I commend those who choose to invest their energy into the pursuit of love and peace in every way that they find. Big or small, losing in trading or winning, it is most important to remain a peaceful individual.
The best way I have found to help others is by living my own life in the way I would wish them to know. The is power in your purpose and what you regard your own self to be capable of.
I respect you for li zen ing to my opinion and thoughts. Please be free and love thy neighbor as thyself, I give very little instruction regarding other matters.
Forex Breakout AlertThe indicator plots breakout events of user-defined Forex list, providing alert setting for breakout events.
Any big trend begins with a couple of price breakouts. By watching breakout events, we overlook the panorama of the whole market.
---------- Features --------------
User-Defined Forex Asset List, Up To 30 Assets
User-Defined Breakout Threshold
Accessible for wide timeframes: 1m - 1 Month
Plot the Breakouts History of whole market
Progressive color according to the strength of the breakthrough
--------- Indicator Settings -----------
"Show Bull or Bear?": To show Bull Breakout, Bear Breakout or Both
"User-Defined Breakout Threshold": User can defined the threshold of breakout, default value 999 means using default setting
"Use Green for Bull? ": Toggle color for Bull, defval: true, if your region use red for bull, toggle it.
"Exchange": Your exchange name, which is used to defined tickerid, defval="", optional - can be empty
"Asset PostFix": postfix of your asset symbol, which is used to define tickerid, defval="", change it if necessary
---------- Versions Description ----------
The features may change later without advance notice.
DEMO version has basic features.
---------- Access to Indicators ----------
Contact the author by Private Chat for access to Invite-Only versions and a trial.
---------- Install Invite Only Version----------
Open the chart -> Add Indicators (On the Top or press /) -> Invite-Only Scripts (last button of the left bar)
Like/Favorite the indicator
Click to install on the chart
---------- About Loading Time ----------
It may take up to 1-3 minutes for your browser to load a new setting, depending on the your computer and network speed. For convenience, you can keep related pages open continuously.
---------- FAQ -----------
1. Why can't I see older breakout labels?
Due to system limit, 500 is the maximum of labels.
In order to see older breakout events, please Select Bull or Bear, instead of Both; Or Increase the threshold to filter weak breakouts.
2. How to watch more than 30 Forex?
Due to system limit, 30 assets is the maximum.
In order to watch more assets, user can open the indicator in another sub-chart, add your 2nd assets list, save the layout, set alerts for different lists respectively.
---------- Disclaimer ----------
By using or requesting access to the indicator, you acknowledge that you have read and accepted that the indicator and any related content, including but not limited to: user manual, tutorials, ideas, videos, chats, emails, blog, are for the purpose of trading strategies studying and paper trading.
If a customer or user uses the indicator or related content mentioned above for live trading or investment, she/he should take all risks and responsibility.
---------- Updates ----------
The latest updates override the previous description.
To activate a update: Close the browser, Reopen the chart and apply the indicator.
【外汇资产突破预警】指标绘制一系列外汇资产的突破事件,提供突破预警
任何大趋势都开始于一系列的价格突破。通过监控突破事件,可以俯瞰市場的運動
---------- 产品特征------------
用户自定义的交易品种列表,多达30个品种
用户自定义的突破门槛
适用于宽泛的时间维度:1分钟--1月
绘制整个市场的突破历史
漸進顏色 根據突破的力度
------------- 指标设置说明 -------------------
"展示牛熊突破?": 展示牛突破,熊突破或者两者
“用户自定义突破门槛”: 自己定义突破门槛,999代表默认的设置
"綠色為牛?": 切換標籤顏色,默認綠色為牛
“交易所”:用来定义资产前缀,可以为空
“资产后缀”: 用来定义资产后缀,可以为空
---------- 版本描述 ----------------
產品特徵後續可能變化,恕不事先通知
DEMO版本供試用
----------- 獲取指標使用權 ------------
通過私信聯繫作者,要求訂閱或試用
----------- 安裝指標 -----------------
加指標 -》 Invite-Only (左邊欄目)
點贊或者收藏指標
點擊安裝指標
----------- 關於載入時間 ---------------
可能需要1--3分鐘來完成載入,取決於用戶的電腦和網絡速度,方便起見可以保持相關頁面持續開啟
------- FAQ ----------
1. 如何查看更早的突破歷史
由於系統限制,500 個標籤是上限
為了查看更早的突破,請選擇牛或者熊,而不是兩者;或者提高"用戶自定義突破門檻" 來過濾掉弱突破
2. 如何監控更多資產?
由於系統限制,30個資產是上限
為了監控更多資產,可以在第二個子圖表加載指標,保存圖表,分別在不同的圖表設置突破預警
---------- 免責聲明 ----------
在要求獲得本指標使用權之前以及在使用本指標之前,用戶認可已經完全了解和接受:本指標僅供學習交流目的, 它不構成任何交易建議或者投資建議。用戶如果將指標用於其他用途,應自行承擔所有風險和責任。
本指標的開發者並非專業投資顧問,因此不對用戶的任何行为負責。
最近的更新會覆蓋之前的說明。請參閱更新來查看指標的新特徵和功能

Forex SWING TraderThis strategy is mainly designed for swing trading applied to FOREX.
In this case we make use of 2 moving averages but with different time frame, lets say 1h and 1 day.
When they cross above we would initially have a long trade, but in this strategy we trade it in reverse, so we would actually enter a short position.
The same for short trade.
At the same time we make use of hours for entry, so we can filter even better between the trades, and select the best possible hours for entries.
For exit we have 2 conditions : one is when we receive an opposite signal ( by default ).
The other is when a certain movement between moving averages, like lets say 1% of price movement, we will exit. This can act both as TP and SL.

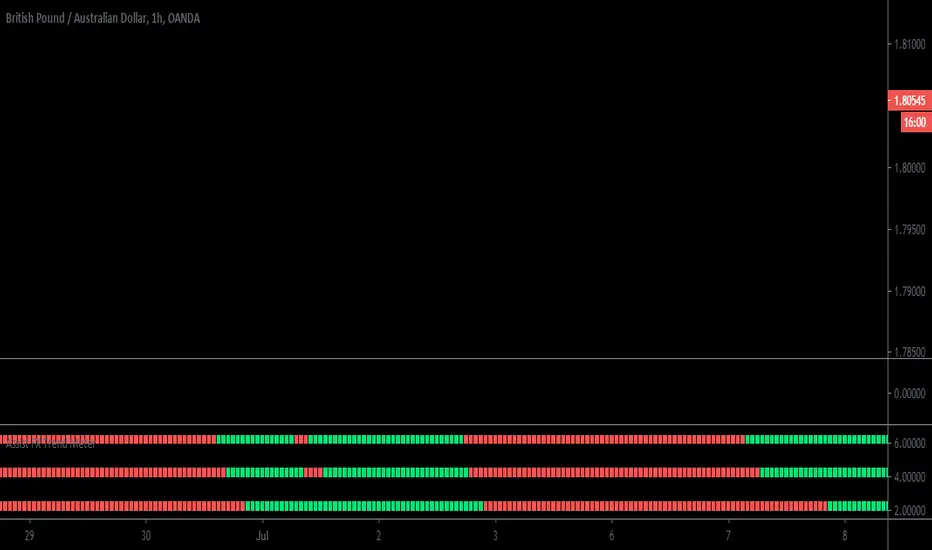
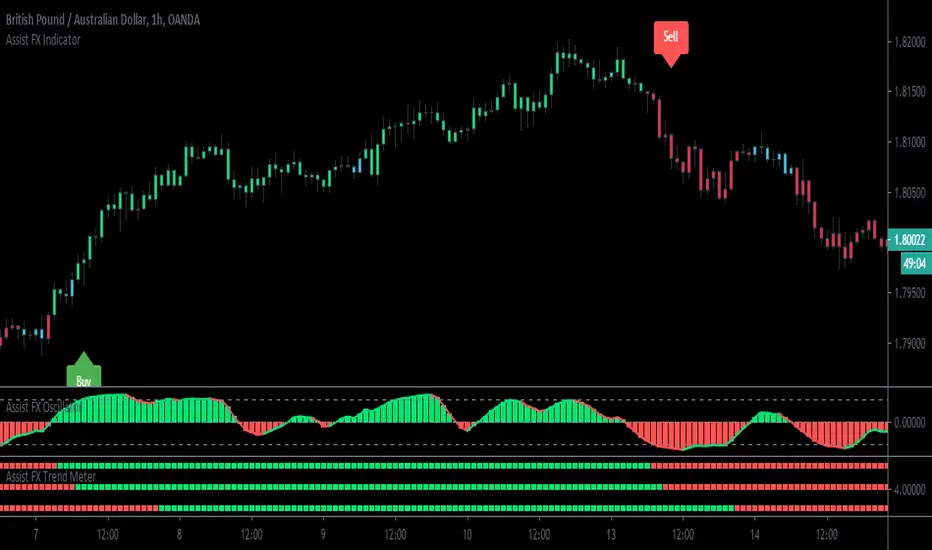
Assist FX Trend MeterWelcome to the Assist FX Trend Meter.
This trend meter is our own script that is based off Multiple Timezone Analysis and a Momentum Squeeze.
The Way the trend meter works is as follows it is based off the 1 Hour, 4 Hour and Daily time zones each line represents them times, If the market is "Bullish" you will get green lines , If the market is "Bearish" you will get red lines.
This you can use with other confluences, But most importantly helps you identify without switching between time zones which way the market is moving at the time you are looking at your chart.
If you have any questions or would like to use this script please send us a private message.
Thank you
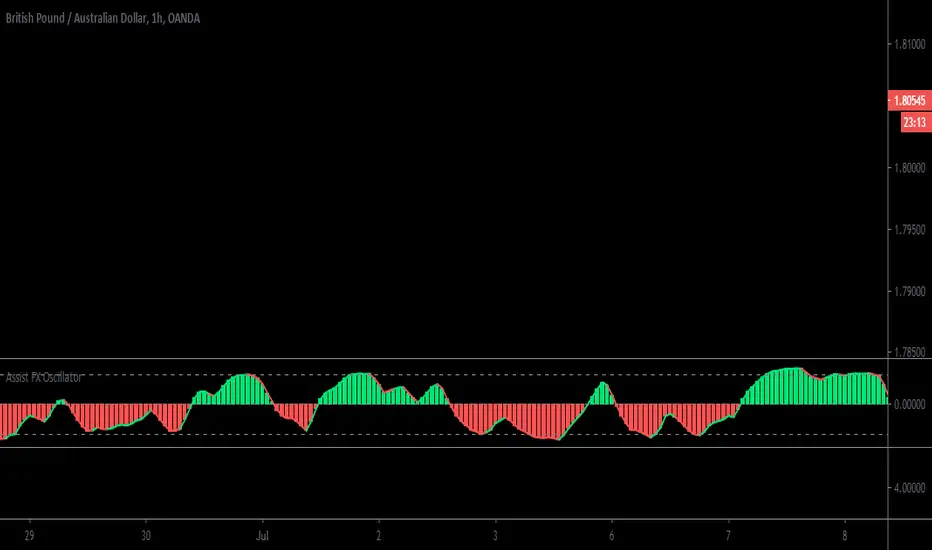
Assist FX OscillatorWelcome to The Assist FX Oscillator
This is our very own Oscillator that has been developed to Incorporate Trend Movement in the market and Volume Combined.
How do we know how to read the Oscillator?
When the Oscillator Turns "Green" this Suggests there is a potential Bullish Trend happening and Volume in the market , If it goes "Red" this would suggest the opposite and look Bearish.
We suggest you use this with other confluences before placing any trade.
If you have any questions or you would like to use this script please send us a private message.
Thank you very much.
Assist FX IndicatorWelcome to The Assist FX Indicator/Toolkit
This is a Strategy we have been working on for a long time now and were ready for Release.
How Does it work you ask?
Our strategy will help you identify the current trend in the market and based off the market movement and 3 other Confluences will Place "Buy" and "Sell" Signals on your Chart - Just to note for File this signals to Not Repaint.
This takes away most of the Technical Analysis for you , Yes we Suggest you also use your own Knowledge and Influence before placing your trades.
When all criteria is met in the code our signals appear, You will get a Red Sell signal for if the market is looking to go bearish and if you get a green buy signal the market is looking to go Bullish.
If you have any other questions relating to the indicator or you would like access , Please do not hesitate to contact us via private message and we will be able to assist you
Have a great day!
PpSignal Variable Move Average V 3.0A Variable Moving Average is an exponential moving average that automatically adjusts the smoothing weight based on the volatility of the data series. The more volatile the data is, the more weight is given to the more recent values. The Variable Moving Average solves a problem with most moving averages.
Blue: Buy
Red: Sell
Gray: Indecision hold

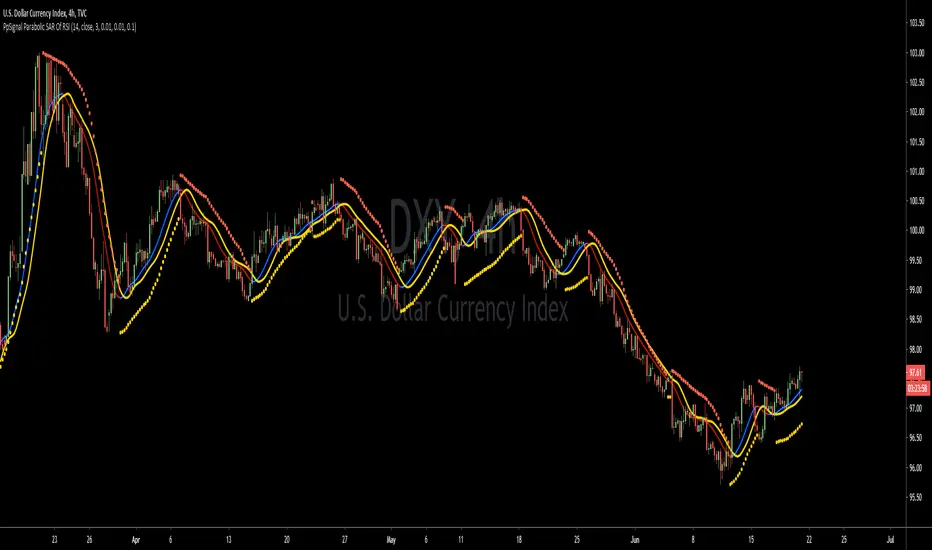
PpSignal Parabolic SAR Of RSI OscillatorThis indicator is parabolic zar of rsi oscillator style .
Buy when the rsi on the char is blue and psar is gold color.
sell when the rsi on the char is red and psar is orange.

PpSignal Parabolic SAR Of RSIThis indicator is parabolic zar of rsi.
Buy when the rsi on the char is blue and psar is gold color.
sell when the rsi on the char is red an psar is orange.
PpSignal Weis Volume & Volume in Bar V2.20This is an Advanced Weis Wave indicator which is based on Richard D. Wyckoff theory. It works in all time periods, range bar and tick bar charts and it can be applied to any market. The new Autowaves feature eliminates changing the parameters when switching time frames.
This indicator is adding the volumes of the corresponding price waves and draws a cumulative histogram. Each price wave is moving in a specific direction up or down until it reverses. In order for the indicator wave to reverse in the opposite direction, the price should exceed the number of points (pips*10) set in the indicator parameters. Therefore, the last wave repaints but the theory behind this trading method is forecasting where the market will go by reading mainly the previous waves.
The volume of the wave together with pip distance that the price has covered and the number of bars are displayed at the end of this wave. Speed Index is a new function noting the speed of the wave and can be displayed on the chart (the smaller this number is the faster the wave is and the larger this number is the slower the wave is)
Furthermore, an Alert (popup, email, push, sound) can be setup if the cumulative volume of the current wave exceeds a certain number specified in the parameters. An Alert can also be setup if Speed Index exceeds a specific value and/or is below a specific value.
Buy when the Weiss is aqua and sell when the Weiss is orange

Musashi-Hidden-Wave Trading SystemThis Indicator is a full trading system that offers setups with Entries and Targets and Trade Management. This indicator is very accurate because it uses advanced setup detection and filtering logic.
The setup is triggered if the price passes the blue dash. Do not enter the trade unless price passes the blue dash. Each setup has 3 possible targets, which are dashes colored green for longs and red for shorts.
You can use the baseline (which is a trend-line that is either green for bullish or red for bearish ) to manage the trade. You should only enter long trades if the trend-line is green, and only enter short trades if the trend-line is red. One strategy would be if you enter a trade long, and reach the first target, you can take some profits, but still let the some of the position run, where a bar closing beyond the baseline or breaks a prior opposite pivot, would stop out your remaining position.
To summarize:
Blue Dash = Entry Trigger
Green Dashes = Long Targets (3 of them, for different price targets: target 1, 2 and 3)
Red Dashes = Short Targets (3 of them, for different price targets: target 1, 2 and 3)
The great thing about this indicator is that its universal, there are no settings necessary -- just put it on the chart and it finds high probability setups and paints it on the chart as they occur. There is NO Repainting with this indicator.
Of course, you can add other indicators if you wish, and even add this indicator to your existing trading system.
Again, this indicator does NOT repaint.
Once a setup is found, the indicator draws the entry trigger price and the targets at the setup bar close.
Setup Alerts are fully supported, via email, sms , and desktop notification.
*If you wish to license this indicator, please contact me via private message for details regarding access. Thank you.
LEGAL STUFF:
Risk Disclosure
Futures , forex, stock, crypto and derivative trading contains substantial risk and is not for every investor. An investor could potentially lose all or more than the initial investment. Risk capital is money that can be lost without jeopardizing ones’ financial security or life style. Only risk capital should be used for trading and only those with sufficient risk capital should consider trading. Past performance is not necessarily indicative of future results
Hypothetical Performance Disclosure
Hypothetical performance results have many inherent limitations, some of which are described below. no representation is being made that any account will or is likely to achieve profits or losses similar to those shown; in fact, there are frequently sharp differences between hypothetical performance results and the actual results subsequently achieved by any particular trading program. One of the limitations of hypothetical performance results is that they are generally prepared with the benefit of hindsight. In addition, hypothetical trading does not involve financial risk, and no hypothetical trading record can completely account for the impact of financial risk of actual trading. for example, the ability to withstand losses or to adhere to a particular trading program in spite of trading losses are material points which can also adversely affect actual trading results. There are numerous other factors related to the markets in general or to the implementation of any specific trading program which cannot be fully accounted for in the preparation of hypothetical performance results and all which can adversely affect trading results

Theft Indicator - Pip GainerWhat is our indicator?
Theft Indicator - Pip Gainer is one of our recent published scripts that shows price action on a certain period of time (We Use a modified version of ATR). We take pride in enabling trading to become easier for the experienced and the non-experienced traders around the globe. Buy & Sell alerts will be fired once a condition in our algo is met.
Does it Repaint?
Our indicator does NOT re-paint. Although while setting an alert it may pop up the repaint alert, please take into consideration that once a signal is fired on a "CLOSED BAR", our signal will never disappear, they do not repaint.
What Markets is it usable with?
This version is dedicated to FOREX markets, we encourage using it for low timeframes starting the 3 minute to the 15 minute timeframe. WE RECOMMEND USING THIS IN THE FOREX MARKET, ESPECIALLY WITH CURRENCY PAIRS.
How to use:
Simple plug and play it to your chart, in addition to a few other indicators we will recommend to you (we still have not published them yet), and this will confirm your trades. You can also connect TV alerts with a bot and let it run. Please be aware that SLIPPAGE time is important, If you run a bot on this indicator you HAVE to know that the buy/sell price will be on the bar AFTER the Candle close (For example: the BUY/SELL alert is on a candle, the buy/sell your bot or you will execute WILL be in the following candle depending on your trading system. We advise you to not leave the bot to trade on its own, you have to monitor and have a specific syntax that we will help you with creating according to your trading style.
How are the Buy/Sell Alerts fired?
We use the simple ATR (Average True Range) indicator. However we have modified the indicator to serve our trading system. Check below for a definition of what ATR is:
What is Average True Range - ATR?
The average true range (ATR) is a technical analysis indicator that measures market volatility by decomposing the entire range of an asset price for that period. Specifically, ATR is a measure of volatility introduced by market technician J. Welles Wilder Jr. The true range indicator is taken as the greatest of the following: current high less the current low; the absolute value of the current high less the previous close; and the absolute value of the current low less the previous close. The average true range is then a moving average, generally using 14 days, of the true ranges.
Why is our indicator special and different from the normal ATR indicators?
We have modified the mathematical equation and changed it slightly to give more accurate signals, we do not promise all trades are profitable, the use of this indicator is up to your own judgement and liability. We believe that we have an indicator like no other ATR.
P.S: This is not financial advice, we are just sharing our indicator that we know has good results, and it will take time for people in -ve profiles to recover losses and for the profiting to be more profitable. We use a specific trading method that only works with it
You can contact me for more information about the indicator, Goodluck :)

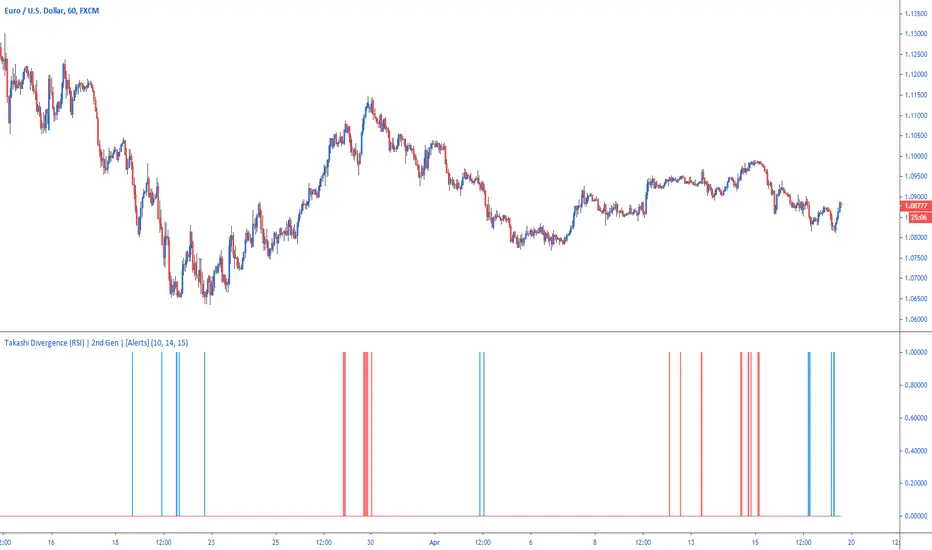
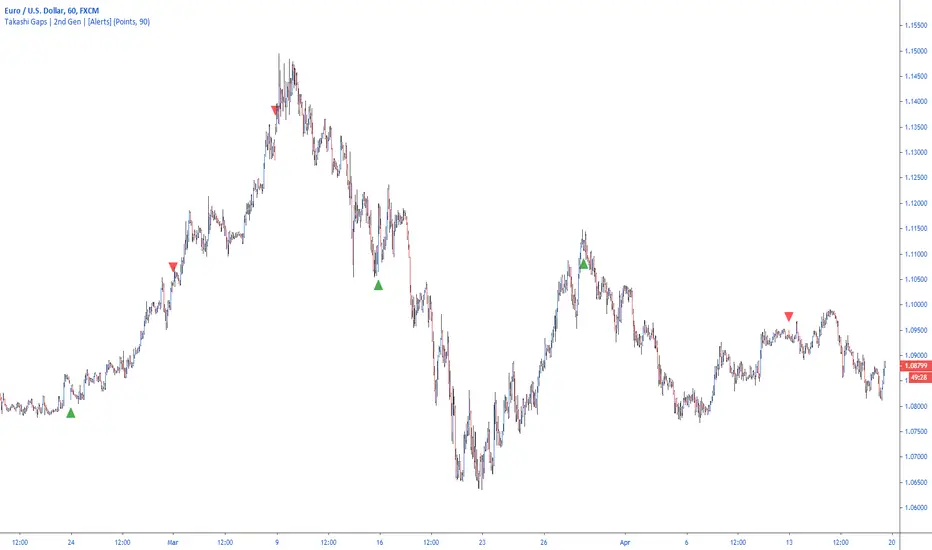
Takashi Divergence (RSI) | 2nd Gen | [Alerts]Easily highlight positive or negative divergence between price movement and RSI with Takashi-powered Divergence analysis.
Divergence strategy signals a potential reversal point because directional momentum does not confirm price. A bullish divergence occurs when the underlying market makes a lower low and RSI forms a higher low: RSI does not confirm the lower low and this shows strengthening momentum. A bearish divergence forms when the market records a higher high and RSI forms a lower high: RSI does not confirm the new high and this shows weakening momentum.
Inputs
Divergence Sensitivity
Float input. Sets a threshold after when the RSI divergence is triggered.
RSI Length
Integer input. The default setting used by most traders for the RSI is 14. That means that the indicator will go back 14 periods or time frames based on the chart being used (14 days on a Daily chart , 14 hours on an hourly chart and so forth) and make its calculation based on that.
Cross Distance
Integer input. Value from RSI that above or below 50 that classifies bullish or bearish levels. By default 15, that means the script will be checking for positive divergence when RSI is below 35 (50-15) and negative divergence when RSI is above 75 (50+15).
Use High & Low
Bool input. If true uses high and low values as RSI source.
To get access to this and other scripts check links below.
Takashi Gaps | 2nd Gen | [Alerts]Spot gaps between bars and benefit from the correction of the market as the price restores its position.
Inputs
Value In
Options input. Defines if the gap between bars will be checked by Points or Percent.
Gap Size
Float input. Value to trigger a signal if the gap between bars is bigger than.
To get access to this and other scripts check links below.
PowerBot Binary Backtest FrameworkHello Traders,
This is the backtest framework for testing the Powerbot algorithm before activating alerts which can be used for precise Trading.
Powerbot can be used across any timeframe and across any expiration based on the performance
This backtest comes with some features to help traders make a decision on the following:
When using the indicator itself.
1. We use our proprietary algorithm - "Powerbot binary algorithm script", which is Public but can only be accessed based on request. If you would like to use the algorithm please ensure you have tested different assets and varying expiration for your trades through the backtest - if you don't know how to do that please contact us by sending a message.
EXPLORE YOUR OPTIONS FOR TRADING THROUGH VARIED ITERATION.
2. You can choose any expiration time by changing the expiration time period from the 'settings' button, this will display new results. example; on a 5 minutes chart timeframe, 6 bars would be 30 minutes, which means 5 minutes times 6, which is 30 and minutes because your timeframe is set to minutes. Another example is that on a 1-hour timeframe, 12 bars would be 12 hours, given 1 * 12 is 12hours, because your timeframe is set to hours.
3. You can choose the trading session you want, please note that we have included the three most active sessions - ASIAN, EU/UK, & US Session, by default, the scripts checks for performance on 24/7, which means it does not omit trades outside of the trading session. The Tradingview time is in UTC (or GMT -4). The best times to trade are during sessions most active times.
This backtesting indicator is free to add to the chart if you would like to use the algorithm during your trading session you need to contact us. After which you can use the algorithm for as long as you want.
Please note that no signal can work in all timeframe across all markets that is why backtesting to search for algorithms with at least 50% performance ratio is excellent for trading. All you need is to diversify alerts across to assets or more to rake in profits.
If you require assistance in understanding what session would work best, you can send us a message to work through the process together.
Thank you for you support. This script is free to use to see potential of the indicator itself.
We are NOT allowed to advertise any script on sale based on tradingview house rules.
Wishing you all the best.

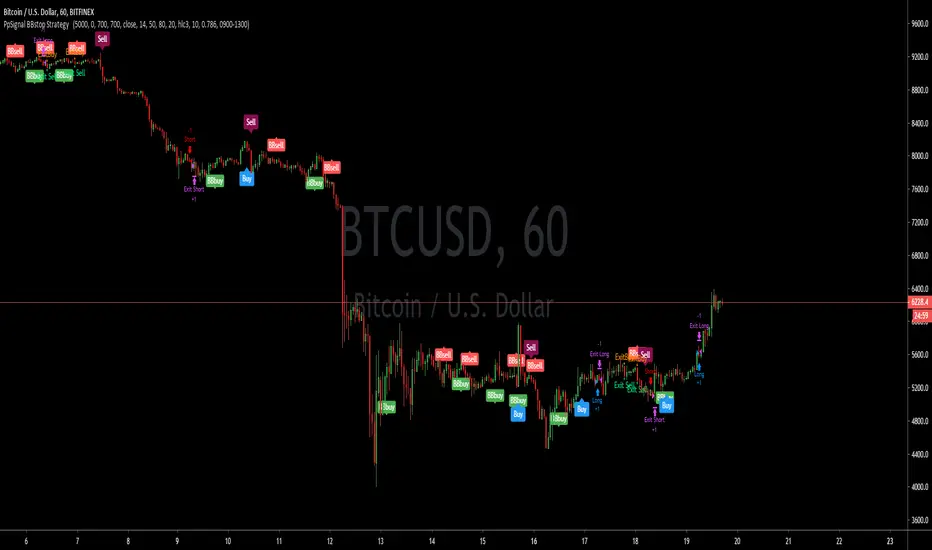
PpSignal BBstop Strategy strategy based on rsi of ma, in the example with btc usd we have as tp 1000 trailing stop 700, but you should adopt the money management to your criteria.
it has an alarm system when you see bbbuy or bbsell is a pre-notice only buy when the signal is Buy in blue or sell in maroon, it also has a buy exit and sell exit warning.
PpSignal drake delay oscillator GritasIt is a technique, when the drake oscillator moving averages (Drake Daly Statocastico) cross up you must buy and the histogram is painted in a green color .... when the drake oscillator crosses down and the histogram is painted red you must to sell.

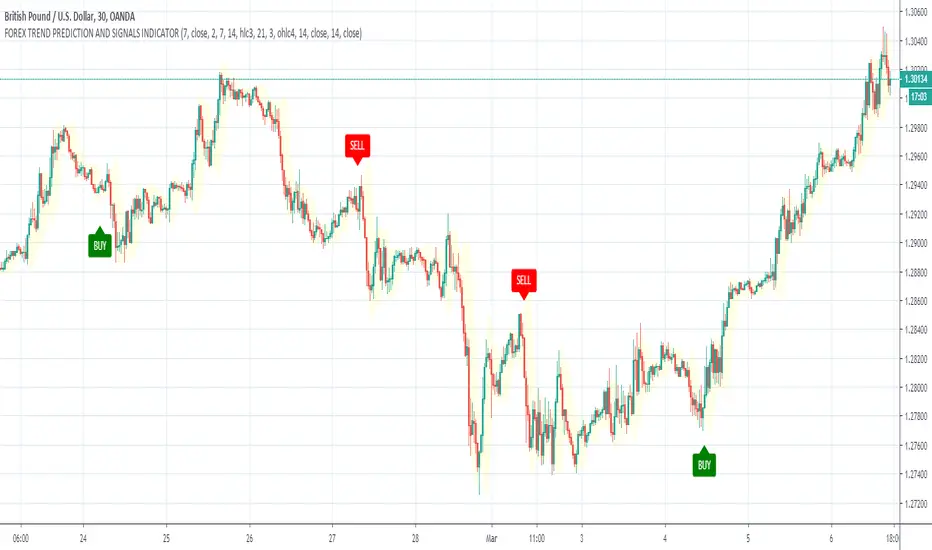
GBPUSD TREND DETECTION AND BUY/SELL ARROW SIGNALS INDICATORGBPUSD TREND DETECTION AND BUY/SELL ARROW SIGNALS INDICATOR
This script developed for active forex traders and based on Trend Analysis Indicators.
It used combination of Moving Averages, Volatility Indicator and Fractals and try to
detect reversal points of trends and generates buy/sell signals.
Works for all Forex currency pairs and time frames: 15MIN, 1H, 1DAY.
Can be used for swing trading and trend trading.
Advantage of this script indicator that all noise is filtered and signals detects long trends.
This make it useful as stand-alone trading strategy indicator or in combination with other indicators,
It is useful for day and intraday forex traders.
Main features of this indicator are:
✅ Forex Trend Reverse Points
✅ Forex breakout indicator
✅ Forex trend Signals
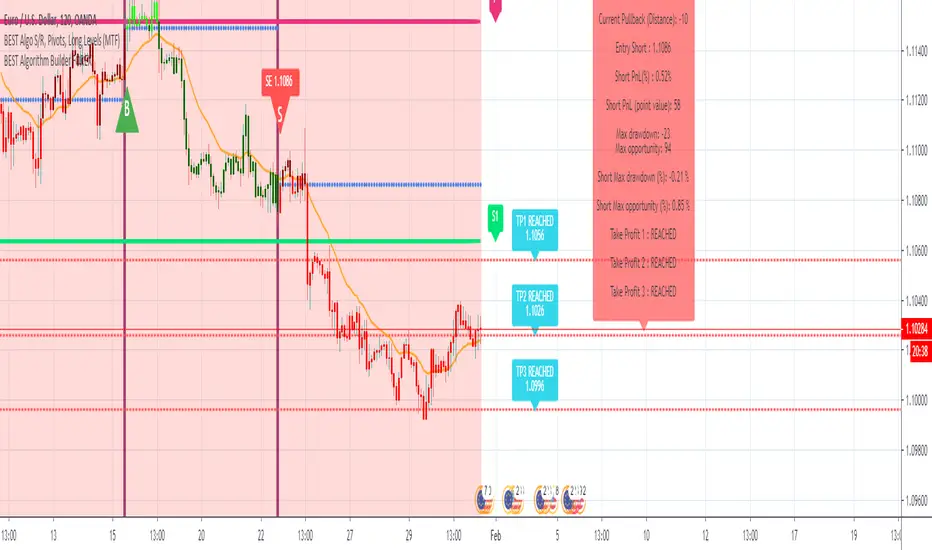
BEST Algorithm Builder FOREXHello traders 👋
I. 💎 SCRIPTS ACCESS AND TRIALS 💎
1. Every trial request access has to be done through my website.
2. My website URL is in this script signature at the very bottom (you'll have to scroll down a bit and going past the long description) and in my profile status available here: Daveatt
3. Many video tutorials explaining clearly how all our indicators work are available on our website > guides section and also on Discord + Youtube
4. You may also contact me directly for more information regarding the trading method included in the indicator or how to access it
II. Forewords
This indicator is for the Intraday FOREX traders looking for fixed entries based on our proprietary trading method.
We've been working on it for months and releasing now for our subscribers.
We designed this framework for FOREX major/minor/exotic pairs.
III. Optimized system for lowering risk/capturing most of the opportunities
We worked hard on reducing the risk as much as we could.
The built-in hard-exit (also called invalidation) system does a huge job in exiting a position way before a Stop Loss will get hit
EUR/USD
USD/CAD
IV. Trade Manager and compatible with dynamic alerts
It includes :
- our proprietary method with fixed entries
- a hard exit system (built-in stop-loss)
- multiple options for user-defined stop-loss/take-profit settings (price value, distance in pips, percentage, trailing, ...)
- 🔔 Compatible with dynamic alerts 🔔
Dynamic alerts are bringing automated trading to a whole new level. The third-party solutions capturing TradingView alerts are able to use them.
- Algorithmic Supports and Resistances used as safeguards and take profit zones
Final words
We made it as simple as we could (to be honest it's a very simple system for the end-user) - even with several hundreds of calculations in the indicator.
Please hit me up for any questions/feedbacks/comments
Become the BEST trader you deserve to be
Dave
First time coding - a 5min forex Scalping strategy This is my first attempt at producing a strategy in Pine Script.
I am NOT a professional coder. I'm not even a good coder at that. I've only started Pine Script coding since September 2019. I am teaching myself.
This script is far from finished. I need to tweak a number of things about this script. Namely:
Add a validity window to the 'trigger bar' condition. Ie, I want to shut down the condition when the price closes above EMA21
Change the order entry so they are stop orders, using the stop entry price derived from the signals
Make changes to lot sizing
Add a trailing stop condition
Comments welcome, but do not expect me to reply to any questions or requests. In fact, don't expect any replies from me. I consider myself notoriously bad at replies.
I do welcome any feedback from any seasoned coders out there, as I am still a novice coder, and have so much to learn!
As to anyone who wants to criticise me - constructive and helpful criticism are most welcome, criticism to make yourself feel superior to me - you kind can eat a dk.
For the strategy rules, google the user ForexSignals TV account and look for the video "SIMPLE and PROFITABLE Forex Scalping Strategy".
Share, learn, prosper
Peace to y'all
Serialhenry
6/11/19
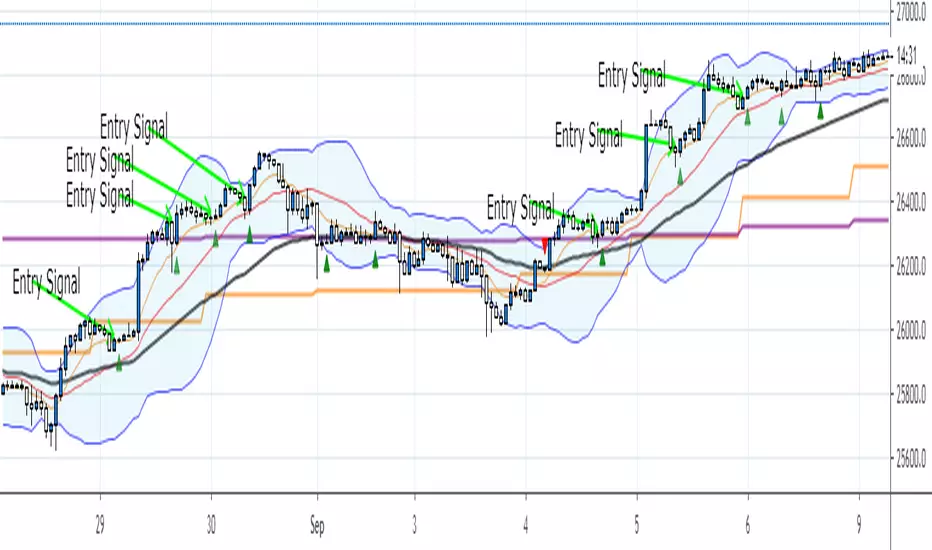
A.M E Trend
Hi Trading View,
This is my Custom Indicator and Strategy that i am currently using. This is a Trend following indicator that plots entries on certain market criteria.
The indicator will Plot Bollinger Bands and also 2 EMA's on the trading time frame and also 2 EMA's on the Daily time frame for quick view on overall market Direction.
This indicator is looking for:
Market Direction
Pullbacks to EMA's
Price Action
Lows and Highs
Trend continuation
Once these conditions are met the indicator will place signals onto the chart in the direction of the trade.
This indicator will look for both Long and Short Signals.
This indicator can be used on Multiple Time Frames and currency pairs.
I use this indicator mainly on the 15M and 1H chart.
You are also able to set alerts for the signals so if you are not near the charts all the time you will get a notification pop up on the trading view app
User discretion should be used while using this indicator, I look for rejection and reversal candles such as a Doji, Long Wick Bar or Engulfing.
Trading Rules:
Stop loss below or above previous low or high of signal bar.
Look for a 1:1 or 1:1.5 risk reward (some trades go way further).
Have Fun and Enjoy.
Ash