Forextrading

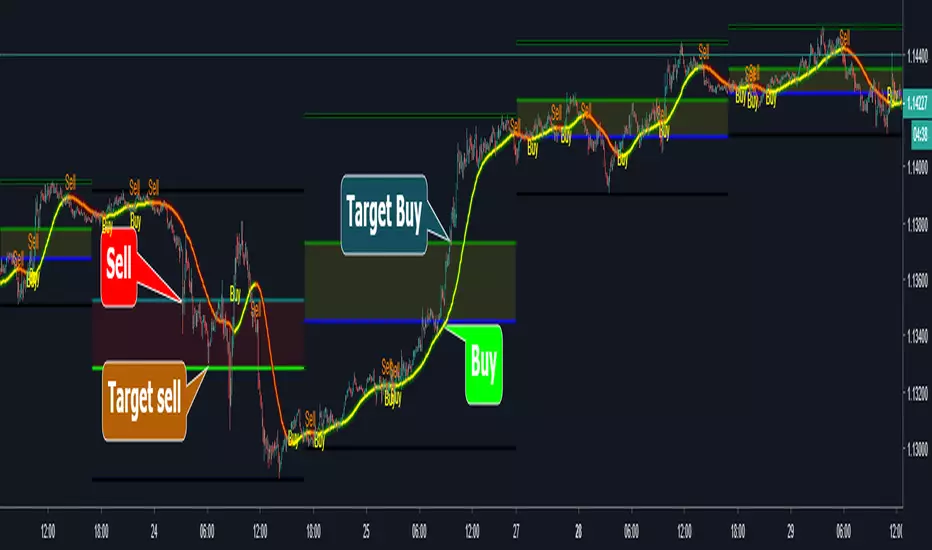
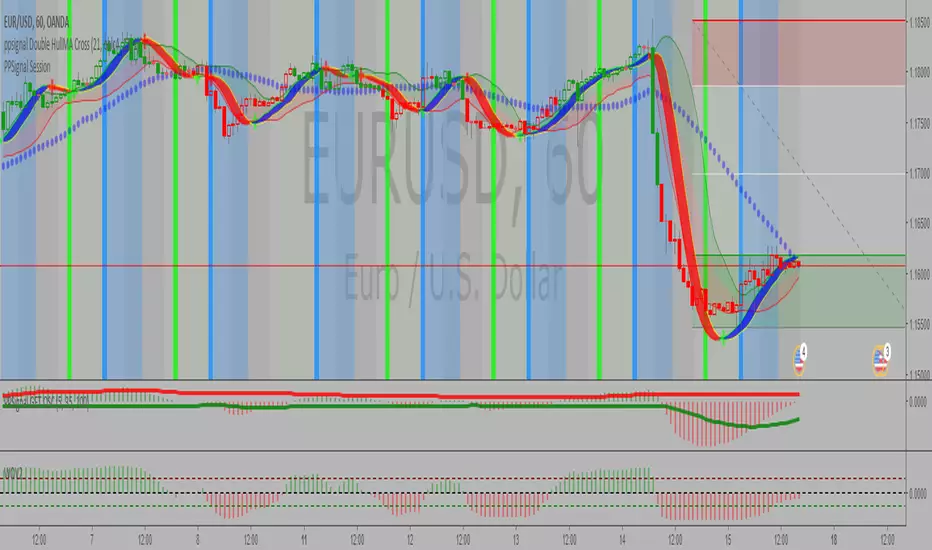
[astropark] Long-Short Strategy V2Buy/Long at next candle's open price when you see a green "B" label on the screen, considering green cloud as support for more buys/longs
Sell/short at next candle's open price when you see a red "S" label on the screen, considering red cloud as resistance for more shorts
If you appreciate my script, offer me a coffee, a beer, a pizza :)
BTC jar: 1K5kuYQPEqoNo6GRmJbHWMPmqwKM5S3oRR
ETH jar: 0x091b541a6dd6fe08c4e7bd909baafb2fce9b975e
LTC jar: LSVoAChsZrVsvbNyUfdpxtFpDAUSaUTUig
XRP jar: (XRP deposit tag) 103997763 (XRP deposit address) rEb8TK3gBgk5auZkwc6sHnwrGVJH8DuaLh
PS: Do you need a customization or do you need a dev who implements your strategy? send me a private message ;-)

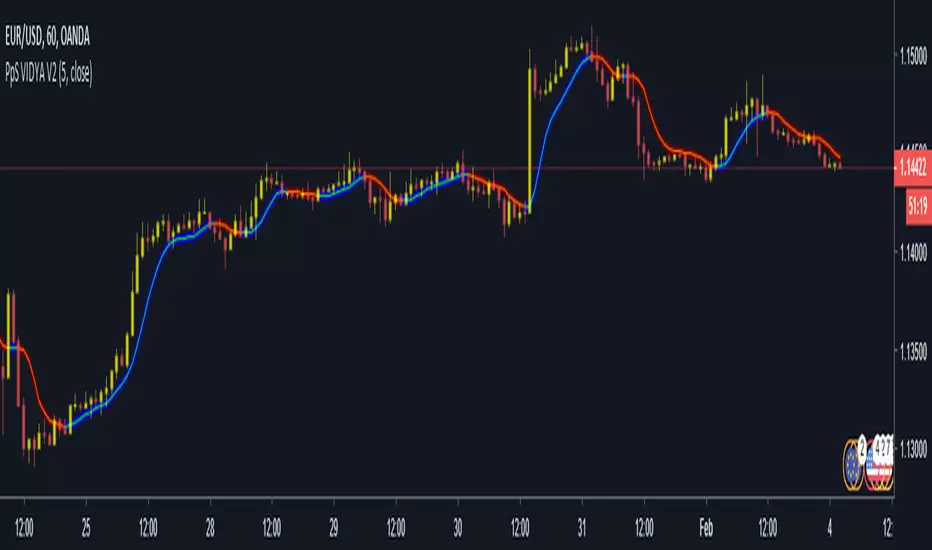
PpSignal Variable Index Dynamic Average V2The Moving Average is, perhaps, the most popular indicator in trading for a reason. Comparatively, the crossing average can tell you plenty about a trend, i.e. whether it’s broken or unbroken, changing or holding. But the Moving Average isn’t perfect; there is one area where it falls short and that is volatility. Even an Exponential Moving Average, which places more emphasis on the latest data, can miss the mark when it comes to a sudden change in volatility, rising or falling. Consequently, it can either give a fake signal or else generate a signal only when it is too late to trade on. Volatility is where the Variable Index Dynamic Average comes in, or VIDYA for short.
The Variable Index Dynamic Average or VIDYA was developed by Tushar Chande, and its focus is precisely on volatility. In other words, the VIDYA is an average that adjusts itself to changing volatility. When volatility is high, the VIDYA becomes more sensitive and when volatility is low, the VIDYA becomes less sensitive. That allows you to assess the trend according to current market conditions (and not irrelevant conditions that had earlier prevailed).
The VIDYA in Essence
The math behind the VIDYA formula is quite complicated, but the logic is not.
The VIDYA essentially has two components, the first being the Exponential Moving Average (aka EMA). The second indicator is in the “oscillator family” and it is known as the Chande Momentum Oscillator (aka CMO). Like most oscillators, the Chande Momentum Oscillator generates a signal of -100 and 100, with -100 being oversold and 100 overbought. The EMA is the anchor index, and the CMO’s job is to adjust the exponential average to volatility. The closer the CMO is to 100 or -100 the higher the volatility and the more sensitive our exponential average will turn. Conversely, the closer the CMO is to 0 the less sensitive our exponential average will turn. The final reading after the volatility adjustment is the VIDYA.
As you can see below, once you add the Variable Index Dynamic Average in MetaTrader you get a window with two parameters from which to choose: One is the Period CMO and the other is Period EMA. We can then decide which period the CMO will run on (and thus affect the sensitivity of our EMA) and which period the EMA will run on (to capture our trend). Usually, the best CMO to plug in is a third of the value of the EMA duration; this is to allow the latest change in volatility to impact to the greatest degree. If the CMO period is too long, it will likewise spread over the period too long and consequently fail to reflect current levels of volatility, thus defeating the VIDYA’s purpose.
VIDYA
Comparing the VIDA to the EMA
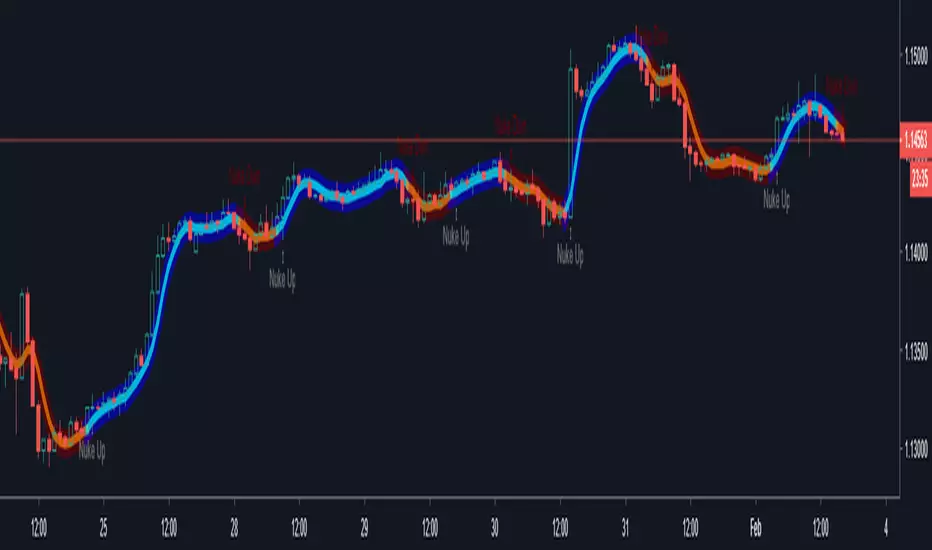
When we compare the two, we can see the clear advantages the VIDYA(Red) has over the EMA(Green). Both the VIDYA and the EMA run on a 30-week period, but the VIDYA is smoothed out by the Chande Momentum Oscillator running on a 10-week period (again, a third of the whole period). The VIDYA simply captures the trend much more accurately. We can see how, in Point A, when momentum weakens, the Variable Index Dynamic Average starts to flatten, while the EMA just moves across the price and fails to adjust.
This quality is especially beneficial when we want to get an indication if a trend has broken or not. The EMA, in this case, suggests the trend has, indeed, broken but when we look at the VIDYA we quickly get a more accurate picture. We can see that the downtrend has not been broken which allows us to prepare for another bearish round rather than mistakenly expect a rebound.
VIDYA
Of course, for every upside there is a downside and the downside of the VIDYA is that it becomes less effective on a very high duration, such as above 90. The Chande Momentum Oscillator cannot reflect sentiment very well when the duration ןד high and therefore it stops being effective at balancing the Exponential Moving Average within the Variable Index Dynamic Average. One way to tackle or mitigate this is to go higher in the intervals whenever possible, such as from days to weeks or weeks to months. Nonetheless, you should be cognizant of this in inherent weakness in the Variable Index Dynamic Average. Yet, despite that, the Variable Index Dynamic Average does a very effective job. If you are trading under volatile conditions and want to figure out if a trend is broken or set to continue, the Variable Index Dynamic Average could be the solution. When combined with other indicators of momentum, the VIDYA can give you the bigger, clearer picture.
www.onestepremoved.com

PpSignal Fibonacci Golden Zonefibonacci golden zone is a popular forex system for buy or sell fibo areas.
Buy in 38 fibo zone and sell in 61 fibo zone. when the fiboncci trend is up, the fill color between 28 and 61 is yellow, when the trend is down the fibonacci color is red.
a recommended use some move average with some oscillator for a find the trend.
Move average recommended serhttps://www.tradingview.com/script/guQUYY7J-PpSignal-Trend-Follow/
Oscillator see
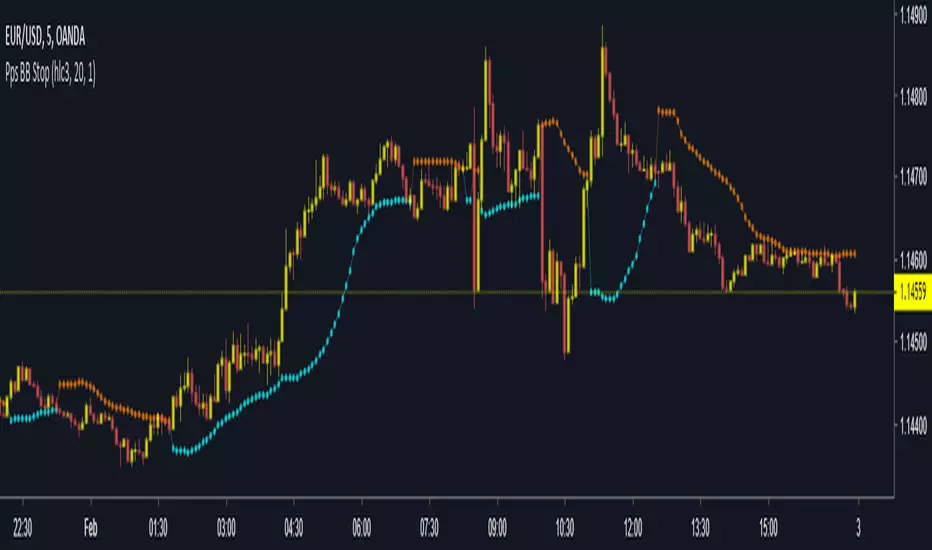
PpSignal Donchian Channels CFB and BB Strategy v 1.2Here we are combine cfb with bollinger band and donichian midle line channel estrategy
This technique is for those who want the most simple method that is very effective. The best trade are during the busiest trading hours, 3am to 12am EST NY time. This method does not work in sideways markets, only in volatile trending markets.
Time Frames: 1, 5, 10, 15, 30 min.
Currency pairs: majors and btc
Essential chart indicator
-Ppsignal EWO BB, (
PPSignal EWO Break Band
)
Other Chart indicators:
- Awesome Oscillator . (
PpSignal EWO LBR MTF
)
- Optionally Add Squeeze Indicator (
BB Squeeze Momentum Indicator
)
- Bollinguer band period 13 desviation 1.
BUY SIGNAL
-Ewo above 0
-CFB crosses the middle donichian channel.
-CFB crosses ariiba from the upper band of bollinguer band.
SELL SIGNAL
- Ewo below 0
- CFB crosses below the middle channel
- CFB crosses below the signal bb.
Wath is CFB?
PpSignal Composite Fractal Behavior (CFB)

USD/JPY/GBP/EUR merged from BTCxFIATBTC market 24h 365D (data from BitFinex BTCxFIAT)
BitUSDJPY = BTCJPY / BTCUSD
BitEURJPY = BTCJPY / BTCEUR
BitGBPJPY = BTCJPY / BTCGBP
BitEURUSD = BTCUSD / BTCEUR
BitGBPUSD = BTCUSD / BTCGBP
BitEURGBP = BTCGBP/ BTCEUR
It may complement the holiday time of forex
this indicator need to apply on BTC chart(virtual currency cahrt)

USDJPY merged from BTCUSD/JPYBTC market 24h 365D
BitUSDJPY = BTCJPY / BTCUSD
It may complement the holiday time of forex
this indicator need to apply on BTC chart(virtual currency cahrt)


Forex Correlations HeatmapHello friends,
This tool is built for forex traders who want a clean, visual way to understand how currency pairs move together. It builds a color-coded correlation matrix between your current chart symbol and a customizable list of forex pairs, helping you quickly spot strong positive or negative relationships across majors, crosses, and extended FX watchlists.
🛠️ How It Works
You provide a comma-separated watchlist of forex tickers (e.g., EURUSD,USDJPY,GBPUSD,...). The script then:
Filters this list based on your selected Display Mode (All pairs, or only AUD, CAD, CHF, EUR, GBP, JPY, NZD, or USD-related pairs).
Paginates long watchlists into pages of up to 40 tickers , so you can scroll through large FX universes without overloading the chart.
For each pair on the current page, it calculates the Pearson correlation over a user-defined lookback window, using your chosen price source (close, HL2, HLC3, etc. via the custom source selector).
The resulting correlations are plotted as a heatmap: each cell's color and intensity reflect the strength and direction of the relationship.
You can switch between multiple professional color palettes to better match your visual preferences and quickly distinguish strong positive, strong negative, and neutral correlations.
🔥 Key Features
Custom watchlist input via a simple text area (paste or type your pairs)
Pagination support - view up to 40 symbols per page for smoother performance
Flexible Display Modes : All pairs, or focused views like AUD pairs, EUR pairs, USD pairs, etc.
Configurable correlation lookback period
Customizable correlation source via an advanced source selector module
Multiple professional color palettes : Blue/Red, Blue/White/Red, Green/Pink, Green/Red, Green/Yellow/Red, Purple/Orange, Spectral, Viridis
Clear visual mapping of correlation strength and sign through color intensity
👋 Good luck and happy trading!
有料スクリプト

Top 10 Forex Swing Screener V 1.0
Top 10 Forex Swing Screener
Options:
Left-bars and Right-bars look back to find Top | Bottom point.
Set Alarm: After add script on your chart, click on add alarm and select the scrip name below your chart symbol, then select alarm you need and add.
Guide for colors and shapes:
Green: Price Cross Over high swing.
Red: Price Cross Under low swing.
Orange: Price Cross Over low swing or Price Cross Under high swing.
Green Triangle Up: pivot High in symbol.
Red Triangle Down: pivot Low in symbol.
Note: The script operates independently of the chart you in. for use this script, you can favorite it and then apply to any chart.

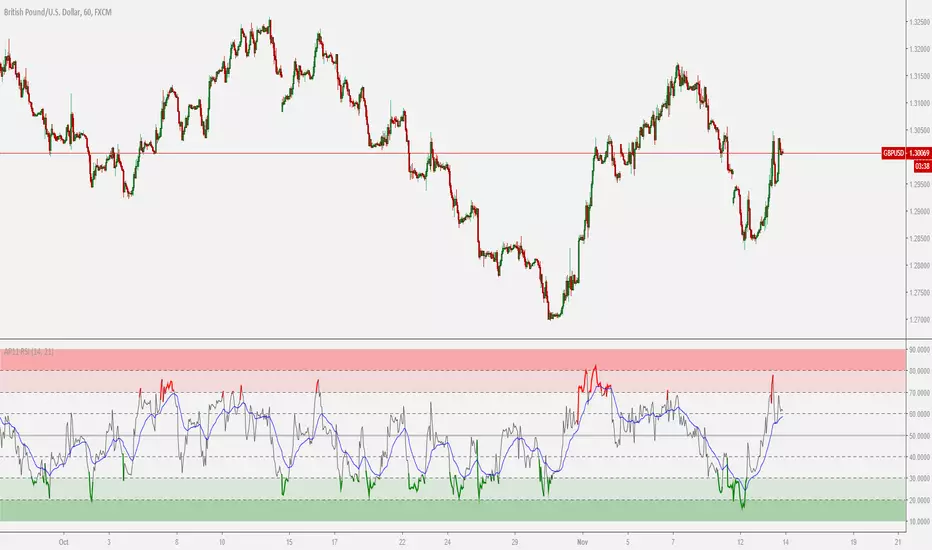
TTM Apollo 11 RSIColor coded RSI to give a better indication of when to buy or sell based on the RSI level along with an included EMA signal to help describe the trend.
Forex Trade Sessions / Zones + Next Session VisibleAllows User To See Next Session.
Contains all 5 Forex Sessions: New York, London, Frankfurt, Asia (Tokyo), Sydney
Warning! A little buggy on smaller time frames like the 5 minute. 15 minute seems to work fine!

Opening asian Range 7 h FOREX.COM by Blackwolf v2.0This script is programmed for FOREX.COM with Rome Time Zone and is shows the min & max price reached in asian session every day.
Lo script mostra il massimo ed il minimo della sessione asiatica. Impostato per broker FOREX.COM e fuso orario di ROMA

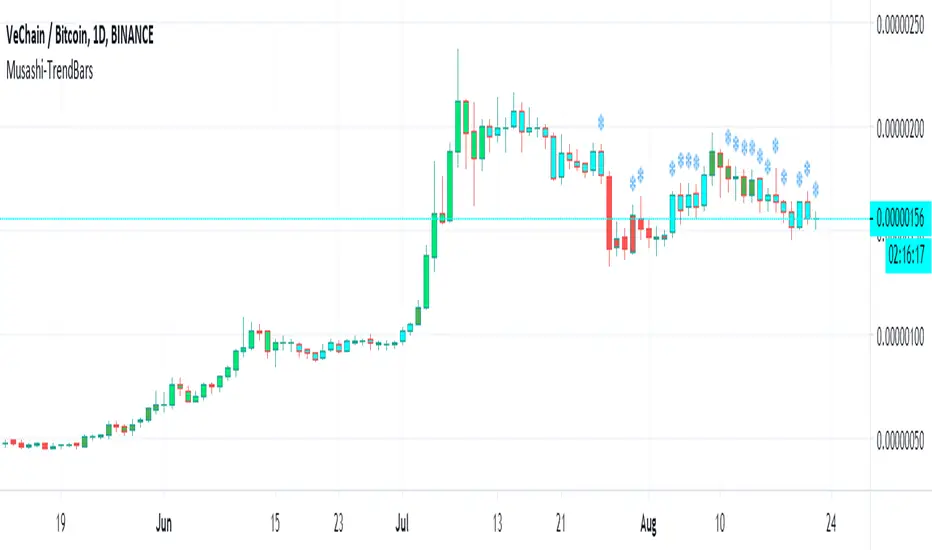
Musashi-TrendBarsThis is a script that has a unique approach to trending. This offers a multi-phase concept of trending, which is shown by a multitude of colors. This non-repainting indicator will predict the phases of trend change and progression. This script is under research at this point, and is considered an alpha version.
LEGAL STUFF:
Risk Disclosure
Futures , forex, stock, crypto and derivative trading contains substantial risk and is not for every investor. An investor could potentially lose all or more than the initial investment. Risk capital is money that can be lost without jeopardizing ones’ financial security or life style. Only risk capital should be used for trading and only those with sufficient risk capital should consider trading. Past performance is not necessarily indicative of future results
Hypothetical Performance Disclosure
Hypothetical performance results have many inherent limitations, some of which are described below. no representation is being made that any account will or is likely to achieve profits or losses similar to those shown; in fact, there are frequently sharp differences between hypothetical performance results and the actual results subsequently achieved by any particular trading program. One of the limitations of hypothetical performance results is that they are generally prepared with the benefit of hindsight. In addition, hypothetical trading does not involve financial risk, and no hypothetical trading record can completely account for the impact of financial risk of actual trading. for example, the ability to withstand losses or to adhere to a particular trading program in spite of trading losses are material points which can also adversely affect actual trading results. There are numerous other factors related to the markets in general or to the implementation of any specific trading program which cannot be fully accounted for in the preparation of hypothetical performance results and all which can adversely affect trading results
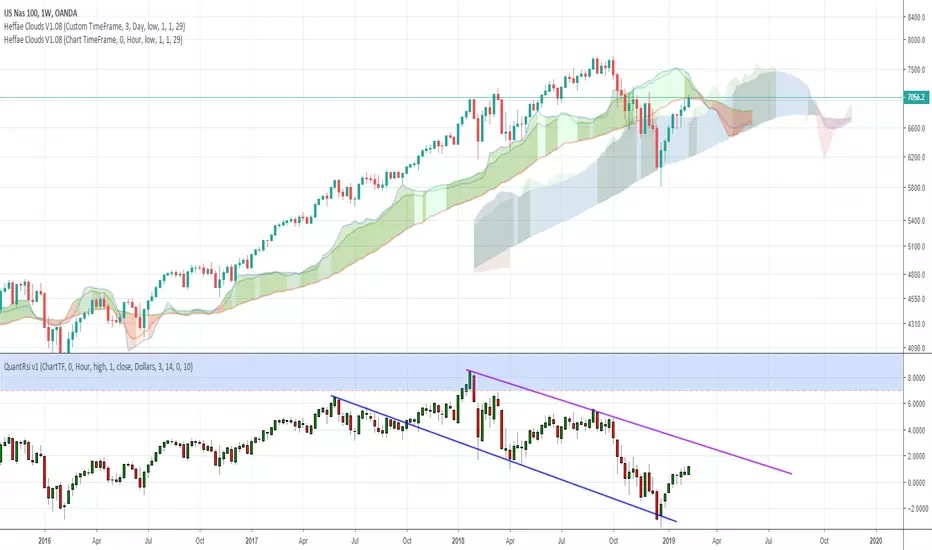
Heffae Clouds v1.00Heffae Clouds v1.0 - Ichimoku Modernized
Heffae Clouds Alpha release Version 1.0
Heffae Clouds functions as adaptive support and resistance. It has real-time paths and offset clouds, similar to ichimoku.
Paths are calculated by the complex discovery of prior behaviour for any crypto or forex asset.
Uses 5 single layer networks to calculate the optimal path fitting for any asset or timeframe.
The cloud color provides granular detail on path validity.
Please see the pastebin link for access information and links:
pastebin.com
Video introduction and trading strategy:
Some Beta-tester comments:
"It's like now having a microscope if you get what I mean. Which says great things about what you have done here. Love it man"
"I just find myself makes so many good decisions with your system it's hard to believe"
"this is without a doubt an improvement of Ichimoku (Which is my favorite tool by far). So much more info with your cloud system.."
Looney's Forex Buy SignalsI created this Forex buy signal indicator to save myself some time when looking for buy opportunities. The signals are generated from a combination of several indicators such as the RSI, MACD, Wave Oscillator etc. I spent alot of time tweaking all the values to give me reliable signals. I trade one hour candles and generally get 50+ pips per signal.
If price goes down after the first signal and I get another signal, I buy again which means I get a average buy price (dollar cost average) and then sell when it reaches my profit level.
Alerts are built-in as well. The indicator does repaint at the moment so set the alert to "on candle close" to ensure that you get a valid signal. Longer timeframes works better and as mentioned I use 1 hour candle.
I will release the back-test of this indicator shortly where you can then enter your capital amount and set profit & stop loss levels to see how you would have performed based on historical data.
The current version is free and I will grant access on request.
Comments & suggestions welcome.

Currency StrengthRepublished: The original script violated house rules by including an external link to Backtest Rookies.
Background
The currency strength indicator takes up to 4 forex pairs and calculates the average strength across all pairs. The indicator uses the pair's daily percentage change to calculate the overall strength. For flexibility, it can accept any instrument as an input. This means you can use multiple instances to track various currency strengths. It was designed with the major pairs in mind but there is no reason why it cannot be used for other FX pairs.
Note: The indicator defaults to GBP. When setting it up for other currencies, be sure to flag whether the currency is a counter currency or not.
The code is provided free and open source. Please modify it as you see fit.
Screenshots
Defaults with Annotation
Yen strength beating pound strength
Opposing Trends

(Dollar Based ) FOREX Position Size CalculatorThe FOREX calculator uses the Adaptive Channel lines to determine your initial stop. You can input your portfolio value, % risk per trade and it will determine the number of lots. It will automatically recalculate when you switch to a different currency pair. You can choose to go long or short the currency pair and the number of lots will recalculate. There is also an option to choose your own initial stop value. Helps you stay consistent with position sizing and risk management.
The Adaptive channels can also work as entry points and to follow the trend of the trade until it reverses. The calculator works on any time frame from 5 minute charts to weekly charts.
This version uses the U.S. dollar as its base currency when calculating pip value and position size. It also calculates on roughly 30+ pairs. It doesn't convert to other currencies yet, but the plan is to add other base currencies in the near future.

Pullback Trading Tool R5-65 by JustUncleLBy request this is an updated version of the "PullBack Trading Tool": removes experimental "OCC" channel, added option to display ribbons or just single moving average lines, added alert arrows for "PB" exits, added alertcondition for TV alarm subsystem, added some extract options for Pivot points and general cleanup of code.
Description:
This project incorporates the majority of the indicators needed to analyse and trade Trends for Pullbacks, swings and reversals.
Incorporated within this tool are the following indicators:
1. Major industry (Banks) recognised important EMAs in an EMA Ribbon:
Lime = EMA5 (Optional Display)
DodgerBlue = EMA12 (Optional Display)
Red = EMA36 (Optional display)
Green = EMA89
Blue = EMA200
Black = EMA633
2. The 5 EMA (default) High/Low/Close Price Action Channel (PAC), the PAC channel display is disabled by default.
3. Optionally display Fractals and optional Fractal levels
4. Optional HH, LH, LL, HL finder.
5. Optional Buy/Sell "PB" exit Alerts with Optional 200EMA filter.
6. Coloured coded Bar high lighting based on the PAC:
blue = bar closed above PAC
red = bar closed below PAC
gray = bar closed inside PAC
7. Alert condition sent to TradingView's Alarm subsystem for PB exits.
8. Pivot points with optional labels.
9. EMA5-12 Ribbon is displayed by default.
10.EMA12-36 Ribbon is displayed by default
Set up and hints:
I am unable to provide a full description here, as Pullback Trading incorporates a full trading Methodology, there are a number of articles and books written on the subject.
Set the chart to Heikin Ashi Candles (optional).
I also add a "Sweetspot Gold R3" indicator to the chart as well to help with support and resistance finding and shows where the important "00" lines are.
First on a weekly basis say Sunday night or Monday morning, analyse the Daily and Weekly charts to establish overall trends, and support/resistant levels. Draw significant mini trend lines (2/3 TL), vertical trend lines (VTL) and S/R levels. Can use the Pivots points to guide VTL drawing and Fractals to help guide 2/3 TL drawing.
Once the trend direction and any potential major reversals highlighted, drop down to lower timeframe chart and draw appropriate mini Trend line (2/3 TL) matching the established momentum direction. Take note of potential pull backs from and of the EMAs, in particular the EMA5-12 ribbon, EMA12-36 Ribbon and the 200EMA. Can use the Pivots and/or Fractals points to guide your 2/3 TL drawing.
Set a TradingView alarm on the "PBTOOL alert", with the default settings this normally occurs before or during the Break of the manually drawn TL lines.
Once alerted check to see if the TL is broken and is returning to trend away from the EMA lines, this is indicated by bar colour change to trend directional colour.
You can trade that alert or drop down to even lower time frames and perform the same TL analysis there to find trades at the lower TF. Trading at lower TF you will allow tighter Stop loss settings.
Other than the "SweetSpot Gold R3" indicator, you should not need any other indicator to successfully trade trends for Pullbacks and reversals. If you really want another indicator I suggest a momentum one for example: AO ( Awesome Oscillator ), MACD or Squeeze Momentum.
