First FVG Custom Time RangeFirst FVG — Opening Range Fair Value Gap Detector
Smart Money Opening Imbalance Strategy Tool
This script automatically detects and highlights the first Fair Value Gap (FVG) that forms between 9:30 and 10:00 AM Eastern Time (New York session open) — a critical period often referred to as the Opening Range. It’s designed for Smart Money traders looking to isolate early-morning inefficiencies that may influence market behavior throughout the trading day.
🔍 What This Script Does:
Automatically Detects the First FVG in the Opening Range
Scans price action between 9:30 and 10:00 AM ET and identifies the first valid bullish or bearish FVG that forms.
Only one FVG is shown per day — ensuring a clean, focused view.
Draws a Visual Zone
Once detected, the FVG zone is extended forward on the chart (customizable duration).
A labeled zone helps users track how price reacts to it throughout the session.
Optional Retest Alerts
Alerts you when price re-enters the zone — a potential reaction point used by SMC traders.
Customization Options
Set your preferred session time window
Adjust zone duration (in bars)
Customize label font size, colors, and visibility
Enable/disable alert on retest
📈 Why the First FVG Matters:
Time-Sensitive Setup: The first FVG typically forms no earlier than 9:31 AM ET and represents a potential “time distortion” or imbalance zone created by aggressive market participants during the open.
Behavioral Study: Many traders journal how price behaves around this zone each day — whether it acts as support, resistance, or gets traded through later in the session.
Predictive Value: Observing how this zone is respected or broken can provide anticipatory insight into intraday price action, rather than reactive analysis.
Great for New Traders: This opening FVG is often recommended as a starting reference point for building trade models and understanding how institutional imbalances unfold.
🚀 What Makes It Unique:
This tool doesn’t spam your chart with every FVG. It laser-focuses on a single, time-bound zone backed by institutional logic — the first presented imbalance of the day during the opening range.
Use it to:
Monitor price behavior around early inefficiencies
Plan journal entries and pattern recognition
Align intraday setups with a high-probability SMC model
Whether you’re scalping, journaling market structure, or refining entries based on liquidity behavior — this script helps you make the first 30 minutes count.
Fvg

FVG + Swings + ConfigurableOverview
This Pine Script v5 indicator highlights Fair Value Gaps (FVGs), plots swing‑high and swing‑low pivots, and marks single breakouts above the last swing‑high or below the last swing‑low by recoloring the breakout candle. Every aspect—gap size, count limits, colors, and feature toggles—is exposed as an input so you can tailor it to your own workflow.
Key Features
Fair Value Gaps
Detects bullish gaps when the high of bar i-2 is below the low of the current bar.
Detects bearish gaps when the low of bar i-2 is above the high of the current bar.
Draws a semi‑transparent rectangle spanning from bar i-2 to bar i + extension.
Automatically deletes oldest boxes when exceeding the user’s “Max FVG Boxes” limit.
Swing‑High / Swing‑Low Pivots
Identifies a swing‑high when the middle candle of a three‑bar sequence has the highest high.
Identifies a swing‑low when the middle candle has the lowest low.
Marks each pivot with a tiny dot above (high) or below (low) the bar.
Single Breakouts
Tracks the most recent swing‑high and swing‑low levels.
On the first close above the last swing‑high (or below the last swing‑low), recolors that single candle.
Prevents repeated coloring until a new swing pivot forms.
Full Customization
Show/Hide toggles for FVGs, swing pivots, breakouts.
Numeric inputs for FVG extension length and maximum retained boxes.
Color pickers for bullish/bearish gaps, swing pivots, and breakout candles.

FVG, Swing, Target, D/W/M High Low Detector Basic by Trader Riaz"FVG, Swing, Target, D/W/M High Low Detector Basic by Trader Riaz " is a powerful TradingView indicator designed to enhance your trading strategy by identifying key market structures and levels. This all-in-one tool detects Fair Value Gaps (FVGs), Swing Highs/Lows, and previous Day, Previous Week, and Previous Month Highs/Lows, helping traders make informed decisions with ease.
Key Features:
Bullish & Bearish FVG Detection: Highlights Fair Value Gaps with customizable colors, labels, and extension options.
Swing Highs & Lows: Automatically detects and marks Swing Highs and Lows with adjustable display settings and extensions.
Next Target Levels: Identifies potential price targets based on market direction (rising or falling).
Daily, Weekly, and Monthly High/Low Levels: Displays previous day, week, and month highs/lows with customizable colors.
Customizable Settings: Fully adjustable inputs for colors, number of levels to display, and extension periods.
Clean Visuals: Intuitive and non-intrusive design with dashed lines, labels, and tooltips for better chart readability.
This indicator is ideal for traders looking to identify key price levels, improve market structure analysis, and enhance their trading strategies.
Happy Trading,
Trader Riaz

Consecutive CandlesSummary
This indicator helps visualize short-term momentum by automatically drawing boxes around sequences of consecutive same-colored candles (bullish or bearish). It's designed to quickly highlight periods of sustained buying or selling pressure directly on your chart.
How it Works
Consecutive Candle Detection: The script monitors the chart bar by bar, tracking consecutive candles where close > open (bullish) or close < open (bearish).
Box Drawing: When a sequence of same-colored candles reaches a user-defined minimum length (default is 3) and this sequence is then broken by an opposite-colored candle or a doji, a box is drawn.
Box Boundaries:
The top of the box is set to the highest high price reached during the sequence.
The bottom of the box is set to the lowest low price reached during the sequence.
The left edge of the box aligns with the start time of the first candle in the sequence.
The right edge of the box aligns with the end time of the last candle in the sequence.
Stability: Uses xloc = xloc.bar_time to ensure boxes remain accurately anchored to the price bars when zooming or panning the chart.
Real-time Extension: For active sequences meeting the minimum length on the latest developing bar, the box is optionally extended to the right.
Features
Automatically identifies and boxes sequences of 3 or more (customizable) consecutive bullish candles.
Automatically identifies and boxes sequences of 3 or more (customizable) consecutive bearish candles.
Extends box in real-time for active qualifying sequences.
Customizable minimum candle count (>= 2).
Customizable colors for bullish/bearish boxes and borders.
Settings
You can customize the indicator via the Settings menu (gear icon):
Minimum Consecutive Candles: Define how many candles in a row are needed to draw a box (Default: 3).
Bullish Box Color: Set the fill color for boxes around bullish sequences.
Bearish Box Color: Set the fill color for boxes around bearish sequences.
Box Border Color: Set the color for the border of all boxes.
Potential Use Cases
Momentum Identification: Quickly spot periods of strong, uninterrupted buying or selling.
Exhaustion/Reversal Signals: Very long sequences might indicate potential exhaustion, setting up reversal opportunities.
Consolidation Breakouts: A box forming after a period of tight consolidation can highlight the range just before a potential breakout.
Confirmation: Use the boxes as confirmation for entries or exits based on momentum shifts.
Disclaimer: This indicator provides visual aids based on price action. It should not be used as a standalone trading system. Always use indicators in conjunction with your own analysis and risk management rules.

Multitimeframe Fair Value Gap – FVG (Zeiierman)█ Overview
The Multitimeframe Fair Value Gap – FVG (Zeiierman) indicator provides a dynamic and customizable visualization of institutional imbalances (Fair Value Gaps) across multiple timeframes. Built for traders who seek to analyze price inefficiencies, this tool helps highlight potential entry points, unmitigated gaps, and directional bias using smart volume logic and adaptive visual elements.
A Fair Value Gap (FVG) forms when there's a three-candle sequence in which a market imbalance leaves a "gap" between the wicks of candle 1 and candle 3. These areas are often considered footprints of institutional activity, and this indicator gives you the tools to track them with surgical precision across any timeframe you choose—regardless of the one you're viewing.
This indicator also includes a trend filter powered by a low-pass Butterworth filter, enabling traders to distinguish between countertrend vs. trend-aligned FVGs for more intelligent decision-making. On top of that, it features a dynamic FVG table for live tracking and bull/bear volume power visualization inside each gap, adding powerful clarity to market intent.
█ How It Works
The indicator analyzes the open, high, low, close, and volume of candles from a user-selected timeframe. It identifies Fair Value Gaps based on wick logic and only confirms those that meet customizable strength criteria. Once detected, the indicator visualizes each FVG with dynamically extending boxes, optional buy/sell volume bars, and a real-time mitigation check.
⚪ Multitimeframe Logic
Users can analyze FVGs from a higher or lower timeframe regardless of their current chart.
This is achieved using request.security() to fetch OHLCV data from the chosen timeframe.
⚪ Wick Sensitivity & Impulse Filter
The script measures the wick size of potential FVG candles and compares them to a running average. Only FVGs with wick sizes above a certain sensitivity threshold (user-controlled) are plotted. This ensures only meaningful price dislocations (e.g., strong impulsive moves) are shown, reducing noise.
⚪ Midpoint Mitigation Logic
FVGs are marked as "mitigated" when the price revisits the gap area. Traders can choose whether full gap closure or just a midpoint touch is required. This allows faster reactivity in real-time trading environments.
⚪ Bull & Bear Power – Volume-Weighted Visualization
Every Fair Value Gap box includes sub-bars representing the estimated buy and sell effort that created the gap. These are calculated using the candle's close in relation to its high/low range and volume:
Buy Volume % ≈ effort from low to close
Sell Volume % ≈ effort from high to close
Each sub-bar inside the FVG:
Is color-coded (UpCol for bullish, DnCol for bearish)
Is drawn proportionally to the strength of buyers or sellers
Visually displays who was in control during the imbalance
⚪ FVG Table – Dynamic On-Chart Overview
The indicator includes an optional on-chart table that displays all currently active (unmitigated) FVGs in a side panel format:
Automatic updates as gaps are formed and mitigated
Color-coded rows to show bullish vs. bearish FVGs
Timestamps to know precisely when the gap formed
User-controlled position via Table Left and Table Right
This is a gap watchlist overlay, giving traders a concise view of current inefficiencies without manually scanning the chart.
⚪ FVG Trend Filter (Butterworth Smoother)
Using a two-pole Butterworth low-pass filter, the indicator computes a trendline based on average FVG values, offering a smooth but responsive directional signal.
Passband Ripple (dB): Controls sensitivity and overshoot tolerance
Cutoff Frequency (0–0.5): Sets how quickly the trendline reacts
The trendline helps categorize each FVG:
Trend up → favor bullish FVGs
Trend down → favor bearish FVGs
It adds an extra dimension to FVG entries, helping distinguish between trend-aligned and countertrend signals.
█ How to Use
⚪ Identify Institutional Gaps
Use this tool to identify areas where institutions may have left imbalances behind quickly.
These areas often become:
Strong support/resistance zones
Areas where price might react sharply
Targets for liquidity sweeps or retracements
⚪ React to Trend or Countertrend
The built-in trendline helps categorize each FVG:
Trend up → Bullish FVGs have higher validity
Trend down → Bearish FVGs have higher validity
⚪ Volume Context via Bull/Bear Power
Each Fair Value Gap is more than just a price imbalance — it’s a story of effort and intent. The Bull/Bear Power feature visualizes the buy and sell pressure behind each FVG, helping you understand how the gap was formed and who was in control.
A bullish FVG with a strong buy effort suggests continuation potential — buyers dominated the move.
A bullish FVG with a dominant sell effort could signal a trap or reversal — sellers may have overwhelmed the breakout.
These insights allow you to confirm imbalance strength, spot traps early, and add confidence to entries based on dominant volume profiles.
Instead of viewing gaps as static zones, this feature turns each into a live volume map — a visual breakdown of who moved the market and whether that move had conviction.
⚪ Plan with the FVG Table
The FVG Table acts as your on-chart control center for tracking active imbalances. When enabled, it provides a clear summary of all unmitigated Fair Value Gaps, helping you stay organized and focused during fast-moving sessions.
Track live and historical gaps: See exactly when and where each FVG formed.
Monitor older, still-valid zones: Gaps off-screen but not mitigated remain in play — perfect for anticipating future reactions.
Gauge market bias at a glance: The balance of bullish vs. bearish FVGs helps you understand overall directional pressure.
Plan entries confidently: Use the table to reference all zones for risk management, confluence stacking, or layered execution strategies.
Instead of manually scanning your chart, the FVG Table offers a clean, at-a-glance overview of the market’s inefficiencies — giving you the structure needed to act with precision.
█ Settings
FVG Timeframe
Select any timeframe to source FVGs independent of your current chart.
Sensitivity
Filter FVGs by how impulsive the move is — it helps you eliminate weak gaps.
Mitigated on Mid
Control whether gaps are removed at midpoint touch or full fill.
Table Settings
Control the table position and width. Cleanly view all active FVGs.
FVG Style
Customize gap box colors, length, and bullish/bearish overlays.
Trend Filter
Enable or disable the smoothed FVG-based trendline with customizable smoothing controls.
-----------------
Disclaimer
The content provided in my scripts, indicators, ideas, algorithms, and systems is for educational and informational purposes only. It does not constitute financial advice, investment recommendations, or a solicitation to buy or sell any financial instruments. I will not accept liability for any loss or damage, including without limitation any loss of profit, which may arise directly or indirectly from the use of or reliance on such information.
All investments involve risk, and the past performance of a security, industry, sector, market, financial product, trading strategy, backtest, or individual's trading does not guarantee future results or returns. Investors are fully responsible for any investment decisions they make. Such decisions should be based solely on an evaluation of their financial circumstances, investment objectives, risk tolerance, and liquidity needs.

Smarter Money Concepts - FVGs [PhenLabs]📊 Smarter Money Concepts - FVGs
Version: PineScript™ v6
📌 Description
Smarter Money Concepts - FVGs is a sophisticated indicator designed to identify and track Fair Value Gaps (FVGs) in price action. These gaps represent market inefficiencies where price moves quickly, creating imbalances that often attract subsequent price action for mitigation. By highlighting these key areas, traders can identify potential zones for reversals, continuations, and price targets.
The indicator employs volume filtering ideology to highlight only the most significant FVGs, reducing noise and focusing on gaps formed during periods of higher relative volume. This combination of price structure analysis and volume confirmation provides traders with high-probability areas of interest that institutional smart money may target during future price movements.
🚀 Points of Innovation
Volume-Filtered Gap Detection : Eliminates low-significance FVGs by requiring a minimum volume threshold, focusing only on gaps formed with institutional participation
Equilibrium Line Visualization : Displays the midpoint of each gap as a potential precision target for trades
Automated Gap Mitigation Tracking : Monitors when price revisits and mitigates gaps, automatically managing visual elements
Time-Based Gap Management : Intelligently filters gaps based on a configurable timeframe, maintaining chart clarity
Dual Direction Analysis : Simultaneously tracks both bullish and bearish gaps, providing a complete market structure view
Memory-Optimized Design : Implements efficient memory management for smooth chart performance even with numerous FVGs
🔧 Core Components
Fair Value Gap Detection : Identifies price inefficiencies where the current candle’s low is higher than the previous candle’s high (bearish FVG) or where the current candle’s high is lower than the previous candle’s low (bullish FVG).
Volume Filtering Mechanism : Calculates relative volume compared to a moving average to qualify only gaps formed during significant market activity.
Mitigation Tracking : Continuously monitors price action to detect when gaps get filled, with options to either hide or maintain visual representation of mitigated gaps.
🔥 Key Features
Customizable Gap Display : Toggle visibility of bullish and bearish gaps independently to focus on your preferred market direction
Volume Threshold Control : Adjust the minimum volume ratio required for gap qualification, allowing fine-tuning between sensitivity and significance
Flexible Mitigation Methods : Choose between “Wick” or “Close” methods for determining when a gap has been mitigated, adapting to different trading styles
Visual Customization : Full control over colors, transparency, and style of gap boxes and equilibrium lines
🎨 Visualization
Gap Boxes : Rectangular highlights showing the exact price range of each Fair Value Gap. Bullish gaps indicate potential upward price targets, while bearish gaps show potential downward targets.
Equilibrium Lines : Dotted lines running through the center of each gap, representing the mathematical midpoint that often serves as a precision target for price movement.
📖 Usage Guidelines
General Settings
Days to Analyze : Default: 15, Range: 1-100. Controls how many days of historical gaps to display, balancing between comprehensive analysis and chart clarity
Visual Settings
Bull Color : Default:(#596fd33f). Color for bullish Fair Value Gaps, typically using high transparency for clear chart visibility
Bear Color : Default:(#d3454575). Color for bearish Fair Value Gaps, typically using high transparency for clear chart visibility
Equilibrium Line : Default: Enabled. Toggles visibility of the center equilibrium line for each FVG
Eq. Line Color : Default: Black with 99% transparency. Sets the color of equilibrium lines, usually kept subtle to avoid chart clutter
Eq. Line Style : Default: Dotted, Options: Dotted, Solid, Dashed. Determines the line style for equilibrium lines
Mitigation Settings
Mitigation Method : Default: Wick, Options: Wick, Close. Determines how gap mitigation is calculated - “Wick” uses high/low values while “Close” uses open/close values for more conservative mitigation criteria
Hide Mitigated : Default: Enabled. When enabled, gaps become transparent once mitigated, reducing visual clutter while maintaining historical context
Volume Filter
Volume Filter : Default: Enabled. When enabled, only shows gaps formed with significant volume relative to recent average
Min Ratio : Default: 1.5, Range: 0.1-10.0. Minimum volume ratio compared to average required to display an FVG; higher values filter out more gaps
Periods : Default: 15, Range: 5-50. Number of periods used to calculate the average volume baseline
✅ Best Use Cases
Identifying potential reversal zones where price may react after extended moves
Finding precise targets for take-profit placement in trend-following strategies
Detecting institutional interest areas for potential breakout or breakdown confirmations
Plotting significant support and resistance zones based on structural imbalances
Developing fade strategies at key market structure points
Confirming trade entries when price approaches significant unfilled gaps
⚠️ Limitations
Works best on higher timeframes where gaps reflect more significant market inefficiencies
Very choppy or ranging markets may produce small gaps with limited predictive value
Volume filtering depends on accurate volume data, which may be less reliable for some symbols
Performance may be affected when displaying a very large number of historical gaps
Some gaps may never be fully mitigated, particularly in strongly trending markets
💡 What Makes This Unique
Volume Intelligence : Unlike basic FVG indicators, this script incorporates volume analysis to identify the most significant structural imbalances, focusing on quality over quantity.
Visual Clarity Management : Automatic handling of mitigated gaps and memory management ensures your chart remains clean and informative even over extended analysis periods.
Dual-Direction Comprehensive Analysis : Simultaneously tracks both bullish and bearish gaps, providing a complete market structure picture rather than forcing a directional bias.
🔬 How It Works
1. Gap Detection Process :
The indicator examines each candle in relation to previous candles, identifying when a gap forms between the low of candle and high of candle (bearish FVG) or between the high of candle and low of candle (bullish FVG). This specific candle relationship identifies true structural imbalances.
2. Volume Qualification :
For each potential gap, the algorithm calculates the relative volume compared to the configured period average. Only gaps formed with volume exceeding the minimum ratio threshold are displayed, ensuring focus on institutionally significant imbalances.
3. Equilibrium Calculation :
For each qualified gap, the script calculates the precise mathematical midpoint, which becomes the equilibrium line - a key target that price often gravitates toward during mitigation attempts.
4. Mitigation Tracking :
The indicator continuously monitors price action against existing gaps, determining mitigation based on the selected method (wick or close). When price reaches the equilibrium point, the gap is considered mitigated and can be visually updated accordingly.
💡 Note:
Fair Value Gaps represent market inefficiencies that often, but not always, get filled. Use this indicator as part of a complete trading strategy rather than as a standalone system. The most valuable signals typically come from combining FVG analysis with other confirmatory indicators and overall market context. For optimal results, start with the default settings and gradually adjust parameters to match your specific trading timeframe and style.

Imbalance(FVG) DetectorImbalance (FVG) Detector
Overview
The Imbalance (FVG) Detector is a technical analysis tool designed to highlight price inefficiencies by identifying Fair Value Gaps (FVGs). These gaps occur when rapid price movement leaves an area with little to no traded volume, which may later act as a zone of interest. The indicator automatically detects and marks these imbalances on the chart, allowing users to observe historical price behavior more effectively.
Key Features
- Automatic Imbalance Detection: Identifies bullish and bearish imbalances based on a structured three-bar price action model.
- Customizable Sensitivity: Users can adjust the minimum imbalance percentage threshold to tailor detection settings to different assets and market conditions.
- Real-time Visualization: Marked imbalances are displayed as colored boxes directly on the chart.
- Dynamic Box Updates: Imbalance zones extend forward in time until price interacts with them.
- Alert System: Users can set alerts for when new imbalances appear or when price tests an existing imbalance.
How It Works
The indicator identifies market imbalances using a three-bar price structure:
- Bullish Imbalance: Occurs when the high of three bars ago is lower than the low of the previous bar, forming a price gap.
- Bearish Imbalance: Occurs when the low of three bars ago is higher than the high of the previous bar, creating a downward gap.
When an imbalance is detected:
- Green Boxes indicate bullish imbalances.
- Red Boxes indicate bearish imbalances.
- Once price interacts with an imbalance, the box fades to gray, marking it as tested.
! Designed for Crypto Markets
This indicator is particularly useful in crypto markets, where frequent volatility can create price inefficiencies. It provides a structured way to visualize gaps in price movement, helping users analyze historical liquidity areas.
Customization Options
- Min Imbalance Percentage Size: Adjusts the sensitivity of the imbalance detection.
- Alerts: Users can enable alerts to stay notified of new or tested imbalances.
Important Notes
- This indicator is a technical analysis tool and does not provide trading signals or financial advice.
- It does not predict future price movement but highlights historical price inefficiencies.
- Always use this tool alongside other market analysis methods and risk management strategies.

ICT FVG & Swing Detector Basic by Trader RiazICT FVG & Swing Detector Basic by Trader Riaz
Unlock Precision Trading with the Ultimate Fair Value Gap (FVG) and Swing Detection Tool!
Developed by Trader Riaz , the ICT FVG and Swing Detector Basic is a powerful Pine Script indicator designed to help traders identify key market structures with ease. Whether you're a day trader, swing trader, or scalper, this indicator provides actionable insights by detecting Bullish and Bearish Fair Value Gaps (FVGs) and Swing Highs/Lows on any timeframe. Perfect for trading forex, stocks, crypto, and more on TradingView!
Key Features:
1: Bullish and Bearish FVG Detection
- Automatically identifies Bullish FVGs (highlighted in green) and Bearish FVGs (highlighted in red) to spot potential reversal or continuation zones.
- Displays FVGs as shaded boxes with a dashed midline at 70% opacity, making it easy to see the midpoint of the gap for precise entries and exits.
- Labels are placed inside the FVG boxes at the extreme right for clear visibility.
2: Customizable FVG Display
- Control the number of Bullish and Bearish FVGs displayed on the chart with user-defined inputs (fvg_bull_count and fvg_bear_count).
- Toggle the visibility of Bullish and Bearish FVGs with simple checkboxes (show_bull_fvg and show_bear_fvg) to declutter your chart.
3: Swing High and Swing Low Detection
- Detects Swing Highs (blue lines) and Swing Lows (red lines) to identify key market turning points.
- Labels are positioned at the extreme right edge of the lines for better readability and alignment.
- Customize the number of Swing Highs and Lows displayed (swing_high_count and swing_low_count) to focus on the most recent market structures.
4: Fully Customizable Display
- Toggle visibility for Swing Highs and Lows (show_swing_high and show_swing_low) to suit your trading style.
- Adjust the colors of Swing High and Low lines (swing_high_color and swing_low_color) to match your chart preferences.
5: Clean and Efficient Design
- Built with Pine Script v6 for optimal performance on TradingView.
- Automatically removes older FVGs and Swing points when the user-defined count is exceeded, keeping your chart clean and focused.
- Labels are strategically placed to avoid clutter while providing clear information.
Why Use This Indicator?
Precision Trading: Identify high-probability setups with FVGs and Swing points, commonly used in Smart Money Concepts (SMC) and Institutional Trading strategies.
User-Friendly: Easy-to-use inputs allow traders of all levels to customize the indicator to their needs.
Versatile: Works on any market (Forex, Stocks, Crypto, Commodities) and timeframe (1M, 5M, 1H, 4H, Daily, etc.).
Developed by Trader Riaz: Backed by the expertise of Trader Riaz, a seasoned trader dedicated to creating tools that empower the TradingView community.
How to Use:
- Add the Custom FVG and Swing Detector to your chart on TradingView.
- Adjust the input settings to control the number of FVGs and Swing points displayed.
- Toggle visibility for Bullish/Bearish FVGs and Swing Highs/Lows as needed.
- Use the identified FVGs and Swing points to plan your trades, set stop-losses, and target key levels.
Ideal For:
- Traders using Smart Money Concepts (SMC), Price Action, or Market Structure strategies.
- Those looking to identify liquidity grabs, imbalances, and trend reversals.
- Beginners and advanced traders seeking a reliable tool to enhance their technical analysis.
Happy trading!

TR FVG & Swing High Low FinderTR FVG & Swing Level Finder
Overview:
The TR FVG & Swing Level Finder is a powerful Pine Script indicator designed for traders who want to identify Fair Value Gaps (FVGs) and Swing Highs/Lows on their charts. This indicator combines two essential technical analysis tools into one, helping traders spot potential areas of support, resistance, and trend reversals. FVGs are price gaps that often act as areas of interest for price to return to, while swing highs and lows help identify key turning points in the market. The indicator is highly customizable, allowing users to adjust colors, limits, and display options to suit their trading style.
Key Features:
1: Fair Value Gap (FVG) Detection:
- Identifies Bullish FVGs: Occur when the high of two candles ago is lower than the low of the current candle, indicating a potential upward price movement.
- Identifies Bearish FVGs: Occur when the low of two candles ago is higher than the high of the current candle, indicating a potential downward price movement.
- Displays FVGs as colored boxes on the chart, with customizable border and fill colors based on the timeframe.
- Labels each FVG box with the corresponding timeframe (e.g., "1m FVG", "1h FVG", "Daily FVG").
2: Swing High and Swing Low Detection:
- Detects Swing Highs: A 3-candle pattern where the middle candle's high is higher than the highs of the candles on either side.
- Detects Swing Lows: A 3-candle pattern where the middle candle's low is lower than the lows of the candles on either side.
- Draws a solid black line with 50% opacity at each swing high and low, extending 5 bars to the right for better visibility.
- Adds a small Swing High or Swing Low label at the right end of each line, colored according to user-defined settings.
3: Timeframe-Specific FVG Visualization:
- FVGs are color-coded based on the chart's timeframe, making it easy to distinguish between FVGs on different timeframes.
- Each timeframe has its own fill color for bullish and bearish FVGs, with adjustable transparency for better chart clarity.
- A dashed black line is drawn in the middle of each FVG box to highlight the midpoint of the gap.
4: Customizable Display Options:
- FVG Limit: Control the maximum number of FVGs displayed on the chart (from 1 to 20).
- Extend Options for FVG Boxes:
- "None": FVG boxes extend only 2 bars to the right.
- "Limited": FVG boxes extend a user-defined number of candles to the right (1 to 100 candles).
- "Default": FVG boxes extend 3 bars to the right of the current bar.
- Color Customization:
- Set border colors for bullish and bearish FVGs.
- Adjust fill colors for FVGs on different timeframes (1m, 5m, 15m, 30m, 1h, 4h, Daily, Weekly, Monthly).
- Customize the colors of swing high and swing low labels.
5: Performance Optimization:
- The indicator only plots FVGs and swings on the last confirmed bar (barstate.islastconfirmedhistory), ensuring efficient performance and reducing chart clutter.
- Limits the number of displayed FVGs and swings to the user-defined fvgLimit, keeping the chart clean and focused on the most recent price action.
6: Inputs and Customization:
- Number of FVGs to Show (fvgLimit): Set the maximum number of FVGs and swings to display (default: 3, range: 1 to 20).
- Bullish FVG Border Color (bullishColor): Choose the border color for bullish FVGs (default: green).
- Bearish FVG Border Color (bearishColor): Choose the border color for bearish FVGs (default: red).
- Swing High Color (swingHighColor): Set the color for swing high labels (default: blue).
- Swing Low Color (swingLowColor): Set the color for swing low labels (default: purple).
- Extend Options:
- Extend Option (extendOption): Choose how far FVG boxes extend to the right ("None", "Limited", or "Default"; default: "Default").
- Extend Candles (extendCandles): If "Limited" is selected, specify the number of candles to extend FVG boxes (default: 8, range: 1 to 100).
- Timeframe-Specific Fill Colors:
- Customize fill colors for bullish and bearish FVGs on various timeframes (1m, 5m, 15m, 30m, 1h, 4h, Daily, Weekly, Monthly).
- Each fill color has a default transparency (e.g., 93% for most timeframes, 90% for 30m), which can be adjusted as needed.
How to Use:
1: Add the Indicator to Your Chart:
- Open TradingView, go to the Pine Editor, and paste the script.
- Click "Add to Chart" to apply the indicator to your current chart.
2: Adjust Settings:
- Open the indicator settings by clicking the gear icon next to the indicator name on your chart.
- Modify the inputs to suit your preferences:
- Set the number of FVGs and swings to display.
- Choose your preferred colors for FVGs and swings.
- Adjust the extend options for FVG boxes.
3: Interpret the Indicator:
- FVG Boxes: Look for colored boxes on the chart, which represent Fair Value Gaps. Bullish FVGs (green borders by default) suggest potential buying opportunities, while bearish FVGs (red borders by default) suggest potential selling opportunities. The label inside each box indicates the timeframe of the FVG.
- Swing Highs and Lows: Identify key turning points with solid black lines (50% opacity) at swing highs and lows. Each line extends 5 bars to the right, with an "SH" (Swing High) or "SL" (Swing Low) label at the end. Swing highs can act as resistance levels, while swing lows can act as support levels.
4: Combine with Your Strategy:
- Use FVGs to identify areas where price might return to fill the gap, often acting as support or resistance.
- Use swing highs and lows to spot potential trend reversals or to set stop-loss and take-profit levels.
- Combine the indicator with other tools (e.g., trendlines, moving averages) for a more comprehensive trading strategy.
Notes:
- The indicator works on all timeframes, but the appearance of FVGs and swings will vary depending on the chart's timeframe.
- For best results, use the indicator on a clean chart to avoid visual clutter, especially if you increase the fvgLimit.
- The swing high/low lines are drawn with 50% opacity to ensure they don’t overpower other chart elements, but they are still clearly visible.
Author’s Note:
This script was developed to help traders identify key price levels with ease. I hope it adds value to your trading! If you have any feedback or suggestions for improvement, feel free to leave a comment. Happy trading!

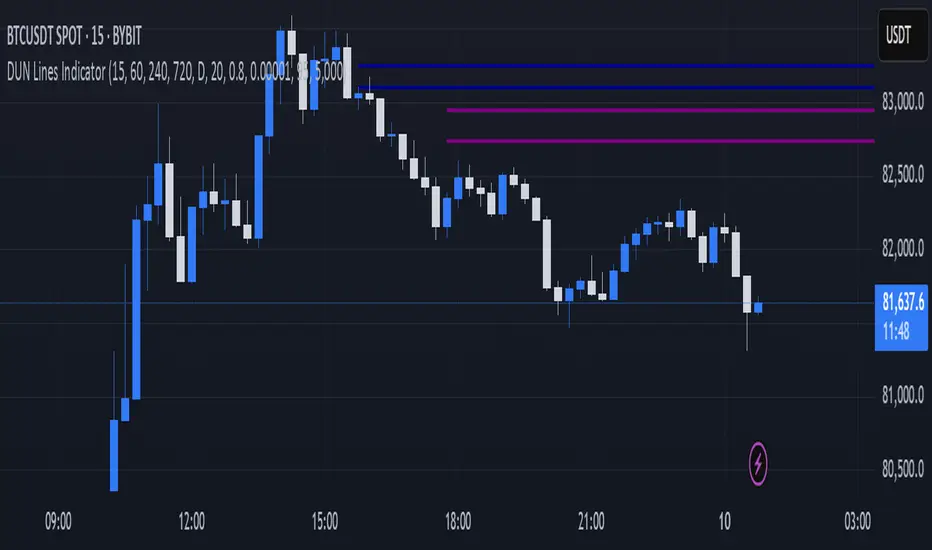
DUN Lines IndicatorThe DUN Lines indicator detects, filters and plots price imbalances (aka fair value gaps or fvgs/ifvgs). It is unique in the fact that it uses five timeframes and filters out overlapping, lower timeframe imbalances and fvgs below a user-definable size threshold.
Simply set your detection timeframes, colors and thresholds then set your chart to your preferred entry timeframe. When imbalances are mitigated, the FVG/IFVG is removed from the chart.
The indicator's default colors are my preferred ones for differentiating between timeframes, but these are easily changed. A single color with various levels of transparency to indicate timeframe strength is another approach that works nicely.
TR FVG Finder 1.0TR FVG Finder 1.0 - Identify High-Probability Trading Zones
Unlock the power of Fair Value Gaps (FVGs) with this advanced TradingView indicator! Designed for traders seeking high-probability setups, the Fair Value Gap Detector identifies key price imbalances on your chart, helping you spot potential reversal and continuation zones with precision.
Key Features:
Accurate FVG Detection: Automatically detects bullish and bearish Fair Value Gaps based on a proven 3-candle pattern, highlighting areas where price is likely to return.
Customizable Display: Shows the most recent 3 FVGs by default (combined bullish and bearish), with an option to adjust the number of FVGs displayed.
Visual Clarity: Draws semi-transparent boxes (green for bullish FVGs, red for bearish FVGs) that extend 15 candles to the right, making it easy to track key levels.
Versatile for All Markets: Works on any timeframe and instrument—perfect for forex, stocks, crypto, and commodities like XAU/USD (gold).
User-Friendly: Simple to use with customizable settings, ideal for both beginner and experienced traders.
How It Works:
The indicator identifies FVGs by analyzing a 3-candle pattern:
- Bullish FVG: When the high of the candle two bars back is below the low of the current candle.
- Bearish FVG: When the low of the candle two bars back is above the high of the current candle. These gaps often act as magnets for price, making them powerful zones for trading strategies like breakouts, pullbacks, or reversals.
Why Use This Indicator?
- Enhance your technical analysis with a proven concept used by institutional traders.
- Spot high-probability trading opportunities with clear visual cues.
- Save time by automating FVG detection—no manual drawing required.
Best Practices:
- Use on lower timeframes (e.g., 15-minute or 1-hour) for more frequent FVGs, especially in volatile markets like forex or crypto.
- Combine with other indicators (e.g., support/resistance, volume) for confirmation.
- Ideal for strategies like ICT (Inner Circle Trader) concepts, Smart Money trading, and price action analysis.
Regards,
Trader Riaz

FVG Detector by SZEMEK>>> DESCRIPTION IN ENGLISH
An advanced indicator for the TradingView platform designed to detect and visualize Fair Value Gaps (FVG) and Inversion Fair Value Gaps (iFVG) on charts.
Main Features:
1. FVG Detection:
- The script identifies both bullish and bearish Fair Value Gaps.
- Users can choose which types of FVG to display (Bullish, Bearish, both, or none).
2. FVG Visualization:
- Gaps are represented as rectangular boxes on the chart.
- The color and transparency of the boxes are configurable separately for bullish and bearish FVG.
- The option to add a frame to FVG boxes with separate color settings.
- FVG labels are available with configurable colors and sizes.
3. Dynamic Tracking of FVG Fill:
- The script monitors the extent to which each gap has been filled by subsequent price movements.
- The fill level is visualized using gray overlay on the original FVG box.
- The percentage fill is updated on the label.
4. Automatic Removal of FVG:
- The ability to set a percentage threshold (100%, 75%, 50%, or no removal) after which FVG is removed from the chart.
5. iFVG Detection:
- The script also identifies Inversion Fair Value Gaps (iFVG), which can be displayed as separate boxes.
- iFVG are available in bullish and bearish versions.
- Users can choose which types of iFVG to display (Bullish, Bearish, both, or none).
- iFVG can also have labels and frames.
6. Limitation of Checked Candles:
- Users can specify the maximum number of candles back that the script will analyze for FVG and iFVG.
- Alerts: The indicator allows setting alerts for detected iFVG, both bullish and bearish.
Advanced Features:
- Accurate calculation of FVG fill percentage, considering both wicks and candle bodies.
- Dynamic updating of FVG boxes and their labels in real-time.
- Flexible memory management through the removal of outdated or filled FVG.
- The ability to customize the appearance of iFVG, including colors, labels, and frames.
This script serves as an advanced tool for technical analysis, enabling traders to identify potential support and resistance areas based on the concept of Fair Value Gaps and their inverted versions.
>>> DESCRIPTION IN ENGLISH
Zaawansowany wskaźnik dla platformy TradingView, który służy do wykrywania i wizualizacji luk wartości godziwej (Fair Value Gaps, FVG) oraz odwróconych luk wartości godziwej (Inversion Fair Value Gaps, iFVG) na wykresie.
Główne cechy
1. Wykrywanie FVG:
- Skrypt identyfikuje zarówno bycze (Bullish), jak i niedźwiedzie (Bearish) luki wartości godziwej.
- Użytkownik może wybrać, które typy FVG mają być wyświetlane (Bullish, Bearish, oba lub żadne).
2. Wizualizacja FVG:
- Luki są przedstawiane jako prostokątne boxy na wykresie.
- Kolor i przezroczystość boxów są konfigurowalne osobno dla FVG byczych i niedźwiedzich.
- Możliwość dodania ramki do boxów FVG z osobnymi ustawieniami kolorów.
- Etykiety FVG są dostępne z konfigurowalnymi kolorami i rozmiarami.
3. Dynamiczne śledzenie wypełnienia FVG:
- Skrypt monitoruje, w jakim stopniu każda luka została wypełniona przez późniejsze ruchy ceny.
- Stopień wypełnienia jest wizualizowany za pomocą szarego koloru nakładanego na oryginalny box FVG.
- Procent wypełnienia jest aktualizowany na etykiecie.
4. Automatyczne usuwanie FVG:
- Możliwość ustawienia progu procentowego (100%, 75%, 50% lub brak usuwania), po którego przekroczeniu FVG jest usuwany z wykresu.
5. Wykrywanie iFVG:
- Skrypt dodatkowo identyfikuje odwrócone luki wartości godziwej (iFVG), które mogą być wyświetlane jako osobne boxy.
- iFVG są dostępne w wersji byczej i niedźwiedziej.
- Użytkownik może wybrać, które typy iFVG mają być wyświetlane (Bullish, Bearish, oba lub żadne).
- iFVG również mogą mieć etykiety i ramki.
6. Ograniczenie sprawdzanych świec:
- Użytkownik może określić maksymalną liczbę świec wstecz, które skrypt będzie analizował w poszukiwaniu FVG i iFVG.
- Alerty: Wskaźnik umożliwia ustawienie alertów dla wykrytych luk iFVG, zarówno bullish, jak i bearish.
Zaawansowane funkcje
- Dokładne obliczanie procentu wypełnienia FVG, uwzględniające zarówno knoty, jak i ciała świec.
- Dynamiczne aktualizowanie boxów FVG i ich etykiet w czasie rzeczywistym.
- Elastyczne zarządzanie pamięcią poprzez usuwanie nieaktualnych lub wypełnionych FVG.
- Możliwość dostosowania wyglądu iFVG, w tym kolorów, etykiet i ramki.
Skrypt ten stanowi zaawansowane narzędzie do analizy technicznej, umożliwiające traderom identyfikację potencjalnych obszarów wsparcia i oporu bazujących na koncepcji luk wartości godziwej i ich odwróconych wersjach.

Fair Value Gap FinderFunctionality
Detection of Fair Value Gaps:
A bullish Fair Value Gap (FVG Up) is identified when the low of two candles before the current bar (low ) is greater than the high of the current bar (high ).
A bearish Fair Value Gap (FVG Down) is identified when the high of two candles before the current bar (high ) is lower than the low of the current bar (low ).
Color Coding:
Bullish Fair Value Gaps are highlighted in green to indicate potential areas of support.
Bearish Fair Value Gaps are highlighted in red to indicate potential areas of resistance.
Visualization Using Rectangles:
If an FVG is detected, the script creates a rectangle spanning a fixed number of bars (right=bar_index+5) to visualize the price inefficiency.
The rectangle extends from the upper to the lower boundary of the gap and has a semi-transparent fill (bgcolor=color.new(color, 90)) for better readability.
Implementation Details
Variable Initialization: The script defines floating-point variables (fvgUpTop, fvgUpBottom, fvgDownTop, fvgDownBottom) to store the price levels of identified gaps.
Conditional Assignments: When an FVG is detected, the corresponding top and bottom boundaries are assigned to the respective variables.
Box Creation: The box.new function is used to draw a rectangle on the chart, marking the FVG zones for better visualization.

POC-Candle-EMA-ATR-LongShadow-50percCandleThis is a script for those who trade based on volume and smart money strategies.
Some of the features of this script:
- Display "Time Price Opportunity Chart". These points help traders to identify price opportunities over time and have a better analysis of the market.
- Mark candles that have traded more volume than previous candles.
- Mark candles whose body is at least and not more than 50% of the total candle size, these candles can be found more easily in smart money strategies.
- Mark spike candles to find FVG faster
- Mark candles that have a shadow of at least more than 380 points and can be good reversal points.
- EMA indicator to check the market trend
- DonchianChannel indicator to check the price trend on the chart
Regards

Nirmal Fair Value GapsICT Fair Value Gaps
Trade Wisely
How a Fair Value Gap Works
Formation:
A Fair Value Gap occurs when a strong price movement (usually from institutional orders) creates an imbalance between buyers and sellers.
This is typically seen in a three-candle pattern, where the middle candle has a large body, and the two surrounding candles have wicks but little overlap with the middle candle’s range.
Identification:
The FVG is marked between the high of the first candle and the low of the third candle (for bullish gaps).
For bearish gaps, it’s the low of the first candle and the high of the third candle.
Market Behavior Around FVG:
Price often retraces into the gap before resuming its original direction.
This happens because the market seeks to "fill" the imbalance where few trades occurred.
Traders use FVGs as potential entry zones for trend continuation trades.
Trading Fair Value Gaps
In an Uptrend:
Look for bullish fair value gaps as potential support zones for buy entries.
Price may dip into the gap and then continue upward.
In a Downtrend:
Look for bearish fair value gaps as potential resistance zones for sell entries.
Price may retrace into the gap and then drop further.
Confluence Factors:
FVGs work best when combined with other strategies like order blocks, liquidity zones, or key Fibonacci levels.

FVG | iSolani
Unveiling Market Inefficiencies with Precision
In fast-moving markets, spotting hidden opportunities often hinges on identifying imbalances between price and value. The FVG | iSolani indicator revolutionises this process by detecting Fair Value Gaps (FVGs) —zones where price action skips over "fair" valuation levels, creating potential retracement targets. Combining advanced filtering, dynamic visualisation, and automated management, this tool empowers traders to pinpoint high-probability setups with unprecedented clarity.
Core Methodology
The indicator employs a multi-layered approach to identify FVGs:
Three-Bar Gap Analysis: Bullish FVGs form when the current low exceeds the high of two bars prior, while bearish FVGs occur when the current high stays below the low of two bars back.
Volatility-Adjusted Filtering: Gaps are measured against a 100-bar standard deviation to exclude insignificant price jumps.
Volume Confirmation: Only gaps accompanied by above-average volume (relative to a 1-bar SMA) are validated, filtering out low-conviction moves.
Auto-Invalidation System: Continuously monitors price action to remove FVG zones once price closes within their range, maintaining chart cleanliness.
Breaking New Ground
This tool introduces three paradigm-shifting innovations:
Volume-Weighted Significance: Unlike traditional FVG detectors, it ties gap validity to volume spikes, emphasising institutional activity.
Adaptive Zone Management: Boxes automatically extend rightward (when enabled) and self-destruct when invalidated, eliminating manual cleanup.
Smart Color Encoding: Offers both monochrome (for multi-timeframe analysis) and standard bull/bear color schemes, with customisable transparency.
Engine Under the Hood
The script operates through four key processes:
Gap Detection: Scans every new bar for three-candle patterns meeting FVG criteria.
Statistical Filtering: Applies user-defined threshold (default: 1σ) to separate meaningful gaps from market noise.
Box Rendering: Draws semi-transparent zones between gap boundaries using TradingView's box objects, styled according to user preferences.
Array-Based Memory: Stores all active FVGs in arrays, enabling real-time validation checks against current price action.
Standard Configuration
Optimised default settings balance visibility and functionality:
Filter: 1.0 (1 standard deviation threshold)
Colors: "Mono" mode (gray boxes) with 90% transparency
Text Labels: Enabled in medium gray
Extension: Gaps extend indefinitely rightward
Borders: Dotted lines with visible outlines
Through its fusion of quantitative rigor and visual adaptability, the FVG | iSolani transforms raw price data into actionable intelligence. By focusing on volume-confirmed gaps and automating zone management, it cuts through market chaos to reveal structurally significant levels—a must-have for traders navigating breakouts, reversals, or order-flow analysis.

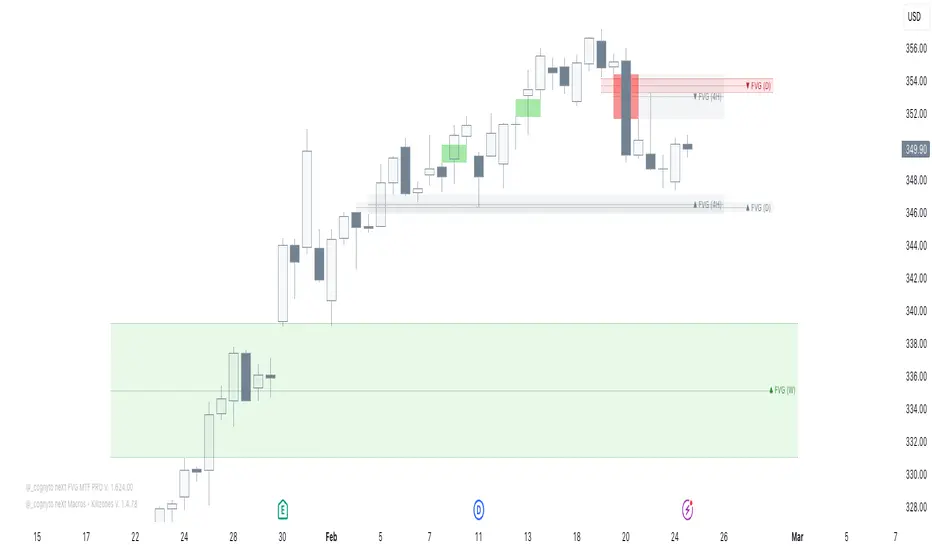
neXt FVG MTF PRO [cognyto]The neXt FVG Multi-Timeframe Indicator represents a remarkable edge in Fair Value Gap analysis. It offers traders a comprehensive and simplified interface to simultaneously monitor Fair Value Gaps across up to 9 different configurable timeframes . This feature shows traders exclusively the closest and most relevant gaps, enabling more precise top-down price action analysis. This makes it particularly valuable for strategies focused on market liquidity and inefficiencies.
Here are the 10 fundamental features that distinguish this indicator
1. Intelligent Visualisation of Next Gaps
An advanced filtering system is implemented to prioritise the visualisation of the nearest FVGs, hence its name -next-, offering a clean FVGs layout on the screen and improving analysis precision. The visualisation system continuously updates according to market price evolution, and as FVGs appear, are mitigated, or eliminated across different timeframes, it updates to ensure a structured and efficient interface.
2. Top-Down Multi-Timeframe Analysis
An efficient visualisation system is implemented to simultaneously manage up to 9 different timeframes. The differentiation between FVGs and their timeframes is established through proportional length in their visual presentation, where higher timeframes extend further to the right, establishing a clear visual hierarchy. The further right the gap extends, the stronger its significance. This structure allows visualization of both current timeframe gaps and those of higher timeframes, facilitating comprehensive market analysis.
3. Alerts
The indicator incorporates a complete notification system that allows users to stay informed in real-time about a wide range of critical events related to Gaps. This system includes customisable alerts for new Fair Value Gaps formation, mitigation notifications, and precise identification of significant gap breakout patterns, technically known as Breakaway gaps.
4. Mitigation
Mitigations represent a fundamental element in technical analysis, identifying zones where price has reached equilibrium. Considering the analytical importance of mitigated gaps, the indicator maintains their visualisation with a specific different color distinction. Additionally, it includes optional functionality for removing mitigated gaps, which can be activated according to user preferences.
5. BISI and SIBI
In addition to the FVGs present in all timeframes, the indicator facilitates precise configuration of BISI and SIBI gaps in the current timeframe, maintaining dynamic visualisation during the additional analysis process alongside other timeframes. This feature optimises the evaluation of historical market imbalances and inefficiencies, offering significant analytical perspectives in the current timeframe, and even refining market entry or exit strategies.
6. Breakaway-Gaps
The indicator provides advanced functionality for identifying and analysing Breakaway-Gaps, presenting in a structured manner the corresponding candle formations that create the Gap. This feature allows precise evaluation of strong market movements, including the assessment of potential retracements and directional patterns in high volatility conditions.
7. Consequent-Encroachment (C.E.)
The indicator implements advanced functionality that visualizes the midpoint of the displacement candle that generates the gap, using precise calculation based on the opening and closing levels of that candle.
8. FVG Fulfilment
The indicator offers advanced configuration options for FVG fullfilmet conditions through two main criteria: confirmation through candle closure that exceeds the established FVG limits, or validation through the intersection of extreme candle levels (maximum/minimum) with the FVG threshold.
9. FVG-Visualisations
Gaps are visualised on the platform once the third candle formation is complete. The system provides optional visualisation functionality during the formation process, although this feature is specifically recommended for predictive analysis, being most effective during daily or weekly market closing intervals. This feature maintains its consistency exclusively in the active timeframe.
10. Customisation
The indicator presents a wide range of advanced customisation options, facilitating comprehensive modification of visual elements. This includes professional adaptation of color palettes, typographic dimensions, line configurations, and design attributes, allowing precise optimisation according to specific user analytical requirements.
This indicator is available exclusively on TradingView. To access it, please see the ‘Author's Instructions’ above and visit our website.
DISCLAIMER
This indicator is provided for informational and educational purposes only. It does not constitute financial advice, trading advice, or any other type of advice, and should not be interpreted as a recommendation to buy, sell, or hold any investment or security of any kind. The information provided by this indicator is not intended as a substitute for professional financial advice. Users of this indicator bear sole responsibility for their trading and investment decisions, including the interpretation of market data and signals generated by this indicator. Past performance is not indicative of future results. Trading financial markets carries substantial risk of loss. Users should conduct their own research, seek professional advice when needed, and exercise due diligence before making any trading or investment decisions.
2:30 [LuciTech]this is a technical analysis tool designed to highlight key price levels and patterns during a specific trading window, based on UK time (Europe/London). It overlays visual elements on the chart, including a 12 PM reference line, Buy Side Liquidity (BSL) and Sell Side Liquidity (SSL) levels, a highlighted 2:30 PM candle, and Engulfing Fair Value Gaps (FVGs). This indicator is intended for traders who focus on intraday price action and liquidity zones.
Features
The 12 PM Line displays a vertical line at 12:00 PM (UK time) to mark the start of the session. It’s customizable, allowing you to enable or disable it and adjust its color.
BSL/SSL Lines track the highest high (BSL) and lowest low (SSL) from 12:00 PM to 2:00 PM (UK time). These lines extend horizontally until 3:30 PM, after which they remain static at their last recorded levels. You can customize them by enabling or disabling visibility, adjusting colors, choosing a line style (solid, dashed, or dotted), and setting the width.
The 2:30 PM Candle highlights the candle at 2:30 PM (UK time) with a distinct color. It’s customizable, with options to enable or disable it and change its color.
Engulfing FVG (Fair Value Gap) identifies bullish and bearish engulfing patterns with a gap from the prior candle’s range. It draws a shaded box over the FVG area, and you can customize it by enabling or disabling it and adjusting the box color.
How It Works
The indicator operates within a session starting at 12:00 PM (UK time). BSL/SSL levels update between 12:00 PM and 2:00 PM, with lines extending until 3:30 PM. After 3:30 PM, these lines freeze.
BSL/SSL lines show the highest price (BSL) and lowest price (SSL) reached during the 12:00 PM to 2:00 PM window. After 3:30 PM, they remain static, marking the final range boundaries.
The 2:30 PM candle emphasizes a key timestamp, often of interest to intraday traders.
Engulfing FVGs detect significant price gaps created by engulfing candles, which may indicate potential reversal or continuation zones.
Settings
12 PM Line Settings let you toggle visibility and set the line color.
BSL/SSL Line Settings allow you to toggle visibility, set BSL and SSL colors, choose a line style (Solid, Dashed, Dotted), and adjust width (1-4).
2:30 Candle Settings let you toggle visibility and set the candle color.
Engulfing FVG Settings allow you to toggle visibility and set the box color.
Interpretation
The 12 PM Line serves as a reference for the session start.
BSL/SSL Lines may act as potential support or resistance zones or highlight liquidity areas. After 3:30 PM, they remain static, showing the session’s final range.
The 2:30 PM Candle can be monitored for price action signals, such as reversals or breakouts.
Engulfing FVGs shaded areas may indicate imbalances in supply and demand, useful for identifying trade opportunities or stop-loss placement.
Notes
The timezone is set to Europe/London (UK time). Ensure your chart’s timezone aligns for accurate results.
This indicator is best used on intraday timeframes, such as 1-minute or 5-minute charts.
It provides visual aids for analysis and does not generate buy or sell signals on its own.

Higher Time Frame Fair Value Gap [ZeroHeroTrading]A fair value gap (FVG) highlights an imbalance area between market participants, and has become popular for technical analysis among price action traders.
A bullish (respectively bearish) fair value gap appears in a triple-candle pattern when there is a large candle whose previous candle’s high (respectively low) and subsequent candle’s low (respectively high) do not fully overlap the large candle. The space between these wicks is known as the fair value gap.
The following script aims at identifying higher timeframe FVG's within a lower timeframe chart. As such, it offers a unique perspective on the formation of FVG's by combining the multiple timeframe data points in the same context.
You can change the indicator settings as you see fit to achieve the best results for your use case.
Features
It draws higher timeframe bullish and bearish FVG's on the chart.
For bullish (respectively bearish) higher timeframe FVG's, it adds the buying (respectively selling) pressure as a percentage ratio of the up (respectively down) volume of the second higher timeframe bar out of the total up (respectively down) volume of the first two higher timeframe bars.
It adds a right extended trendline from the most recent lowest low (respectively highest high) to the top (respectively bottom) of the higher timeframe bullish (respectively bearish) FVG.
It detects and displays higher timeframe FVG's as early as one starts forming.
It detects and displays lower timeframe (i.e. chart's timeframe) FVG's upon confirmation.
It allows for skipping inside first bars when evaluating FVG's.
It allows for dismissing higher timeframe FVG's if there is no update for any period of the chart's timeframe. For instance, this can occur at lower timeframes during low trading activity periods such as extended hours.
Settings
Higher Time Frame FVG dropdown: Selects the higher timeframe to run the FVG detection on. Default is 15 minutes. It must be higher than, and a multiple of, the chart's timeframe.
Higher Time Frame FVG color select: Selects the color of the text to display for higher timeframe FVG's. Default is black.
Show Trend Line checkbox: Turns on/off trendline display. Default is on.
Show Lower Time Frame FVG checkbox: Turns on/off lower timeframe (i.e. chart's timeframe) FVG detection. Default is on.
Show Lower Time Frame FVG color select: Selects the color of the border for lower timeframe (i.e. chart's timeframe) FVG's. Default is white.
Include Inside Bars checkbox: Turns on/off the inclusion of inside first bars when evaluating FVG's. Default is on.
With Consistent Updates checkbox: Turns on/off consistent updates requirement. Default is on.

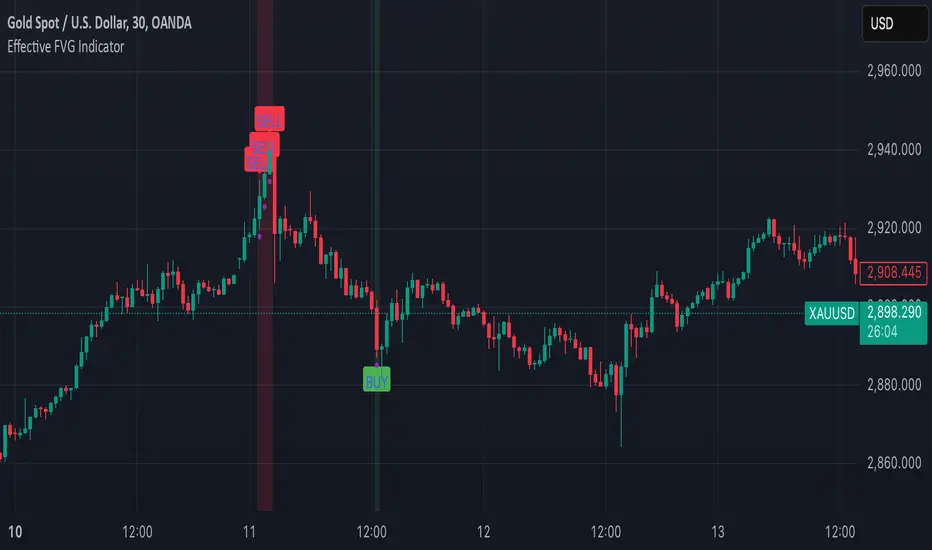
Effective FVG Indicator - ImranDescription:
The Effective FVG Indicator is a technical analysis tool designed to identify Fair Value Gaps (FVGs) in financial markets. FVGs occur when there is a significant gap between the closing price of one session and the opening price of the next session, often indicating a potential reversal point. This indicator uses volume and price movement criteria to confirm and mark these gaps effectively.
Key Features:
Fair Value Gap Detection : Identifies both bullish and bearish FVGs based on significant gaps in price.
Volume Confirmation : Confirms FVGs with high volume, ensuring that the gap is not due to a lack of liquidity.
Price Imbalance : Ensures that the gap is accompanied by a large price movement within the session, indicating strong market sentiment.
Buy/Sell Signals : Marks bullish FVGs with a green "BUY" label below the bar and bearish FVGs with a red "SELL" label above the bar.
Background Highlighting : Highlights the background with a semi-transparent green or red color when a valid FVG is detected, making it easy to spot significant gaps.
Twitter Model ICT [TradingFinder] MMXM ERL D + FVG + M15 MSS/SMT🔵 Introduction
The Twitter Model ICT is a trading approach based on ICT (Inner Circle Trader) models, focusing on price movement between external and internal liquidity in lower timeframes. This model integrates key concepts such as Market Structure Shift (MSS), Smart Money Technique (SMT) divergence, and CISD level break to identify precise entry points in the market.
The primary goal of this model is to determine key liquidity levels, such as the previous day’s high and low (PDH/PDL) and align them with the Fair Value Gap (FVG) in the 1-hour timeframe. The overall strategy involves framing trades around the 1H FVG and using the M15 Market Structure Shift (MSS) for entry confirmation.
The Twitter Model ICT is designed to utilize external liquidity levels, such as PDH/PDL, as key entry zones. The model identifies FVG in the 1-hour timeframe, which acts as a magnet for price movement. Additionally, traders confirm entries using M15 Market Structure Shift (MSS) and SMT divergence.
Bullish Twitter Model :
In a bullish setup, the price sweeps the previous day’s low (PDL), and after confirming reversal signals, buys are executed in internal liquidity zones. Conversely, in a bearish setup, the price sweeps the previous day’s high (PDH), and after confirming weakness signals, sells are executed.
Bearish Twitter Model :
In short setups, entries are only executed above the Midnight Open, while in long setups, entries are taken below the Midnight Open. Adhering to these principles allows traders to define precise entry and exit points and analyze price movement with greater accuracy based on liquidity and market structure.
🔵 How to Use
The Twitter Model ICT is a liquidity-based trading strategy that analyzes price movements relative to the previous day’s high and low (PDH/PDL) and Fair Value Gap (FVG). This model is applicable in both bullish and bearish directions and utilizes the 1-hour (1H) and 15-minute (M15) timeframes for entry confirmation.
The price first sweeps an external liquidity level (PDH or PDL) and then provides an entry opportunity based on Market Structure Shift (MSS) and SMT divergence. Additionally, the entry should be positioned relative to the Midnight Open, meaning long entries should occur below the Midnight Open and short entries above it.
🟣 Bullish Twitter Model
In a bullish setup, the price first sweeps the previous day’s low (PDL) and reaches an external liquidity level. Then, in the 1-hour timeframe (1H), a bullish Fair Value Gap (FVG) forms, which serves as the price target.
To confirm the entry, a Market Structure Shift (MSS) in the 15-minute timeframe (M15) should be observed, signaling a trend reversal to the upside. Additionally, SMT divergence with correlated assets can indicate weakness in selling pressure.
Under these conditions, a long position is taken below the Midnight Open, with a stop-loss placed at the lowest point of the recent bearish move. The price target for this trade is the FVG in the 1-hour timeframe.
🟣 Bearish Twitter Model
In a bearish setup, the price first sweeps the previous day’s high (PDH) and reaches an external liquidity level. Then, in the 1-hour timeframe (1H), a bearish Fair Value Gap (FVG) is identified, serving as the trade target.
To confirm entry, a Market Structure Shift (MSS) in the 15-minute timeframe (M15) should form, signaling a trend shift to the downside. If an SMT divergence is present, it can provide additional confirmation for the trade.
Once these conditions are met, a short position is taken above the Midnight Open, with a stop-loss placed at the highest level of the recent bullish move. The trade's price target is the FVG in the 1-hour timeframe.
🔵 Settings
Bar Back Check : Determining the return of candles to identify the CISD level.
CISD Level Validity : CISD level validity period based on the number of candles.
Daily Position : Determines whether only the first signal of the day is considered or if signals are evaluated throughout the entire day.
Session : Specifies in which trading sessions the indicator will be active.
Second Symbol : This setting allows you to select another asset for comparison with the primary asset. By default, "XAUUSD" (Gold) is set as the second symbol, but you can change it to any currency pair, stock, or cryptocurrency. For example, you can choose currency pairs like EUR/USD or GBP/USD to identify divergences between these two assets.
Divergence Fractal Periods : This parameter defines the number of past candles to consider when identifying divergences. The default value is 2, but you can change it to suit your preferences. This setting allows you to detect divergences more accurately by selecting a greater number of candles.
The indicator allows displaying sessions based on various time zones. The user can select one of the following options :
UTC (Coordinated Universal Time)
Local Time of the Session
User’s Local Time
Show Open Price : Displays the New York market opening price.
Show PDH / PDL : Displays the previous day’s high and low to identify potential entry points.
Show SMT Divergence : Displays lines and labels for bullish ("+SMT") and bearish ("-SMT") divergences.
🔵 Conclusion
The Twitter Model ICT is an effective approach for analyzing and executing trades in financial markets, utilizing a combination of liquidity principles, market structure, and SMT confirmations to identify optimal entry and exit points.
By analyzing the previous day’s high and low (PDH/PDL), Fair Value Gaps (FVG), and Market Structure Shift (MSS) in the 1H and M15 timeframes, traders can pinpoint liquidity-driven trade opportunities. Additionally, considering the Midnight Open level helps traders avoid random entries and ensures better trade placement.
By applying this model, traders can interpret market movements based on liquidity flow and structural changes, allowing them to fine-tune their trading decisions with higher precision. Ultimately, the Twitter Model ICT provides a structured and logical approach for traders who seek to trade based on liquidity behavior and trend shifts in the market.

2022 Model ICT Entry Strategy [TradingFinder] One Setup For Life🔵 Introduction
The ICT 2022 model, introduced by Michael Huddleston, is an advanced trading strategy rooted in liquidity and price imbalance, where time and price serve as the core elements. This ICT 2022 trading strategy is an algorithmic approach designed to analyze liquidity and imbalances in the market. It incorporates concepts such as Fair Value Gap (FVG), Liquidity Sweep, and Market Structure Shift (MSS) to help traders identify liquidity movements and structural changes in the market, enabling them to determine optimal entry and exit points for their trades.
This Full ICT Day Trading Model empowers traders to pinpoint the Previous Day High/Low as well as the highs and lows of critical sessions like the London and New York sessions. These levels act as Liquidity Zones, which are frequently swept prior to a market structure shift (MSS) or a retracement to areas such as Optimal Trade Entry (OTE).
Bullish :
Bearish :
🔵 How to Use
The ICT 2022 model is a sophisticated trading strategy that focuses on identifying key liquidity levels and price movements. It operates based on two main principles. In the first phase, the price approaches liquidity zones and sweeps critical levels such as the previous day’s high or low and key session levels.
This movement is known as a Liquidity Sweep. In the second phase, following the sweep, the price retraces to areas like the FVG (Fair Value Gap), creating ideal entry points for trades. Below is a detailed explanation of how to apply this strategy in bullish and bearish setups.
🟣 Bullish ICT 2022 Model Setup
To use the ICT 2022 model in a bullish setup, start by identifying the Previous Day High/Low or key session levels, such as those of the London or New York sessions. In a bullish setup, the price usually moves downward first, sweeping the Liquidity Low. This move, known as a Liquidity Sweep, reflects the collection of buy orders by major market participants.
After the liquidity sweep, the price should shift market structure and start moving upward; this shift, referred to as Market Structure Shift (MSS), signals the beginning of an upward trend. Following MSS, areas like FVG, located within the Discount Zone, are identified. At this stage, the trader waits for the price to retrace to these zones. Once the price returns, a long trade is executed.
Finally, the stop-loss should be set below the liquidity low to manage risk, while the take-profit target is usually placed above the previous day’s high or other identified liquidity levels. This structure enables traders to take advantage of the upward price movement after the liquidity sweep.
🟣 Bearish ICT 2022 Model Setup
To identify a bearish setup in the ICT 2022 model, begin by marking the Previous Day High/Low or key session levels, such as the London or New York sessions. In this scenario, the price typically moves upward first, sweeping the Liquidity High. This move, known as a Liquidity Sweep, signifies the collection of sell orders by key market players.
After the liquidity sweep, the price should shift market structure downward. This movement, called the Market Structure Shift (MSS), indicates the start of a downtrend. Following MSS, areas such as FVG, found within the Premium Zone, are identified. At this stage, the trader waits for the price to retrace to these areas. Once the price revisits these zones, a short trade is executed.
In this setup, the stop-loss should be placed above the liquidity high to control risk, while the take-profit target is typically set below the previous day’s low or another defined liquidity level. This approach allows traders to capitalize on the downward price movement following the liquidity sweep.
🔵 Settings
Swing period : You can set the swing detection period.
Max Swing Back Method : It is in two modes "All" and "Custom". If it is in "All" mode, it will check all swings, and if it is in "Custom" mode, it will check the swings to the extent you determine.
Max Swing Back : You can set the number of swings that will go back for checking.
FVG Length : Default is 120 Bar.
MSS Length : Default is 80 Bar.
FVG Filter : This refines the number of identified FVG areas based on a specified algorithm to focus on higher quality signals and reduce noise.
Types of FVG filters :
Very Aggressive Filter: Adds a condition where, for an upward FVG, the last candle's highest price must exceed the middle candle's highest price, and for a downward FVG, the last candle's lowest price must be lower than the middle candle's lowest price. This minimally filters out FVGs.
Aggressive Filter: Builds on the Very Aggressive mode by ensuring the middle candle is not too small, filtering out more FVGs.
Defensive Filter: Adds criteria regarding the size and structure of the middle candle, requiring it to have a substantial body and specific polarity conditions, filtering out a significant number of FVGs.
Very Defensive Filter: Further refines filtering by ensuring the first and third candles are not small-bodied doji candles, retaining only the highest quality signals.
🔵 Conclusion
The ICT 2022 model is a comprehensive and advanced trading strategy designed around key concepts such as liquidity, price imbalance, and market structure shifts (MSS). By focusing on the sweep of critical levels such as the previous day’s high/low and important trading sessions like London and New York, this strategy enables traders to predict market movements with greater precision.
The use of tools like FVG in this model helps traders fine-tune their entry and exit points and take advantage of bullish and bearish trends after liquidity sweeps. Moreover, combining this strategy with precise timing during key trading sessions allows traders to minimize risk and maximize returns.
In conclusion, the ICT 2022 model emphasizes the importance of time and liquidity, making it a powerful tool for both professional and novice traders. By applying the principles of this model, you can make more informed trading decisions and seize opportunities in financial markets more effectively.

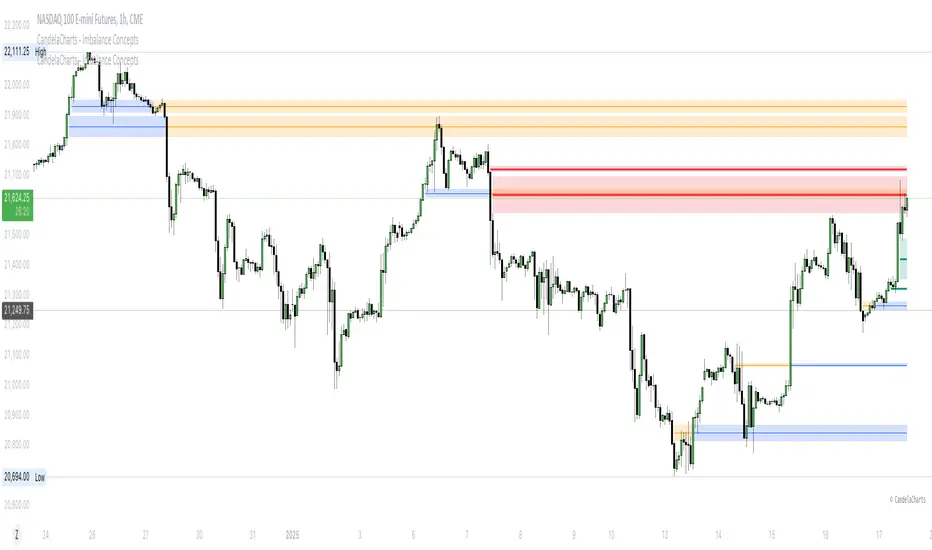
CandelaCharts - Imbalance Concepts 📝 Overview
Imbalance Concepts is an advanced toolkit rooted in ICT (Inner Circle Trader) principles, specifically designed to identify and highlight critical areas of support and resistance within financial markets. This toolkit focuses on detecting market imbalances that can indicate potential turning points or high-probability zones for price action.
The key components of the toolkit include:
Fair Value Gaps (FVG)
Inversion Fair Value Gaps (IFVG)
Balanced Price Range (BPR)
Volume Imbalances (VI)
Opening Gaps (OG)
The toolkit automatically detects these imbalances and visually marks them on charts, allowing traders to quickly identify key zones for analysis. This enables more informed decision-making, as these imbalances often signal the potential for major market shifts, reversals, or continuation patterns.
By integrating Imbalance Concepts, traders can focus on critical price areas that have a high likelihood of influencing future price action.
📦 Features
The Imbalance Concepts toolkit provides a robust set of features aimed at improving trading accuracy and decision-making. Key features include:
MTF
Mitigation
Consequent Encroachment
Threshold
Hide Overlap
Advanced Styling
⚙️ Settings
Show: Controls whether Imbalances are displayed on the chart.
Show Last: Sets the number of Imbalances you want to display.
Length: Determines the length of each Imbalance.
Mitigation: Highlights when an Imbalance has been touched, using a different color without marking it as invalid.
Timeframe: Specifies the timeframe used to detect Imbalances.
Threshold: Sets the minimum gap size required for Imbalance detection on the chart.
Show Mid-Line: Configures the midpoint line's width and style within the Imbalance. (Consequent Encroachment - CE)
Show Border: Defines the border width and line style of the Imbalance.
Hide Overlap: Removes overlapping Imbalances from view.
Extend: Extends the Imbalance length to the current candle.
Elongate: Fully extend the Imbalance length to the right side of the chart.
⚡️ Showcase
Fair Value Gaps (FVG)
Inversion Fair Value Gaps (IFVG)
Balanced Price Range (BPR)
Volume Imbalances (VI)
Opening Gaps (OG)
📒 Usage
The key components of trading imbalances include:
Step 1 – Identify Market Trend: Begin by determining the market trend for the asset, whether it is bullish or bearish.
Step 2 – Locate Premium and Discount Zones: In a bearish market, focus on identifying the premium Imbalance, while in a bullish market, look for the discount Imbalance.
Step 3 – Detect Liquidity Sweep: After identifying the trend, the next step is to spot a liquidity sweep, which often indicates a potential price reversal or continuation.
Step 4 – Detect Change In State of Delivery: Following the liquidity sweep, the next step is to recognize a CISD, which frequently serves as a confirmation of a potential price reversal.
Step 5 – Execute the Trade: In a bullish market, wait for the price to retrace and test the discount imbalance, aiming to balance the price movement before entering the trade.
NOTES:
You always short only on Premium, and long on Discount.
Fair Value Gaps (FVG)
Inversion Fair Value Gaps
Balanced Price Range
🚨 Alerts
The indicator provides the ability to set alerts for various significant market events related to its core features.
You can configure alerts for the following key events:
Fair Value Gaps Formation (+B/-B)
Inversion Fair Value Gaps Formation (+B/-B)
Balanced Price Range Formation (+B/-B)
Volume Imbalances Formation (+B/-B)
Opening Gaps Formation (+B/-B)
⚠️ Disclaimer
These tools are exclusively available on the TradingView platform.
Our charting tools are intended solely for informational and educational purposes and should not be regarded as financial, investment, or trading advice. They are not designed to predict market movements or offer specific recommendations. Users should be aware that past performance is not indicative of future results and should not rely on these tools for financial decisions. By using these charting tools, the purchaser agrees that the seller and creator hold no responsibility for any decisions made based on information provided by the tools. The purchaser assumes full responsibility and liability for any actions taken and their consequences, including potential financial losses or investment outcomes that may result from the use of these products.
By purchasing, the customer acknowledges and accepts that neither the seller nor the creator is liable for any undesired outcomes stemming from the development, sale, or use of these products. Additionally, the purchaser agrees to indemnify the seller from any liability. If invited through the Friends and Family Program, the purchaser understands that any provided discount code applies only to the initial purchase of Candela's subscription. The purchaser is responsible for canceling or requesting cancellation of their subscription if they choose not to continue at the full retail price. In the event the purchaser no longer wishes to use the products, they must unsubscribe from the membership service, if applicable.
We do not offer reimbursements, refunds, or chargebacks. Once these Terms are accepted at the time of purchase, no reimbursements, refunds, or chargebacks will be issued under any circumstances.
By continuing to use these charting tools, the user confirms their understanding and acceptance of these Terms as outlined in this disclaimer.