Auto Harmonic Pattern Recognition [UAlgo]Auto Harmonic Pattern Recognition is an overlay indicator that automatically scans price action for classical harmonic structures using a ZigZag style pivot engine. It continuously builds swing points, validates Fibonacci relationships across the last five pivots, and prints a confirmed pattern as soon as a valid X A B C D sequence is detected.
The script is engineered for practical chart use. It prioritizes clear geometry, a visible Potential Reversal Zone around point D, and an RR focused projection set that includes stop placement and multiple take profit levels. A compact dashboard also tracks how many patterns have been confirmed during the session, helping you understand how active the market has been for harmonic setups.
This tool is best used as a structure and planning layer. It provides harmonic recognition and a consistent measurement framework so you can focus on confirmation, execution timing, and risk management.
Features
1) Pivot Engine With Depth Control
The foundation of detection is a pivot system that identifies local swing highs and lows using a user defined Pivot Depth. Depth controls how strict the swing points are. Lower values react faster and produce more pivots. Higher values react slower and produce cleaner swings.
The engine maintains an internal pivot list, updates the last pivot when a more extreme value appears in the same direction, and keeps the stored history lightweight by limiting the array size.
2) Fully Automated Harmonic Recognition
Once at least five pivots exist, the script evaluates the most recent X A B C D sequence and checks it against multiple harmonic templates. The current build includes:
Gartley
Bat
Butterfly
Crab
Deep Crab
Cypher
Shark
5 0
Nen Star
Leonardo
Bullish and bearish variants are supported. The direction is decided by the high low sequence of X A B C D, so the same ratio logic can be applied to either side of the market.
3) Ratio Tolerance Control
Harmonics require ratios to land within acceptable bounds rather than exact values. Ratio Tolerance allows you to define how strict the matching is. A tighter tolerance reduces pattern count and increases selectivity. A wider tolerance increases pattern frequency and is more permissive.
The tolerance rule is applied as a symmetric band around target ratios where appropriate.
4) Elite Visualization Suite
The renderer draws a premium style structure that emphasizes readability:
Neon geometry lines connecting X A B C D
Soft internal fills to visually frame the legs
A PRZ glow zone around point D to highlight the decision area
Optional live ratio tags placed near relevant legs
A pattern label at point D with bull or bear styling
You can toggle PRZ, ratios, glow geometry, and the stats panel independently.
5) RR Focused Trade Projection
When a pattern prints, the script projects a complete planning scaffold:
A tight stop level placed slightly beyond the extreme point
Three take profit levels derived from AD expansion factors
Live RR values for each take profit based on the computed risk distance
This approach standardizes structure based exits and allows you to compare opportunities objectively across symbols and timeframes.
6) Performance Dashboard
A compact table panel can be displayed on the chart. It shows system status and the total number of patterns detected. This is useful for quickly verifying the script is active and for tracking how often the engine has confirmed structures in the current run.
Calculations
1) Pivot Detection Using Depth Window
A pivot is confirmed when the candle at index is the highest high or lowest low within a symmetric window:
Window size equals depth times 2 plus 1
float h = ta.highest(high, zz_depth * 2 + 1)
float l = ta.lowest(low, zz_depth * 2 + 1)
bool is_h = high == h
bool is_l = low == l
If a pivot is found, the engine pushes a new Pivot object containing bar index, price, and direction. If the direction has not changed, it upgrades the last pivot when a more extreme price appears.
2) X A B C D Selection
Detection always uses the most recent five pivots:
D is the latest pivot
C is the pivot before D
B is the pivot before C
A is the pivot before B
X is the pivot before A
Pivot d = zz_points.get(sz - 1)
Pivot c = zz_points.get(sz - 2)
Pivot b = zz_points.get(sz - 3)
Pivot a = zz_points.get(sz - 4)
Pivot x = zz_points.get(sz - 5)
3) Leg Length Measurements
All harmonic ratios are derived from absolute swing distances:
XA is distance from X to A
AB is distance from A to B
BC is distance from B to C
CD is distance from C to D
XD is distance from X to D
AC is distance from A to C
float xa = math.abs(a.price - x.price)
float ab = math.abs(b.price - a.price)
float bc = math.abs(c.price - b.price)
float cd = math.abs(d.price - c.price)
float xd = math.abs(d.price - x.price)
float ac = math.abs(c.price - a.price)
4) Ratio Set Computation
The script computes key ratios used by harmonic templates. Divisions are protected so a zero leg does not break the logic.
r_xb measures AB relative to XA
r_ac measures BC relative to AB
r_bd measures CD relative to BC
r_xd measures XD relative to XA
r_xa_c measures AC relative to XA
float r_xb = ab / (xa == 0 ? 1 : xa)
float r_ac = bc / (ab == 0 ? 1 : ab)
float r_bd = cd / (bc == 0 ? 1 : bc)
float r_xd = xd / (xa == 0 ? 1 : xa)
float r_xa_c = ac / (xa == 0 ? 1 : xa)
5) Bull and Bear Structure Validation
Before applying template ratios, the script verifies the pivot sequence forms a valid alternating swing structure.
Bullish sequence requires:
X low, A high, B low, C high, D low
Bearish sequence requires:
X high, A low, B high, C low, D high
bool is_bull = not x.is_high and a.is_high and not b.is_high and c.is_high and not d.is_high
bool is_bear = x.is_high and not a.is_high and b.is_high and not c.is_high and d.is_high
6) Tolerance Based Ratio Check
For ratios with a target value, the script uses a tolerance band:
actual must be within target times 1 minus tol and target times 1 plus tol
method check(float actual, float target, float tol) =>
actual >= target * (1 - tol) and actual <= target * (1 + tol)
7) Template Matching Logic
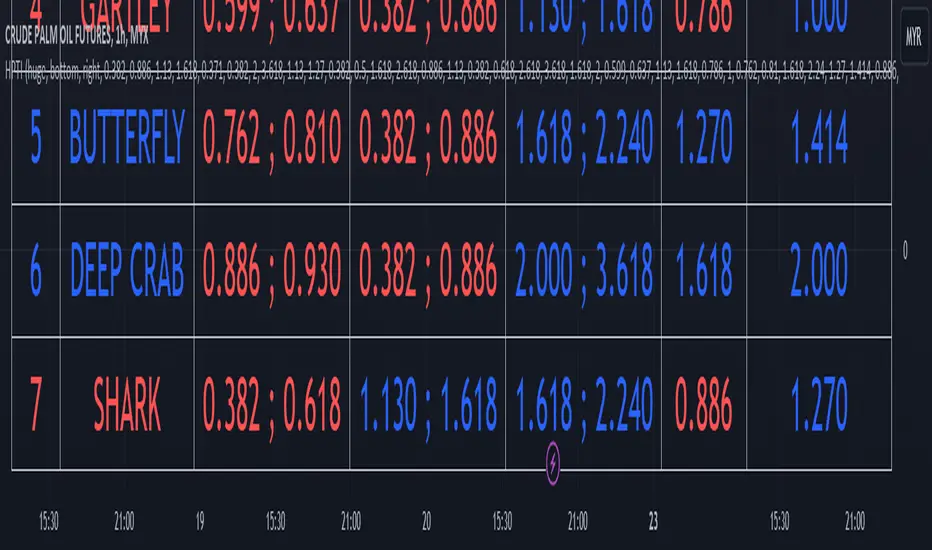
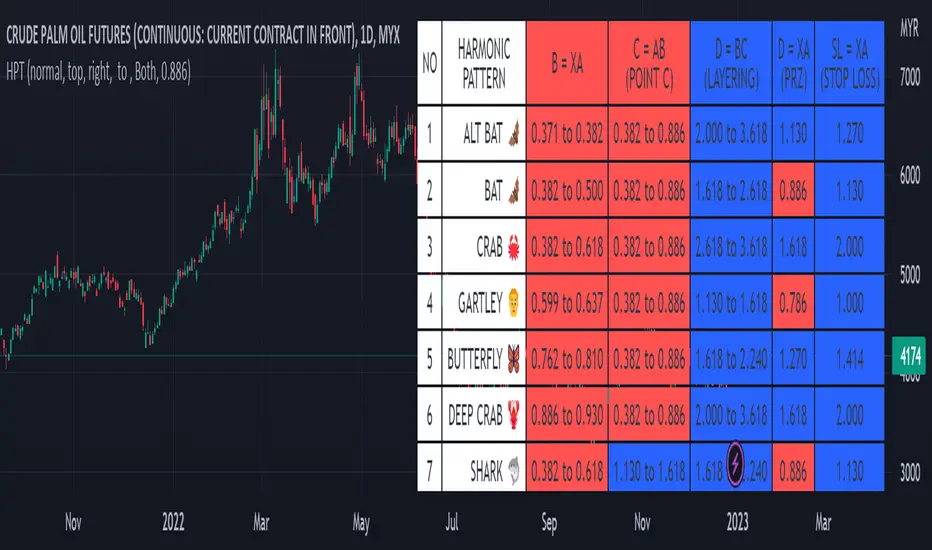
After structure is confirmed, the script assigns a pattern name when the ratio set fits known templates. Examples:
Gartley uses r_xb near 0.618 and r_xd near 0.786
Bat uses r_xb between 0.382 and 0.5 and r_xd near 0.886
Butterfly uses r_xb near 0.786 and r_xd between 1.27 and 1.618
Crab uses r_xb between 0.382 and 0.618 and r_xd near 1.618
Deep Crab uses r_xb near 0.886 and r_xd near 1.618
Additional templates are evaluated with their own ratio windows, including Cypher, Shark, 5 0, Nen Star, and Leonardo.
8) PRZ Glow Zone Construction
PRZ is rendered as a small box centered around point D. Its size is a percentage of the X to A amplitude, which scales the zone to market volatility:
float prz_size = math.abs(h_p.x.price - h_p.a.price) * 0.05
float prz_h = h_p.d.price + prz_size
float prz_l = h_p.d.price - prz_size
This creates a consistent glow zone width that adapts to the pattern’s overall magnitude.
9) RR Focused Stop and Take Profit Projection
The script calculates AD length and XA length to derive risk and targets.
Stop is placed beyond the extreme point by a small fraction of XA:
Extreme is min of X and D for bullish structures
Extreme is max of X and D for bearish structures
Stop offset equals XA length times 0.02
float ad_len = math.abs(h_p.a.price - h_p.d.price)
float xa_len = math.abs(h_p.a.price - h_p.x.price)
float extreme = h_p.bull ? math.min(h_p.x.price, h_p.d.price) : math.max(h_p.x.price, h_p.d.price)
float sl = h_p.bull ? extreme - (xa_len * 0.02) : extreme + (xa_len * 0.02)
float risk = math.max(math.abs(h_p.d.price - sl), syminfo.mintick)
Targets are projected from point D using AD expansion factors:
0.786
1.272
1.618
float tp1 = h_p.bull ? h_p.d.price + (ad_len * 0.786) : h_p.d.price - (ad_len * 0.786)
float tp2 = h_p.bull ? h_p.d.price + (ad_len * 1.272) : h_p.d.price - (ad_len * 1.272)
float tp3 = h_p.bull ? h_p.d.price + (ad_len * 1.618) : h_p.d.price - (ad_len * 1.618)
RR values are computed as reward divided by risk for each target:
float rr1 = math.abs(tp1 - h_p.d.price) / risk
float rr2 = math.abs(tp2 - h_p.d.price) / risk
float rr3 = math.abs(tp3 - h_p.d.price) / risk
10) Duplicate Print Prevention and Alerts
To prevent repeated drawings on the same D pivot, the script tracks the last D index and only renders when a new D is confirmed. When a new pattern prints, an alert is fired once per bar.
11) Analytics Panel Update
When enabled and on the last bar, the table updates with status and the total pattern count. This keeps the UI lightweight and avoids unnecessary per bar table writes.
Pine Script® インジケーター