FX Mini-Day/Index Dividers V2This is a combination of the Mini-Day Separator Indicator, timings based off the research by Tom Henstridge/@LiquiditySniper and additional Index KZ delineations, based on ICT's 2022 Youtube Mentorship.
*It borrows some minor code from Enricoamato997 . Credit where it is due!
This is a joint effort by myself, @vbwilkes / Offseason Vince and @Tom_FOREX / TraderTom on the Index/Index Future portion.
Index Future Example
Forex Example
Index

TPTR_Dynamic_Ratio_CorrelatorThe script provides a way to compute ratio between two indexes (or stocks) of your choice, and paints a "up-arrow" below the first candle where and when the value of the ratio exceeds your threshold of choice.
It also creates a table summarizing the value of your securities, and the value of the ratio below.
The script will also alert you with a message (automatically) when the ratio of your security_1 and security_2 exceeds the ratio.

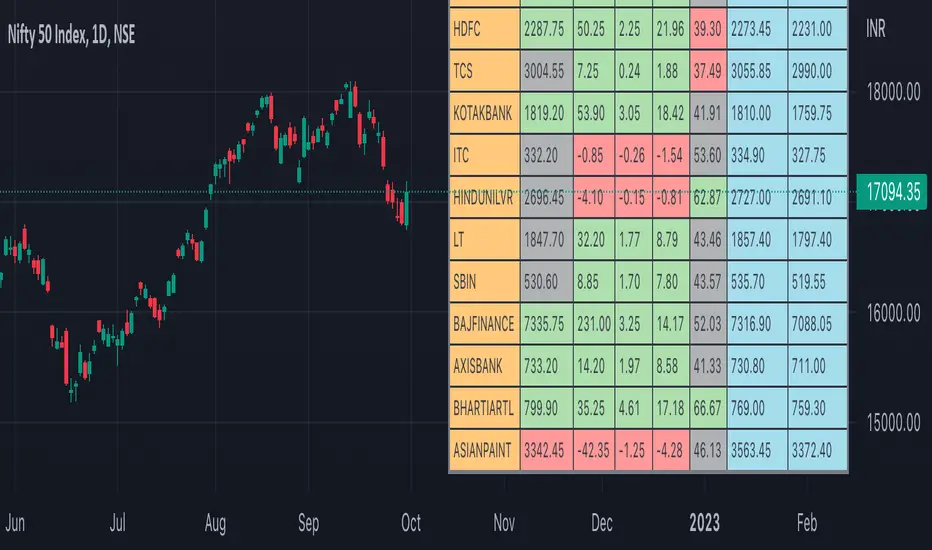
Nifty50 Participants - Top 25Nifty50 Index is calculated based on the movements of its participants. Every time you think of why is Index going up/down, who is actively dragging the index either ways, this Indicator gives you answer for the same in realtime!
This indicator will help you in pre-planning your trades based on the movements shown by different stocks of various sectors in Index calculation.
RSI column is an add-on to the participation table which will help you in getting RSI values of different stocks of Nifty 50 at a glance. You will see values getting updated in realtime in live market.
Checkout for customisations in indicator settings.
Note:
1. Participants present in this indicator and their participation percentage is taken from the official NSE website.
2. Table shows Top 25 participants by default. If you want to see less than 25 rows, you can update the input via indicator settings.
Feel free to contribute/comment changes if any! Comment in case of any suggestions :)
- Published by Soham Dixit
Fear and Greed Index CandlesticksThis colours the candlesticks based on my 'Fear and Greed Index'.
All calculations are explained in the code.
The index is mainly based upon the components of the popular fear and greed index website. I've annotated the components in the code for you to look at.
If you're interested, you can replace the final variable 'Total' (within the 'barcolor' function at the very end) with any of the final outputs of the subcomponents to see the results of that single part.
Red = Greed
Green = Fear
Enjoy!

VolatilityDivergenceRedGreen by STTAName: VolatilityDivergenceRedGreen by STTA
- Underlying and implied volatiliy normally show negative correlated behavior (price rises, vola falls and vice versa)
- This study shows symbols in on candles in chart where Undelying and corresponding vola index show same bahvior for 1,2 or 3 consecutive bars. (price rises and vola rises and vice versa)
- This situation is called Vola Divergence. Red, when prices and vola fall; green, when price and vola rise
- This information can be used to detect possible end of Up/Down-Swings.
- User can configure if rising or falling or both price movements shall be displayed.
- This study can be used with root symbols, which provide corresponding volatility indices.
- supported Root Symbols: SPX, NDQ, DJI, RUT, CL, XLE, GC, SI, EUR, HSI, FXI, EWZ, AMZN, AAPL, GS, GOOG, IBM, DEU40
- in all other symbols, no symbols are displayed.
Inputs
- underlying displayed in chart
Settings/Parameter
- each Divergence can be switched off/on separately
- output of each displayed symbol can be configured
Outputs
- RedDiv1: first bar with rising price and rising volatility index
- GreenDiv1: first bar with falling price and falling volatility index
- RedDiv2: second bar in a row with rising price and rising volatility index
- GreenDiv2: second bar with falling price and falling volatility index
- RedDiv3: third bar in a row with rising price and rising volatility index
- GreenDiv3: third bar in a row with falling price and falling volatility index

RSI Levels, Multi-TimeframeThe relative strength index (RSI) is a momentum indicator that measures the magnitude of recent price changes to evaluate overbought or oversold conditions. RSI is normally displayed as an oscillator separately from price and can have a reading from 0 to 100. This indicator takes the RSI and plots the 30 & 70 levels onto the price chart so you can see when price is going to meet the 30 or 70 levels. The reason the 30 & 70 levels are important is because many traders (and bots) use those as signals to buy (at 30 RSI) or sell (at 70 RSI). Additionally, this indicator allows you to display not just the RSI levels of your currently viewed timeframe on the chart, but also shows the RSI levels of up to 6 different timeframes on the same chart. This allows you to quickly see if multiple RSI levels are aligning across different timelines, which is an even stronger indication that price is going to change direction when it meets those levels on the chart. There are a lot of nice configuration options, like:
Style customization (color, thickness, size)
Labels on the chart so you can tell which plots are the RSI levels
Optionally display the plot as a horizontal line if all you care about is the RSI level right now
Toggle overbought (RSI 70) or oversold (RSI 30) on/off completely

Bank Nifty ParticipantsBankNifty Index is calculated based on the movements of its participants. Every time you think of why is Index going up/down, who is actively dragging the index either ways, this Indicator gives you the answer for the same in realtime!
For example : You see HDFCBank and Kotak Bank significantly up while all other banks going down but index reacting in a bullish mode, the answer lies in which Bank is contributing how much to the index! This will help you in pre-planning your trades based on the movements shown by different banks in Index calculation. Or on the other hand, you see HDFCBank on verge of breakout and you have target of 10 points, this indicator will help you in identifying how much the index will react to the 10 points movement shown by HDFC Bank which is the leading participant in Bank Nifty.
RSI column is an add-on to the participation table which will help you in getting RSI values of different banks at a glance. You will see values getting updated in realtime in live market. Checkout for customisations in indicator settings.
Note : Participants present in this indicator and their participation percentage is taken from the official NSE website.
Feel free to contribute/comment changes if any!
- Published by Soham Dixit

Fibonaci Opening Range Candle
Fibonacci Opening Range it is 50% and 0.61% of 5 min or 30min or 1 hour opening candle
search buying opportunities below 0.61
and selling opportunities above 0.50
Also acts as good support and resistance in intraday
BEST RESULTS IN INDEXES
Thanks & Best Regards
Marella Ganesh

cowen risk indexThis is my attempt at remaking the cowen risk index. It's definitely not correct, but should give a rough estimate of where his indicator is at. I am taking the price divided by the 400sma to get an oscillator, then we need to account for diminishing returns so I just made an exponentially increasing variable and mutliplying that by the oscillator value. Then I normalized the data as best as I could. Not sure exactly how to do that so if anyone has any suggestions, please let me know.
This only works on the daily and weekly timeframe. You will need to edit the code if you want to have it work for other timeframes.

Relative Strength ComparisonThis script plots the ratio between a ticker and the selected index. Currently, I have US equities indexes listed + BTC. It's a great way to check for relative strength, determine if absolute highs relative to the ratio are being made, etc.
Additionally, optional comparison of the RSI is included. I was just testing something out but figured I'd leave in here because why not. If you use this, enable the 1.0 line.
Script is a bit slow, will try to optimize eventually.

AP Index - Geomagnetic disturbancesDaily AP index back to 2015-01-01.
Geomagnetic disturbances can be monitored by ground-based magnetic observatories recording the three magnetic field components. The global Kp index is obtained as the mean value of the disturbance levels in the two horizontal field components, observed at 13 selected, subauroral stations . The name Kp originates from "planetarische Kennziffer" ( = planetary index).
The three-hour index ap and the daily indices Ap, Cp and C9 are directly related to the Kp index. In order to obtain a linear scale from Kp, J. Bartels gave the following table to derive a three-hour equivalent range, named ap index.
Geomagnetic Ap Index: The daily index Ap is obtained by averaging the eight values of ap for each day.
Based on the data from Helmholtz Centre Potsdam GFZ German Research Centre for Geosciences.

Ehlers Relative Vigor Index [CC]The Relative Vigor Index was created by John Ehlers (Cybernetic Analysis For Stocks And Futures pg 58) and this is a momentum indicator that is similar to the Accumulation Distribution Oscillator created by Jim Waters and Larry Williams. He uses digital signal processing to smooth the indicator to provide clear buy and sell signals. The idea behind this indicator is that during uptrends, prices tend to close near the high and during downtrends, prices tend to close near the low. I have included strong buy and sell signals in addition to normal ones so strong signals are darker in color and normal ones are lighter in color. Buy when the line turns green and sell when it turns red. Usually the best signals I have found for this indicator is when the indicator is below the 0 line and turns green then it is usually a sign of a strong uptrend.
Let me know if there are any other scripts you would like to see me publish!

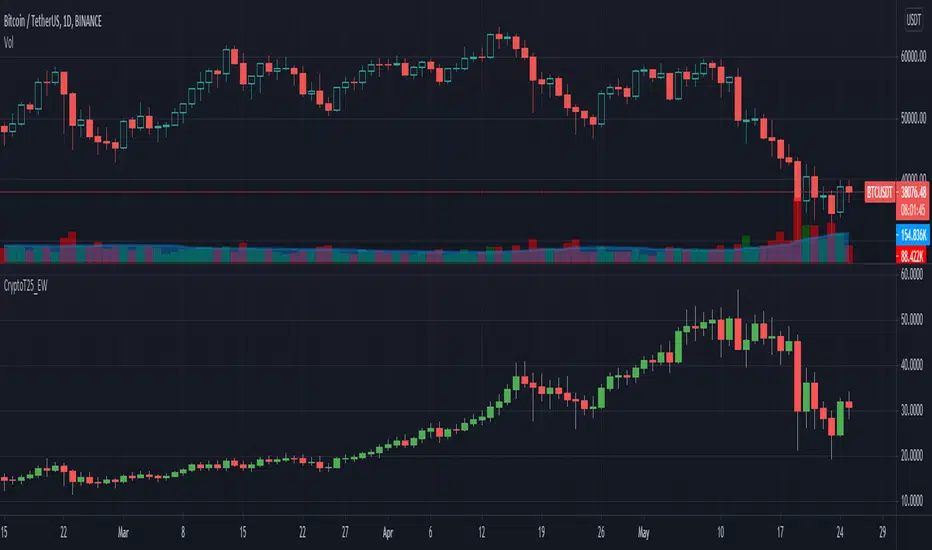
Crypto Top 25 Equal Weight IndexDraws an Equally Weighted Index of 25 securities. The inputs are pre-populated with the Top 25 cryptocurrencies by market cap at the time of publishing the script, but any 25 securities can be used.
Double click on this indicator's pane to view in full screen.
Note: Candle open is always equal to previous candle's close. I did this to avoid problems where sometimes candle open didn't make sense compared to close.
If you're into cryptocurrencies also have a look at these TradingView charts CRYPTOCAP:TOTAL, CRYPTOCAP:TOTAL2 and CRYPTOCAP:OTHERS.
Full CRYPTO pack macd, rsi, obv, ema alert versionThis is the indicator version of a simple, yet very efficient crypto strategy, adapted to 4h time frame, on big coins like ETH and BTC . However it can be adapted to other markets, timeframes etc
For this strategy I use a combination of a trend line , an oscillator, price action and volume .
This study has alert for both long and short entries/exit.
The rules are the next ones:
Long : we check that current candle is ascending and above the moving average, the macd is in positive range, rsi is below overbought level and volume is bigger than the moving avg of volume .
For short, we have the opposite long rules.
If you have any questions, please let me know !

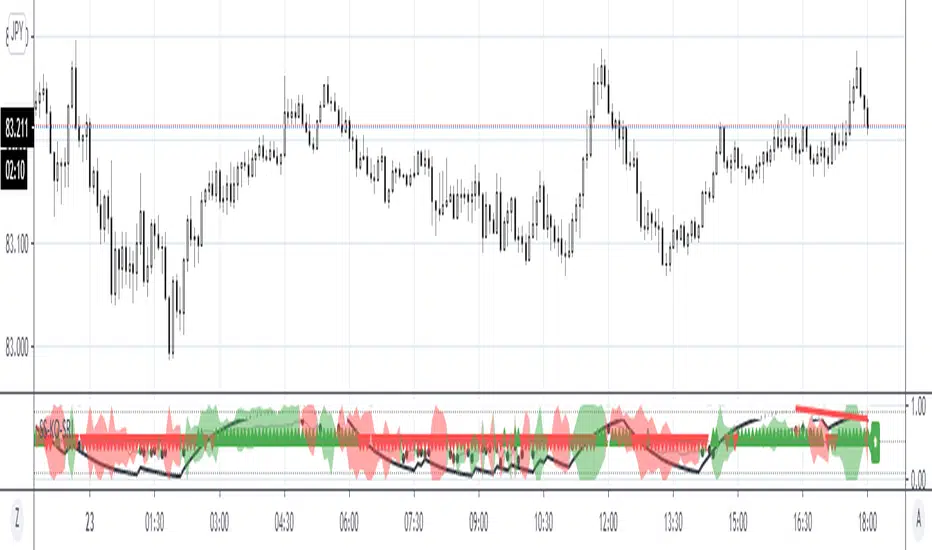
Similarity Search, Karobein and Seasonal Random IndexSimilarity Search, Karobein oscillator (KO) and Seasonal Random Index (SRI)
Description:
This indicator uses dynamic capabilities of Pinescript version 4 coupled with Seasonal Random Index (SRI) and Karobein Oscillator (KO). SRI (green/red areas) is employed to detect trends and KO (black curce) is used to find historical similarities to predict the next bar's direction. The midline arrows are the predictions produced by the similarity search algorithm.
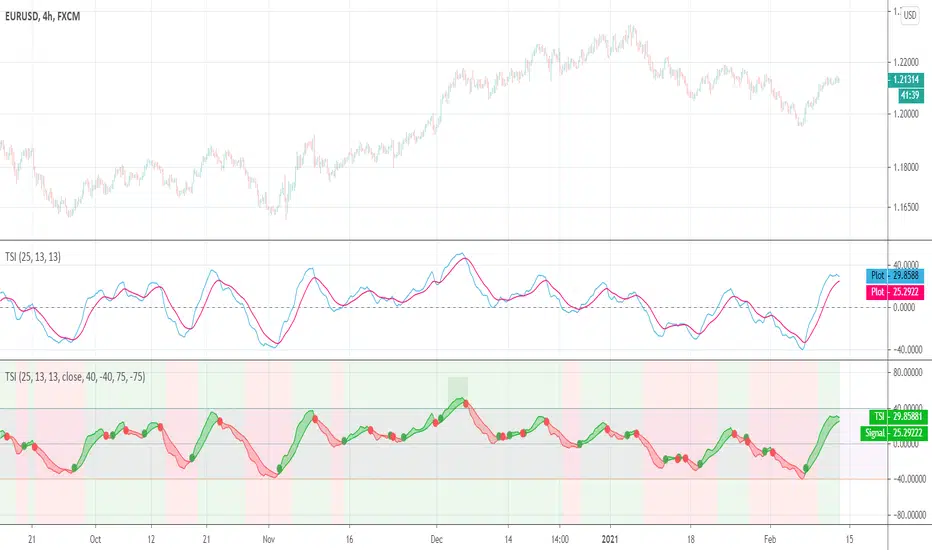
True Strength Index (TSI)User request. A tuned version of the built-in True Strength Index (TSI) indicator with the following options included:
TSI - Signal Histogram
TSI/Signal Crossovers
TSI/Signal Ribbon
Bands breakouts highlighting
Zero line crossovers background
Comparison (Malaysia Index & Sector)This is just a simple tool for convenient to compare and showing a clear image of all sector and index in Malaysia. They are just in one indicator. From this indicator, you can predict momentum of each sector in Malaysia, which is currently in bull or bear trend.
STRUCTURE
In the setting, the first line with the option of the following index (Malaysia Index) :
1. FBMKLCI
2. FTSEMYX:FBMSCAP
3. FTSEMYX:FBMACE
4. FTSEMYX:FBM70
5. FTSEMYX:FBMT100
6. FTSEMYX:FBMFLG
7. FTSEMYX:FBMEMAS
8. FTSEMYX:FA40
9. FTSEMYX:FBMMSCS
10. FTSEMYX:FBMAPMYR
11. FTSEMYX:FBMMSCAP
The rest of lines is all of the following sector (Malaysia Sector):
1. Technology
2. Telecommunication
3. Health
4. Consumer Product
5. Industrial Product
6. Construction
7. Property
8. Plantation
9. Utilities
10. Transportation
11. Energy
12. REIT
13. Finance
The last line (Line 15) is provided for other stock/index which is not available in option to manually fill.
All sector and index price are smoothen by Moving Average (MA). The default moving average is Relative Moving Average (RMA) which is used in Relative Strength Index ( RSI ) Oscillator. But the range is different from RSI , it is from -100 to 100 instead of 0 to 100. In the end, result and interpretation are just the same as RSI . Green area indicates oversold area, while red area is overbought.
Other choice of Moving Averages are available to change.
The problem of putting all together is the script may take longer to process. It is just for convenient use.
Bottom-Up or Top-Down Invest?

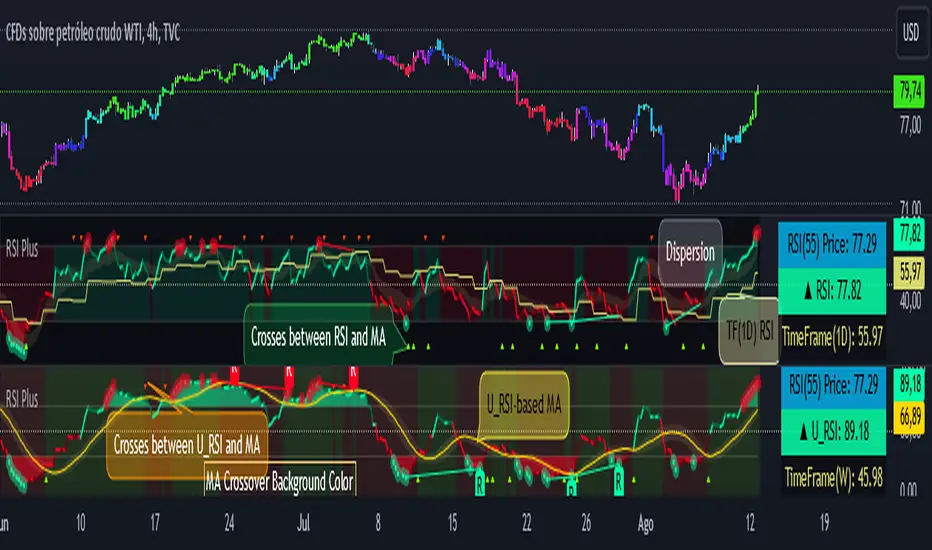
RSI PlusRSI Plus:
☑️ Show the divergences.
☑️ Shows the approximate price of an RSI level (by default it is level 55 but it can be changed for any other level).
☑️ Shows the bulls and bears zones, in green when crossing level 50 up and red when crossing down.
☑️ Circle the highest and lowest levels as possible purchases and sales.
☑️ Includes a smoothed RSI.
RSI Plus:
☑️ Muestra las divergencias.
☑️ Muestra el precio aproximado de un nivel del RSI (por defecto viene el nivel 55 pero se lo puede cambiar por cualquier otro nivel).
☑️ Muestra la zonas de toros y osos, en verde cuando cruza hacia arriba el nivel 50 y rojo cuando cruza hacia abajo.
☑️ Marca con un circulo los niveles mas alto y mas bajos como posibles compras y ventas.
☑️ Incluye un RSI suavizado.
(FINNIFTY) NIFTY Financial Service FreeFloat VolumeThis indicator is build keeping in mind how the Indian Market is formed - the free-float market capitalization concept
1) Considered new FINNIFTY - Nifty Financial Service index stocks according to NSE
2) Multiplied each stock Volume by its Weightage given in NSE Site every month End - means giving importance to volume by its weightage
3) Green Candle - Considered as +Ve Volume , Red Candle - Considered as -Ve Volume
4) Diff of +Ve Volume & -Ve Volume give clear picture market will go up or down
Note:- This Indicator work only for 15 Min time frame
Gives better results good Risk Reward used near Supp/Resistance
Combine with FINNIFTY Advance-Decline Ratio give confidence on the move
Eg:-
Bullish Scenario
Near Support, Volume Turned -Ve to +Ve, Adv /Dec of Fin Nifty >11/15
or combine any candle patterns( Pin Bar ) at Sup/Res or combine with Chart Pattern(Triangle/ Rectangle )
Bearish Scenario - Vice Versa to above

Finex PremiumBitfinex:BTCUSD premium/discount compared to market average spot exchanges.
Smoothed option available.

Crypto Directional Movement Index DMI/ADXCrypto ADX + DMI
This indicator is a customised version of the ADX + DMI by J. Welles Wilder in 1978, with default settings optimal for cryptocurrencies.
What is the DMI (ADX) Indicator?
According to Investopedia:
DMI (ADX) consists of three indicators that measure a trend’s strength and direction. Three lines compose the Direction Movement Index (DMI): ADX (black line), DI+ (green line), and DI- (red line). The Average Directional Index (ADX) line shows the strength of the trend. The higher the ADX value, the stronger the trend. The color of the lines can be altered, but black, green, and red are the default in most software.
The Plus Direction Indicator (DI+) and Minus Direction Indicator (DI-) show the current price direction. When the DI+ is above DI-, the current price momentum is up. When the DI- is above DI+, the current price momentum is down.
This Version
The ADX default value has been changed to from 14 to 2 (optimal for cryptocurrencies). The background flashes red when the –DMI goes above the HZ1 threshold and green when the +DMI does the same. There is an option to change it so that it’ll only flash when the ADX and the DMI are both above the threshold. The ADX changes color when above HZ1.
Red and green plotshapes appear at DMI crossovers and three horizontal lines have also been added.
Any suggestions are most welcome

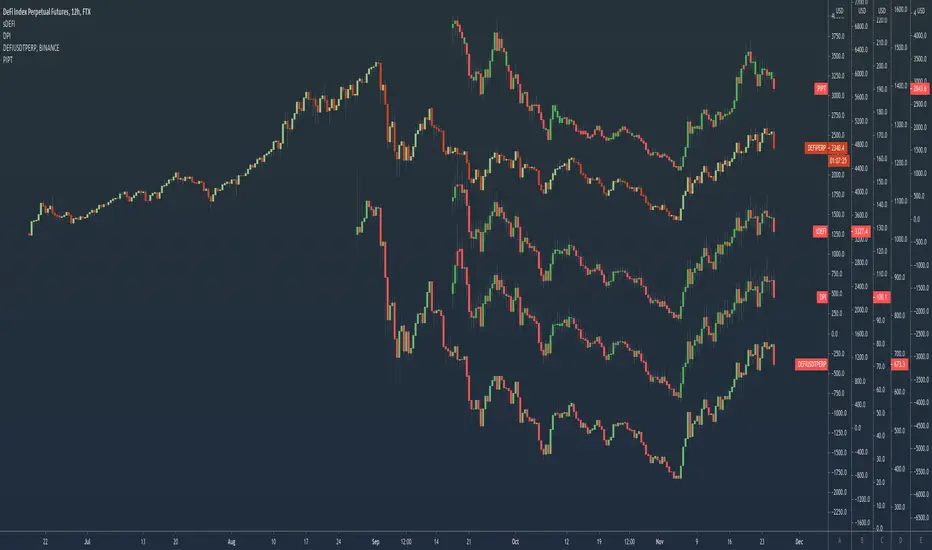
PIPT | Power Index Pool Token | DeFi indexPowerPool provides a DeFi index that has too many components to be used as a chart ticker.
So here is an indicator to bypass the ticker limit.
From the PowerPool docs : app.powerpool.finance
The chart shows it in comparison to other DeFi indexes, quite a difference as you can see!
DPI | DeFi Pulse IndexTokenSets and DeFi Pulse provide a DeFi index that has too many components to be used as a chart ticker.
So here is an indicator to bypass the ticker limit.
From the TokenSets docs : www.tokensets.com
The chart shows it in comparison to other DeFi indexes, quite a difference as you can see!
