This indicator can apply my previous indicator, Historical and Standard Stochastic, to Money Flow (ADMF) or Absolute Strength Index (ASI) or both at the same time. It can also display those two indicators in regular mode as well as showing visual cues when the indicators make new ATH or ATL. ASI is basically a new name I am giving to my Gain/Loss Moving Average...
The Market Facilitation Index is an indicator that relates price range to volume and measures the efficency of price movement. Use the indicator to determine if the market is trending. If the Market Facilitation Index increased, then the market is facilitating trade and is more efficient, implying that the market is trending. If the Market Facilitation...
As you can see in the chart below, regular ATR is not useful for long term analysis. Normalizing it, fixes the issue. This indicator can be used to measure absolute volatility. It has a built-in stochastic as well for relative volatility. ATR counts high and low in the equation unlike Bolinger Band Width. Stochastic:
US 2 year and US 10 year comparison, inverted yield curve with VIX. I use this on a weekly chart with 2 moving averages, the 40 week (ma200 daily) and the 520 week (10 year median). The bottom histogram is the VIX and the plot is the yield curve. When the VIX is above a certain level (you can set it in settings) and the ýield curve is close to or at inversion the...
This script offers an SMI index of VIX, SPY, and NDX. Rather than overlaying VIX, NDX and SPY on the same chart. It's much easier to see the correlation between VIX's price and NDX / SPY price in this manner. Thanks to Buckkets & William Blau for the TSI smoothing method.
Created cryptocurrency index in the image and likeness of the Dow Jones. for this we have created a virtual cryptoperthite. This portfolio was formed on 7-08-2014, when allegedly purchased for 1 thousand dollars of each cryptocurrency. On that date, make a certain quantity amount of cryptocoins depending on the value. If bought 5 coins, then spent 5 thousand...
I present you my last indicator. A volume indicator that indicates overbought and oversold based on the rsi, I chose the rsi because the most used surment, this indicator allows you to identify the overbought and oversold areas of the rsi with the colors blue (oversold) and orange (overbought ) on the volume indicator! Hoping that you are useful
Trend Detection Index indicator script. This indicator was originally developed by M.H. Pee (Stocks & Commodities V. 19:10 (54-61): Trend Detection Index).
Relative Vigor Index with Dominant Cycle Detection. As Ehler's mentioned, fixed length look back is inherently flawed when it is possible to extract a length from a dominant price cycle. may be less effective if signal to noise ratio is greater than 2, but that usually would not happen at >5m candles, and honestly shouldn't be looking at RV(igor)I when price is...
Relative Momentum Index indicator script. This indicator was originally developed by Roger Altman (Stocks & Commodities V. 11:2 (57-60)). RMI with momentum period of 1 will be equal to an RSI when they have the same period and source price.
Intraday Momentum Index indicator script. This indicator was originally developed by Tushar Chande.
Trend Intensity Index indicator script. This indicator was originally developed by M. H. Pee (06/2002 issue of Stocks and Commodities Magazine)
This is the Relative Vigor Index indicator just multiplied by 100 to have non-zero integer part
The Performance indicator or a more familiar term, KPI (key performance indicator), is an industry term that measures the performance. Generally used by organizations, they determine whether the company is successful or not, and the degree of success. It is used on a business’ different levels, to quantify the progress or regress of a department, of an...
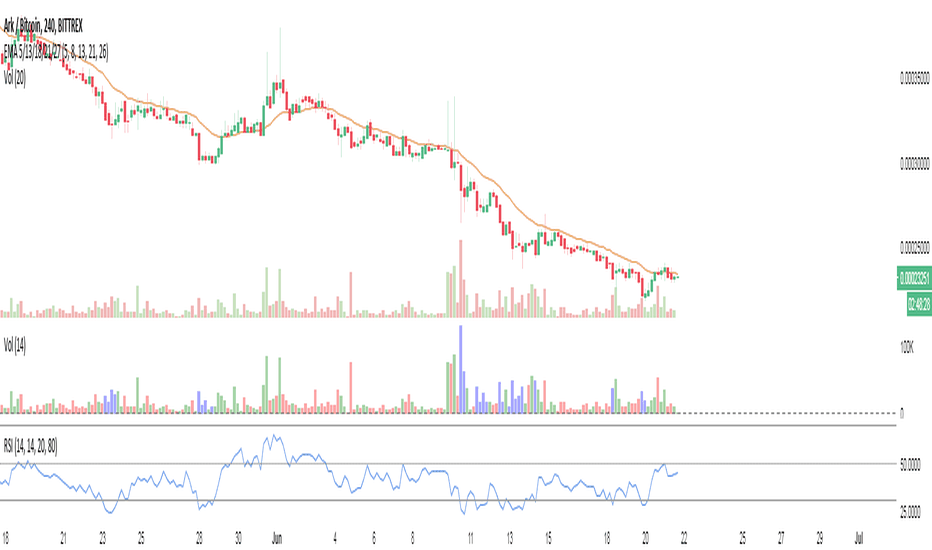
Relative Strength Index with indicator lines at 20, 30, 50, 70 and 80 marks. Use settings to show/hide these lines, and to choose appropriate colors.
This study is a simple variation of M. H. Pee's Trend Intensity Index that includes two signal lines rather than one for additional trend confirmation.
This is an iteration of Steve Nison's Disparity Index that includes 5 different moving average types to choose from.
![Stoch Money Flow (ADMF) & Absolute Strength Index (ASI) [cI8DH] BTCUSD: Stoch Money Flow (ADMF) & Absolute Strength Index (ASI) [cI8DH]](https://s3.tradingview.com/2/2XiF9PJd_mid.png)


![Normalized Average True Range (NATR) (Volatility) [cI8DH] BLX: Normalized Average True Range (NATR) (Volatility) [cI8DH]](https://s3.tradingview.com/l/LUvQgXce_mid.png)


![Kripto Index (KRIN) [WOZDUX] LTCUSD: Kripto Index (KRIN) [WOZDUX]](https://s3.tradingview.com/z/zG91zj0Y_mid.png)


![Trend Intensity Index [DW] ETHUSD: Trend Intensity Index [DW]](https://s3.tradingview.com/n/N1q208o2_mid.png)

![Disparity Index [DW] NZDUSD: Disparity Index [DW]](https://s3.tradingview.com/w/W6c3JsZK_mid.png)