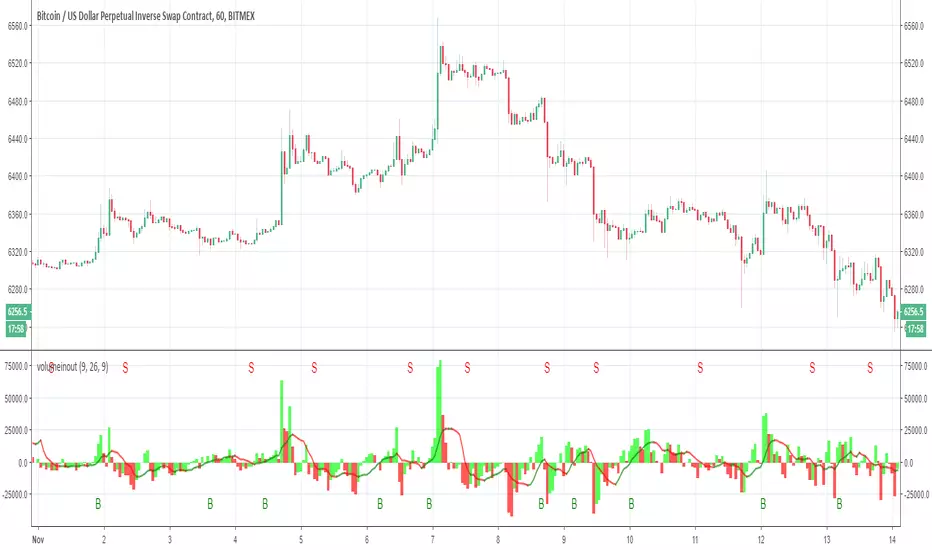
Volume in out as MACD with alerts Lets make the Volume in out as MACD with alerts (B =buy) S=sell have funPine Script® インジケーターRafaelZioniの投稿105
BNG MACD / Blue and Green MACDJust publish it again so it's easier to search this indicator. Just inspired from macd 4c. I changed it to blue and green color so it's looks better.Pine Script® インジケーターc073の投稿73
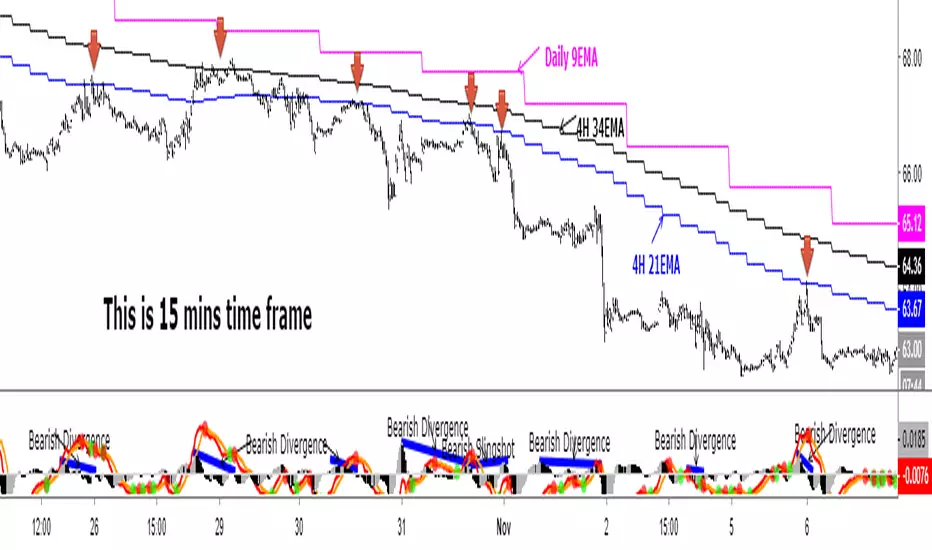
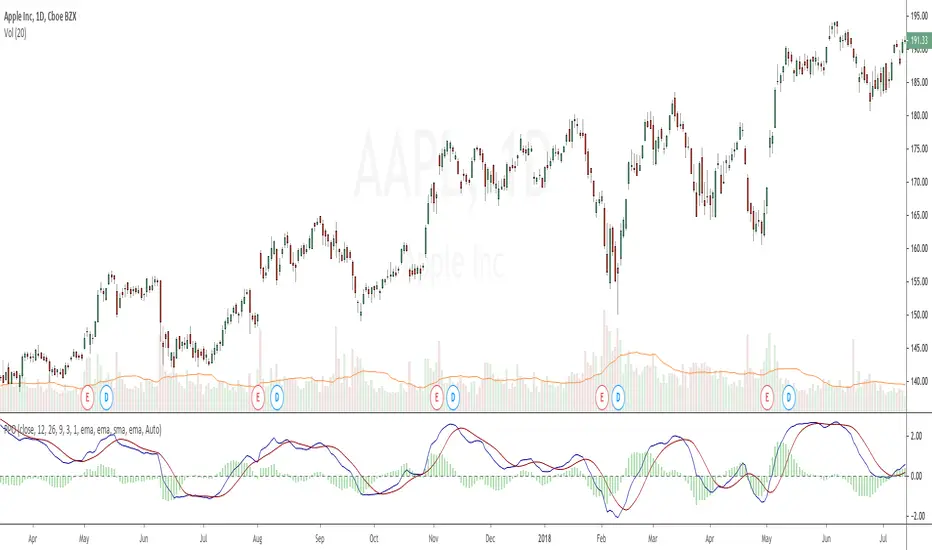
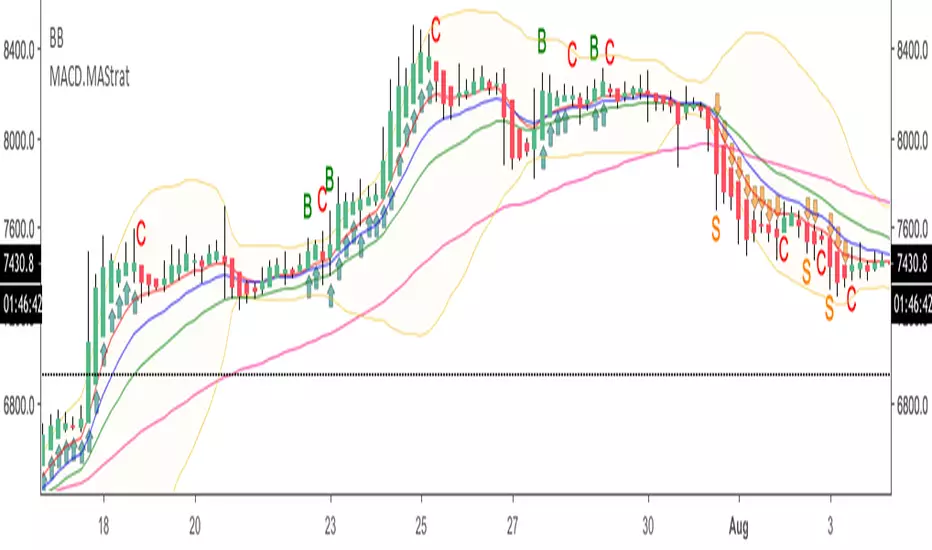
Daily 9 EMA Plotted at Other Than Daily Time Frame Credit to the great @Zoen Triste for his original script at: I just amend it for the Daily, 4H and other time frames. The main function of the Daily 9EMA (pink line) is to easily distinguish the big trend. It is also for multi time frames dynamic support / resistance when trading using tf lower than Daily, without having to toggle between the time frames. Everything is there at a single time frame chart. I like to day trade and switch to swing trade when there is a solid setup for it. To be able to do that, I use 15mins tf together with the Daily 9EMA, 4H 34EMA and 4H 21EMA. How to trade using this setup? First of all, if price is below the pink line (Daily 9EMA), it means the big trend is downtrend (and vice versa). When price retrace and reach the blue (4H 21EMA) or black (4H 34EMA) or the pink (Daily 9EMA) line (look at the red arrows), if there is bearish divergence / slingshot at the MACD's histogram together with a reversal candle such as pin bar (shooting star), dark cloud cover or bearish engulf, it's a short setup. We don't need to put the Stop Loss immediately. We can wait for the price to resume in the direction of the big trend to trail the SL. I do add up daily and weekly pivots and trendlines for additional support / resistance for greater confidence. If the above setup occurs at certain pivots and trendline, we'll have a very high probability setup. Please see the zoomed-in chart as below: When price is above the pink line, the setup is just the opposite. My conclusion: When day trading using this setup at smaller time frames such as 15mins, we don't have to toggle between 4H and 15min time frames to see where is the EMA21 and EMA34 at 4H for the moment. It's like we are able to see a microscopic and bird's eye views at the same time using a single time frame chart. Pine Script® インジケーターTheDemonTraderの投稿44335
Dual MACDI like the Dual MACD for detecting moves a bit earlier. I use the standard MACD for actual confirmation.Pine Script® インジケーターdanbeaulieuの投稿11171
Derivative OscillatorThis indicator was originally developed by Constance (Connie) M. Brown (Journal of Technical Analysis (Winter-Spring 1994, 45-61): "Derivative Oscillator: A New Approach to an Old Problem").Pine Script® インジケーターevergetの投稿更新済 66413
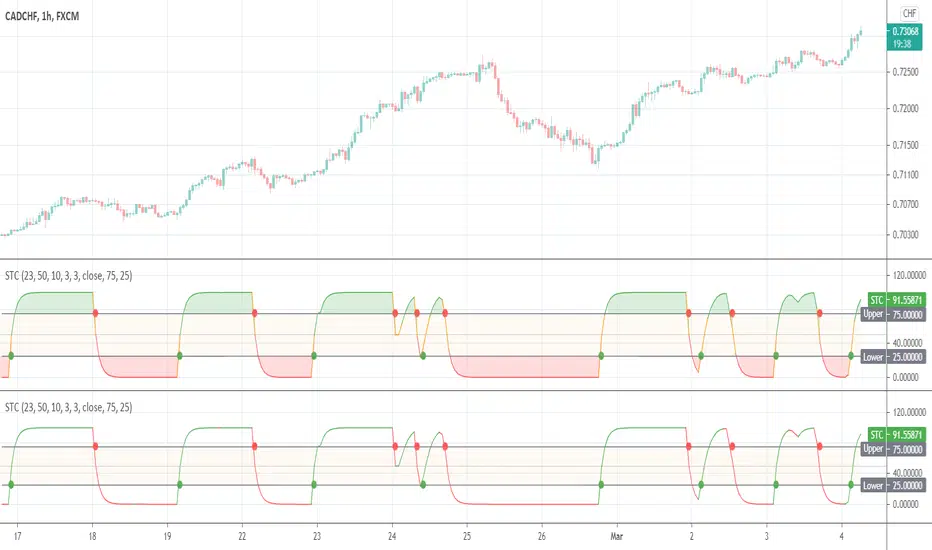
Schaff Trend CycleThis indicator was originally developed by Doug Schaff in the 1990s (published in 2008).Pine Script® インジケーターevergetの投稿更新済 4545 4.3 K
Percentage Price OscillatorThe Percentage Price Oscillator (PPO) is a momentum oscillator that measures the difference between two moving averages as a percentage of the larger moving average. As with its cousin, MACD, the Percentage Price Oscillator is shown with a signal line, a histogram and a center line. Signals are generated with signal line crossovers, center line crossovers, and divergences. More info here and here . The indicator allows you to change the type of all moving averages (Simple, Exponential, Weighted, Volume-weighted, Triple EMA or a moving average that uses RSI ). The indicator also allows you to volume weight it(turned on by default), which will turn it into an indicator very similar to the Volume-Weighted Moving Average Convergence Divergence (VW-MACD) first used by Buff Pelz Dormeier in 2002 and described in detail in his book "Investing with Volume Analysis: Identify, Follow, and Profit from Trends". If you want to weight the oscillator against the true range instead of volume this is also possible. By default, this will be done automatically for assets that do not support volume. By checking the box "MACD" you can also turn this indicator into a standard MACD indicator.Pine Script® インジケーターmodheliusの投稿更新済 22295
9 x TimeFrames: MACD + Histogram, Logarithmic***Up to 9 MACD's with fixed timeframes*** -Simply enter your MACD settings, and which timeframes you would like to see. -Settings stick regardless of viewing resolution (within reason) -Enter 0 to disable if you want less than 9 MACD's ***Logarithmic option for consistency over long timeframes*** ***Layered histogram, can be disabled, adjusted vertically*** Pine Script® インジケーターgamazamaの投稿更新済 22156
Price Normalised Moving Average Convergence DivergencePrice EMA's difference is Divided by Slower EMA thus making price values irrelevant and giving EMA's difference in relative (proportional) termsPine Script® インジケーターchemmistの投稿44
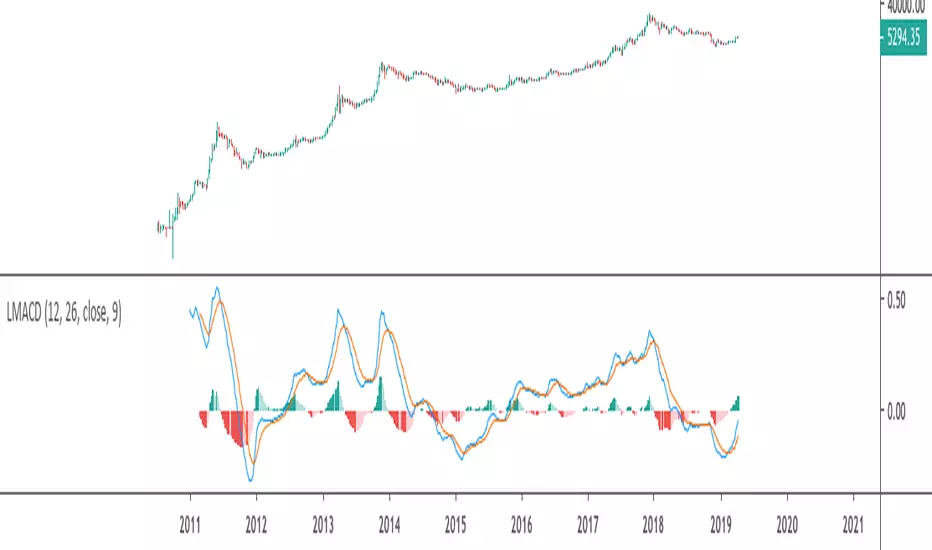
Logarithmic Moving Average Convergence DivergenceConvergence Divergence of Logarithms of EMA'sPine Script® インジケーターchemmistの投稿更新済 2121850
MACD (Moving Average Convergence/Divergence) + Inside BarMACD (Moving Average Convergence/Divergence) + Inside Bar so that free users can have two things in same indicator. Script is open for everyone. Check and test the code of Inside Bar and let me know if it is correct. Feel feel to share.Pine Script® インジケーターMaulikxLakhaniの投稿22224
HA.MACD.MA.TradeSetupsHi probably trade setups indicator intended to be used with Heikin Ashi candles. It uses fibo EMAs and MACD to signal longs/shorts. Intended for scalping high cap coin with high volume on lower time frames.Pine Script® インジケーターemkill2005の投稿更新済 11170
RSMACDDefault MACD formula filtered by an RSCD, a Relative Strength Index midpoint transpose over a 21 length moving average. Checking both filters the MACD with the RSCD. Checking only the MACD plots only the MACD. Checking only the RSCD plots only the RSCD.Pine Script® インジケーターj1O9SBの投稿更新済 30
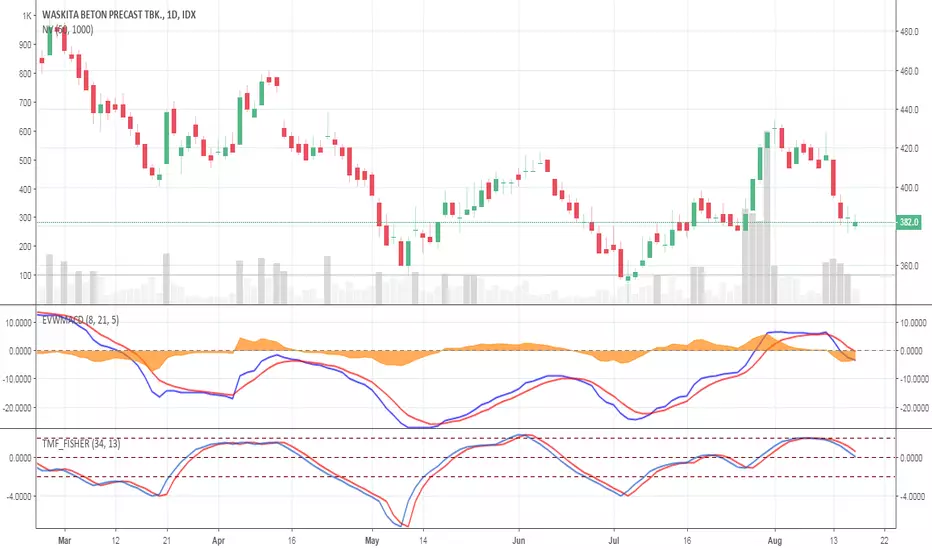
Elastic Volume Weighted MACD ( EVWMACD )The Elastic Volume Weighted MACD is a variation of standard MACD. The Difference is that this script apply the formula of standard MACD with the Elastic Volume Weighted Moving Average. I took the formula of EVWMA from public library coded by LazyBear. I use EVWMACD as a trend confirmation indicator. Just tune all lengths and parameters according to your instrumentsPine Script® インジケーターhaidinurhasfiの投稿109
VMACD IndicatorVolume-Weighted MACD Indicator. You can turn volume-weighted off to get "regular" MACD, and you can change the scaling of the histogram to make it stand out more.Pine Script® インジケーターnj_guy72の投稿44191
MACD/Histogram Divergence ToolThis MACD/Histogram indicator helps me to identify divergences and crosses without much effort. The MACD line is green during a positive cross, and red during a negative. My favourite feature is the following: when the histogram changes direction, the histogram bars become yellow, which should help you locate divergences without straining yourself. Example: Upticking (Green) histogram begins to downtick, turns Yellow. Downticking (Red) histogram begins to uptick, turns Yellow as well. Pine Script® インジケーターmrahme97の投稿99
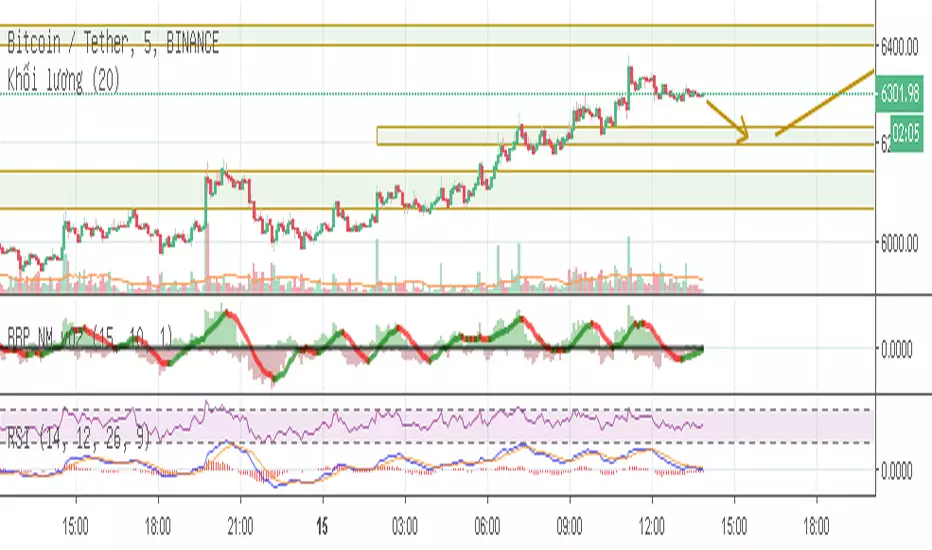
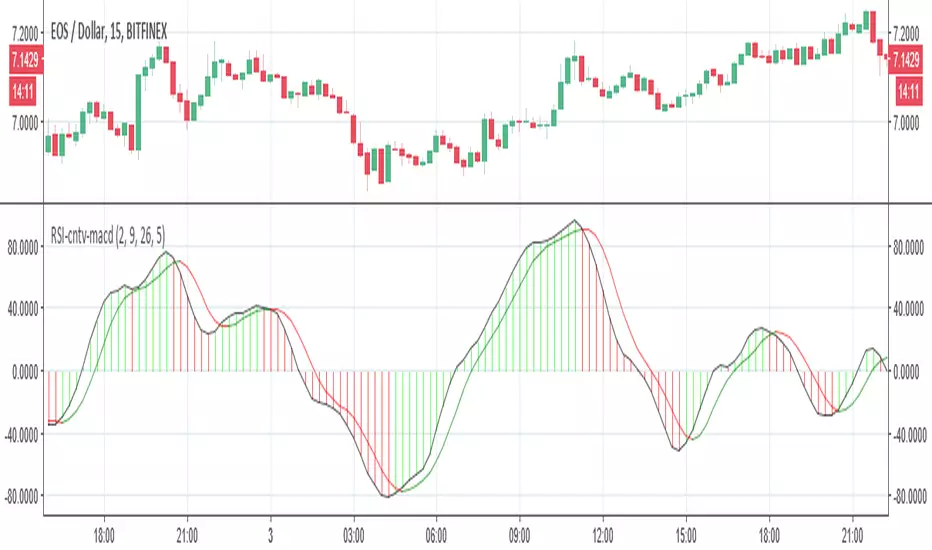
RSI-cumulative net volume as MACDSo here in this model I take the RSI-cumulative net volume and convert it to MACD I think it look nicer then original but it just idea:) for different time frame just change setting:) Pine Script® インジケーターRafaelZioniの投稿33574