V-Max Strategic Horizon: Cross-TF Coordinate Sync (Public EditioOverview
The V-Max Strategic Horizon is a technical visualization utility designed to solve the problem of coordinate drift during multi-timeframe analysis. It serves as a "Physical Coordinate Anchor," ensuring that high-level resistance and support boundaries from macro timeframes (e.g., 1H, 4H, or 1D) remain strictly locked and visible even when the trader scales down to 1M or 3M execution charts.
Core Technical Logic
Timeframe Anchoring Engine: The script utilizes request.security with a fixed lookback_cnt to pull the absolute highest and lowest price points from a specified anchor timeframe.
Absolute Coordinate Locking (Zero-Drift): Unlike manual horizontal lines that may become misaligned, this tool employs the line.new system with extend.both logic. This ensures the horizons are mathematically tied to the price scale, providing a consistent strategic reference across all chart resolutions.
High-Speed Computational Logic: To prevent the "Script Timeout" errors common in multi-timeframe indicators, the v11.0 engine eliminates iterative loops, favoring vectorized calculations for real-time responsiveness.
Dynamic Metadata Labeling: The script features an automated labeling system that dynamically identifies the source of the data (e.g., "1H Anchor") and displays the precise price coordinate, reducing cognitive load during high-frequency trading.
How to Use
Set Your Anchor: Choose your strategic timeframe (e.g., 1H for day trading, 1D for swing trading) in the settings.
Define the Scan Range: Adjust the lookback count to determine the "strength" of the historical horizon.
Execute with Context: Watch how the price interacts with the "Red" (Resistance) and "Green" (Support) horizons on your 3M chart to identify macro-rejections or breakouts.
產品概述
V-Max 戰略地平線 是一款解決多時框分析中座標位移問題的技術工具。它作為「物理座標錨點」,確保大週期(如 1H、4H 或 1D)的壓力與支撐邊界,在交易者切換至 1M 或 3M 執行圖表時,依然嚴格鎖定且清晰可見。
核心技術邏輯
時框錨定引擎:利用跨時框數據抓取技術,獲取指定基準時區的絕對價格極值。
絕對座標鎖定(零位移):採用 line 渲染系統配合同步延伸邏輯,確保地平線在數學上與價格刻度綁定,提供一致的戰略參考。
極速運算邏輯:v11.0 引擎優化了跨時框數據處理,消除了複雜迴圈,確保在短線圖表上實現零延遲性能。
Access & Support
This script is published as a Free Public Utility in the TradingView Library. Disclaimer: For technical analysis purposes only.
Levels

Options Gamma Flip Zones [BackQuant]Options Gamma Flip Zones
A market-structure style “gamma flip” mapper that builds adaptive strike-like zones, scores how price interacts with them, then promotes the strongest candidates into confirmed flip zones. Designed to highlight pinning, failed breaks, and rotational behavior without needing live options chain data.
What this indicator does
This script identifies price levels that behave like “strike magnets” during conditions that resemble options pinning, then draws dynamic zones around those levels.
Instead of assuming every round number matters, it:
Creates a strike ladder (auto or manual step).
Applies a regime filter that looks for “pin-friendly” market conditions.
Tracks and scores repeated interactions with the level.
Upgrades a zone from candidate to confirmed when enough evidence accumulates.
Invalidates zones when price achieves sustained acceptance away from them.
The output is a set of shaded boxes (zones) centered on strike-like levels, with text readouts that show the current state of each zone.
Key concept: “Gamma proxy”
A true gamma flip requires options positioning data. This indicator does not use options chain gamma.
Instead, it uses a proxy approach:
When markets have elevated volatility relative to their recent baseline AND trend strength is weak, price often behaves “sticky” around key levels.
In those conditions, repeated touches and failed escapes around a level behave similarly to pinning around strikes.
So this tool is best read as:
“Where would a strike-like magnet likely exist right now, based on price behavior and regime conditions?”
How zones are created
Zones only start forming when the script detects a pin-friendly regime.
1) Strike Ladder (level selection)
Auto Strike Step selects a step size based on current price magnitude (bigger price, bigger step).
Manual Strike Step lets you force a fixed increment.
The current “active level” is the nearest rounded level to price.
Major Level Every optionally marks major ladder levels (multiples of step).
2) Band construction (zone thickness)
Each zone is a symmetric band around the level, using one of two modes:
ATR mode scales thickness with volatility.
Percent mode scales thickness as a fraction of price.
This matters because “pin behavior” is not a single tick. It’s a region where price repeatedly probes and rejects.
Regime filter (when the script is allowed to believe in pinning)
A zone is only eligible to form and strengthen when Pin Regime is active. Pin Regime is a conjunction of:
1) IV proxy (ATR z-score)
Uses ATR as a volatility proxy.
Converts ATR% into a z-score relative to a long lookback.
IV Proxy Threshold controls how elevated volatility must be before the script considers pinning likely.
2) Weak trend requirement
The script also requires price action to be non-trending:
EMA spread must be small (fast vs slow EMA not diverging strongly).
ADX must be below a ceiling, confirming weak directional trend strength.
Interpretation:
High “IV proxy” + weak trend is where pin-like behavior is most common.
If trend is strong, zones are less meaningful because price is more likely to accept away from levels.
Flip confirmation logic (what upgrades a zone)
A zone is not “confirmed” just because price is near it once. The script builds conviction via evidence accumulation.
Evidence types:
Touches : price comes close to the level within tolerance.
Failed escapes : price pushes outside the band but closes back inside (rejection).
Acceptance run : consecutive closes outside the band, suggesting price is accepting away from the zone.
Protections:
Touch Cooldown prevents counting the same micro-chop as multiple touches.
Acceptance Bars defines what “real acceptance” means, so the zone does not get invalidated by one noisy bar.
A zone becomes confirmed when:
Touches meet the “evidence” requirement.
Failed escapes meet the “rejection” requirement.
The regime filter still says the market is pin-friendly.
That is important, it avoids promoting levels that only worked briefly in a trending tape.
Zone scoring and lifecycle
Each zone maintains a score that evolves over time. Think of score as “how much this level has recently behaved like a magnet.”
Score dynamics:
Decay per bar : score fades over time if price stops respecting the zone.
+ per touch : repeated proximity increases score.
+ per failed escape : rejections add stronger reinforcement.
- per acceptance bar : sustained trading outside reduces score.
Min score to draw : prevents clutter from weak, low-confidence zones.
Invalidation:
If the score becomes very weak AND price achieves sustained acceptance away from the zone, the zone is deleted.
This keeps the chart clean and ensures zones represent current market behavior, not ancient levels.
How to read the plot on chart
1) Zone fill and border
Each zone is drawn as a box extended to the right.
Fill opacity adapts to zone strength, strong zones are visually more prominent.
Border color encodes the current directional context and special events.
2) Bullish vs bearish coloring
A zone is colored bullish when price is currently trading above the zone’s mid-level.
A zone is colored bearish when price is currently trading below it.
This is not a trade signal by itself, it is a state cue for “which side is in control around the level.”
3) Failed escape highlighting
If price attempts to break above the band and fails, the border temporarily highlights as a failed up escape.
If price attempts to break below the band and fails, the border temporarily highlights as a failed down escape.
These are the moments where pin behavior is most visible:
Break attempt.
Immediate rejection.
Return to the band.
4) Midline (optional)
The zone midline is the strike-like level itself.
It is dotted to distinguish it from price structure lines.
5) Optional strike ladder overlay
When enabled, the script draws major and minor ladder lines near current price.
Major levels are thicker and less transparent.
This is a visualization aid for “where the algorithm is rounding,” not a prediction tool.
On-chart text readout (what the box text means)
Each box prints a compact state summary, designed for fast scanning:
Γ CANDIDATE means the zone is being tracked but not yet validated.
Γ FLIP (PROXY) means the zone has met confirmation requirements.
BULL/BEAR indicates which side price is on relative to the mid-level.
L prints the level value.
T is touch count, repeated proximity events.
F is fail count, rejected escape attempts.
IVz is the volatility proxy z-score at the moment.
ADX is the trend strength context.
Practical use cases
1) Pinning and range trading context
Confirmed zones often act like gravity wells in sideways or rotational regimes.
When price repeatedly fails to escape, fading outer edges can be reasonable context for mean reversion workflows.
2) Breakout validation
If price achieves acceptance outside the band for multiple bars, that is stronger breakout context than a single wick.
Zones that invalidate cleanly can mark transitions from pinning to directional move.
3) Time your “do nothing” periods
When Pin Regime is active and a zone is confirmed, the tape often becomes sticky and inefficient for trend chasing.
This helps avoid taking trend entries into a pin environment.
Alerts
Standalone alertconditions are included:
Zone Confirmed : a candidate becomes confirmed.
Zone Touch : price touches an active zone within tolerance.
Zone Invalidated : the zone loses relevance and is removed.
Tuning guidelines
Sensitivity vs quality
Lower Touches Needed and Failed Escapes Needed creates more zones faster, but with lower quality.
Higher values create fewer zones, but the ones that remain are more behaviorally “proven.”
Band width
ATR mode adapts to volatility and is typically safer across assets.
Percent mode is consistent visually but can feel too tight in high vol or too wide in low vol if not tuned.
Regime thresholds
If you want fewer zones, raise IV proxy threshold and tighten weak-trend filters.
If you want more zones, lower IV proxy threshold and loosen weak-trend filters.
Limitations
This is a proxy model, not live options gamma.
In strong trends, pinning assumptions can break, the regime filter is there to reduce that risk, but not eliminate it.
Auto strike step is designed for typical market ranges, manual step is recommended for niche tick sizes or custom markets.
Disclaimer
Educational and informational only, not financial advice.
Not a complete trading system.
Always validate settings per asset and timeframe.

Triple EMA + Key Levels [Scalping-Algo]TITLE: Triple EMA Day Trading System with Multi-Timeframe Support/Resistance Levels
DESCRIPTION:
📊 Overview
This indicator combines trend-following EMAs with key historical price levels to create a complete day trading toolkit. It helps traders identify trend direction while highlighting important support and resistance zones from multiple timeframes.
🎯 Purpose & Trading Application
Day traders often need to quickly assess:
1. Current trend direction (using EMAs)
2. Key price levels where reversals or breakouts may occur
This indicator solves both needs in one tool, reducing chart clutter from multiple indicators.
📈 How It Works
TREND IDENTIFICATION (EMAs):
- EMA 13 (Yellow): Fast EMA for short-term momentum and entry timing
- EMA 48 (Purple): Medium EMA for intraday trend direction
- EMA 200 (Red): Slow EMA for overall trend bias
Trading Logic:
- When price is above all 3 EMAs = Strong bullish bias
- When price is below all 3 EMAs = Strong bearish bias
- EMA crossovers signal potential trend changes
- The 13/48 crossover is particularly useful for intraday entries
SUPPORT & RESISTANCE LEVELS:
- Previous Day High/Low (Green, Solid): Most recent daily range - high probability reaction zones
- 2-Day High/Low (Blue, Dashed): Extended lookback for stronger levels
- Previous Week High/Low (Orange, Dotted): Major institutional levels
Why These Levels Matter:
Previous day and weekly highs/lows are watched by many traders and algorithms. Price often:
- Reverses at these levels (support/resistance)
- Accelerates through them (breakout trades)
🔧 How To Use
FOR TREND TRADING:
1. Identify bias using EMA stack (all 3 aligned = strong trend)
2. Look for pullbacks to EMA 13 or 48 for entries
3. Use key levels as profit targets
FOR REVERSAL TRADING:
1. Watch for price approaching previous day/week levels
2. Look for rejection candles at these levels
3. Use EMA 13 break as confirmation
FOR BREAKOUT TRADING:
1. Identify consolidation near key levels
2. Enter on break of level with volume
3. Use opposite level as target
⚙️ Settings
All parameters are fixed for simplicity:
- EMAs: 13, 48, 200 periods
- Levels: Previous Day, 2-Day, Previous Week
- All lines thickness: 2
📝 Notes
- Best used on intraday timeframes (1min to 1hour)
- Levels update automatically each day/week
- Labels on right side identify each level (PDH, PDL, 2DH, 2DL, PWH, PWL)
---
TAGS: ema, daytrading, support, resistance, levels, intraday, trend, scalping, swingtrading

Volume + VWAP + Prior Session Levels DashboardVolume Spike + VWAP + Session Levels Dashboard
This indicator is a real-time market context dashboard designed to help traders quickly understand participation, value, and key reference levels without cluttering the chart with multiple indicators.
Instead of plotting lines or signals, the script summarizes critical intraday information into a compact on-chart table, allowing traders to make faster, more informed decisions based on how active the market is, where fair value is, and where important reference levels exist.
Core Concepts Used
This script is built on three widely used market principles:
Relative Volume Participation
Volume-Weighted Average Price (VWAP)
Prior Session Reference Levels
The indicator does not attempt to predict direction. Its purpose is to provide objective context that traders can combine with their own strategies.
How the Indicator Works
1. Volume Spike Analysis (Relative Volume)
Rather than showing raw volume, the script measures how unusual the current bar’s volume is compared to recent activity.
A moving average of volume is calculated using a user-defined lookback period.
Current volume is divided by this average to produce a volume multiple (for example, 2.0× normal volume).
This multiple is translated into a descriptive strength label, ranging from Below Threshold to Legendary.
This approach helps traders immediately recognize when participation is significantly above normal, which often coincides with institutional activity, breakouts, or important reactions near key levels.
2. Daily VWAP (Current and Prior Day)
VWAP (Volume-Weighted Average Price) represents the average price traded, weighted by volume, and is commonly used as a measure of fair value.
This script calculates VWAP internally by:
Accumulating price × volume throughout the day
Dividing by total volume
Automatically resetting at the start of each new trading day
The dashboard displays:
Current day VWAP – real-time session fair value
Prior day VWAP – an important reference from the previous session
Traders often use these levels to evaluate whether price is trading at a premium, discount, or near equilibrium.
3. Previous Day High and Low
The indicator also displays:
Previous day high
Previous day low
These levels frequently act as liquidity targets, support/resistance zones, or reaction points, especially during intraday trading sessions.
Dashboard Design
All information is presented in a two-column dashboard showing:
Metric name
Current value or status
The dashboard can be positioned in any corner of the chart and updates in real time, allowing traders to maintain awareness without constantly switching indicators or timeframes.
How to Use This Indicator
This script is best used as a decision-support tool, not a standalone trading system.
Typical uses include:
Identifying abnormally high volume near important price levels
Evaluating price position relative to VWAP
Monitoring reactions around prior day highs and lows
Staying oriented during fast market conditions without chart clutter
The indicator works on any timeframe and adapts automatically to the instrument’s trading session.
Customization Options
Users can:
Adjust the volume moving average length to define what “normal” volume means
Choose the price source used for VWAP calculation
Change the dashboard’s on-screen position
Summary
The Volume Spike + VWAP + Session Levels Dashboard provides a clear, objective snapshot of market conditions by combining participation, value, and reference levels into a single visual tool. It is designed to help traders answer a simple but critical question:
“Is the market doing something meaningful right now — and where?”
This indicator focuses on context, clarity, and usability for traders who want insight without unnecessary complexity.

Pivot Levels [BigBeluga]🔵 OVERVIEW
The Pivot Levels indicator automatically detects and draws key market pivot levels across multiple sensitivity settings. Each pivot level represents a significant local high or low in price structure, acting as potential zones of support and resistance. Traders can visualize short-, medium-, and long-term pivot layers simultaneously, helping to identify where price may react, reverse, or break out.
🔵 CONCEPTS
Different pivot lengths provide multi-length sensitivity on the same timeframe — shorter lengths detect local micro-swings, while longer lengths capture broader swing structure within the current chart.
ATR-based color logic marks active, bullish, or bearish pivot zones dynamically.
Lines can extend to the right or both sides to track reactions over time.
🔵 FEATURES
Detects up to four custom pivot levels simultaneously.
Each pivot level has independent settings for length , style , and extension mode .
Auto-colors each pivot as support (green), resistance (orange), or active zone (blue).
Displays dual-width line layers: a solid base and a transparent overlay for visual depth.
Dynamic price labels show exact pivot levels for clarity.
Fully customizable line styles: dashed (--), solid (-), or dotted (..).
Extends lines to the right for future reaction tracking or both directions for structure alignment.
🔵 HOW TO USE
Enable or disable pivot levels (1–4) to control how many layers of structure you want visible.
Use shorter pivot lengths for intraday turning points and longer ones for macro structure.
Watch for multiple pivot lines clustering in the same region — these often mark strong reversal zones.
Observe color changes: green = support, orange = resistance, blue = active neutral zone.
Combine with price action or volume analysis to confirm reactions near major pivots.
🔵 CONCLUSION
The Pivot Levels indicator provides a clean, multi-layered visualization of market structure.
By tracking pivots of varying lengths, traders can easily identify overlapping support and resistance regions, gauge breakout strength, and align trades with the dominant structural zones visible across multiple time horizons.

Open Interest Bubbles [BackQuant]Open Interest Bubbles
A visual OI positioning overlay that aggregates futures open interest across major venues, normalizes it into a consistent “signal strength” scale, then plots extreme events as bubbles, labels, and optional horizontal levels directly on price.
What this is for
Open interest is one of the cleanest ways to track when positioning is building, unwinding, or aggressively shifting. The problem is raw OI is noisy, exchange-specific, and hard to compare across time. This script solves that by:
- Aggregating OI across multiple exchanges.
- Letting you choose what “OI signal” you care about (raw, delta, percent versions).
- Normalizing the signal so “big events” are easy to spot.
- Plotting those events as bubbles and levels at the exact price they occurred.
You end up with a clean, fast visual map of where large positioning changes occurred, and where those events may later matter as reaction points.
────────────────────────────────────────────────────────────
Plotting types (what you can display)
Bubbles
This mode plots OI events as size-bucketed circles on the chart. Bigger bubbles represent stronger normalized events. You can tune:
- Bubble sizing by bucket (Tiny → Huge).
- Heatmap vs solid color styling.
- Signed vs unsigned coloring (positive/negative separation or magnitude-only).
Best use:
- Spotting “where something changed” at a glance.
- Identifying clusters of positioning events around key price zones.
- Seeing whether the market is repeatedly building/closing positions at similar levels.
Levels
Levels mode draws a horizontal line at the anchor price when an extreme OI event triggers. These act like “positioning memory” levels:
- They do not claim to be support/resistance by themselves.
- They highlight prices where the derivatives market clearly did something meaningful.
Best use:
- Marking potential reaction zones.
- Combining with your price action tools (structure, OBs, FVGs) to confirm whether an OI level aligns with a technical level.
- Building a “map” of where leverage likely entered or exited.
Modes available in the script:
- Off
- Bubbles
- Bubbles + Labels
- Labels Only
- Levels + Labels
────────────────────────────────────────────────────────────
Aggregated Open Interest source (multi-exchange)
This indicator builds a single aggregated OI series by requesting OI data from multiple exchanges and summing it. You can toggle exchanges on/off:
- Binance, Bybit, OKX, Bitget, Kraken, HTX, Deribit
You can also choose OI units:
- COIN , OI in base units (native sizing)
- USD , converted for a dollar-value representation
Important note:
Not every symbol has OI data on every venue. If the script cannot build an aggregated series for the symbol, it will throw an error rather than quietly plotting garbage.
────────────────────────────────────────────────────────────
OI Source, what the bubbles are measuring
You control what “signal” is normalized and plotted:
- Delta , change in aggregated OI from the prior bar.
Use when you want to highlight bursts of new positioning or sudden unwind events.
- Raw OI , the aggregated open interest level itself.
Use when you want to highlight absolute positioning build-up periods.
- Delta % , percent change in OI.
Use when you want moves normalized to the current OI regime, useful across different market eras.
- Raw OI % , percent change form of the raw series.
Use when you want relative changes rather than absolute size.
Practical guidance:
- Delta modes are best for “event detection”.
- Raw modes are better for “regime context” and whether positioning is structurally rising or fading.
────────────────────────────────────────────────────────────
Normalization (the key to making it readable)
Because OI varies massively across assets and time, the script includes multiple normalization modes to convert your chosen OI source into a comparable “strength” value.
Options:
- ZScore , deviation from a rolling mean in standard deviation units.
- StdNorm , scaled by rolling standard deviation.
- AbsZScore , absolute value version for magnitude-only mapping.
- AbsStdNorm , absolute value version for magnitude-only mapping.
- None , plots raw values (advanced users only, often too noisy visually).
Why this matters:
Normalization makes a “1.5” or “3.0” threshold mean something across different assets and timeframes, instead of being stuck to raw OI units.
────────────────────────────────────────────────────────────
Threshold system (when bubbles/levels trigger)
The plot is driven by two user thresholds:
- Base Threshold
Controls where “meaningful” events start. Raising this reduces noise and focuses on larger deviations.
- Extreme Threshold
Controls what qualifies as a top-tier event. Extreme events are what you typically want to convert into labels and levels.
You also control side filtering:
- Both , show positive and negative events.
- Positive Only , show only increases (or positive signal side depending on source).
- Negative Only , show only decreases (or negative signal side).
In practice:
- Use Base Threshold to tune chart cleanliness.
- Use Extreme Threshold to mark only the “big stuff” that tends to matter later.
────────────────────────────────────────────────────────────
Anchor Source (where the bubble/level is placed)
The indicator places bubbles, labels, and levels at a price anchor you choose:
- HL2, Close, Open, High, Low, VWAP
This is important because “where you pin the event” changes how it reads:
- Close is clean and consistent for backtesting and candle-close logic.
- High/Low can better represent where the fight occurred intrabar.
- VWAP can be useful for “fair price” anchoring in active markets.
────────────────────────────────────────────────────────────
Style system (theme, palette, signed logic)
This script is built to look good and stay readable on busy charts.
Themes
- BackQuant, Classic, Ice, Fire, Mono, Custom
Palette Mode
- Solid , one consistent color
- Heatmap , intensity increases with magnitude
- Single Color Adaptive , adapts to chart background for clarity
Side Coloring
- Signed , positive and negative events can use different ramps
- Unsigned , magnitude-only coloring
Negative theme handling:
- Auto (mirrors your chosen theme),
- Invert (flips the ramp),
- Custom (fully user-defined negative palette).
What this gives you:
- You can run a clean “mono” look for professional charts.
- Or a high-contrast heatmap for fast scanning.
- Or fully custom branding colors for BackQuant-style presentation.
────────────────────────────────────────────────────────────
Labels (what’s inside the label)
When labels are enabled, the script can display:
- OI , the aggregated OI value
- OI + Norm , OI plus normalized strength
- Norm Only , just the normalized strength
- Src + Norm , the selected source value (Delta, Raw, %) plus normalized strength
You can also control:
- Left/Center/Right label alignment
- Number formatting style (Raw, Compact, Volume format)
Best practice:
- Use “Src + Norm” when you want both the raw event size and its rarity.
- Use “Norm Only” when you want a clean, minimal chart.
────────────────────────────────────────────────────────────
Levels and object limits (performance and cleanliness)
Because this script draws objects, it includes a hard cleanup system:
- You set Max Levels / Labels to control chart clutter.
- The script deletes older lines/labels when the limit is exceeded.
This is critical if you trade lower timeframes, where OI events can trigger frequently.
────────────────────────────────────────────────────────────
How to interpret the signals
What a large bubble usually means:
- A statistically large positioning change relative to recent history.
- This can represent fresh leverage entering, forced liquidations, or aggressive de-risking, depending on direction and context.
How to use levels:
- Treat them as “attention levels”, not automatic entries.
- Combine them with structure and liquidity tools:
- If price revisits an OI level and shows rejection, it often confirms that level mattered.
- If price slices through with no reaction, it often indicates the OI event was transitional, not defended.
Common setups:
- Clustered extreme bubbles near a breakout zone, then retest later.
- Extreme negative event at capitulation low, followed by structure flip.
- Extreme positive build into resistance, then unwind and mean reversion.
Also, please check out @NoveltyTrade for the OI Aggregation logic & pulling the data source!
Here is the original script:

IDLP - Intraday Daily Levels Pro [FXSMARTLAB]🔥 IDLP – Intraday Daily Levels Pro
IDLP – Intraday Daily Levels Pro is a precision toolkit for intraday traders who rely on objective daily structure instead of repainting indicators and noisy signals.
Every level plotted by IDLP is derived from one simple rule:
Today’s trading decisions must be based on completed market data only.
That means:
✅ No use of the current day’s unfinished data for levels
✅ No lookahead
✅ No hidden repaint behavior
IDLP reconstructs the previous trading day from the intraday chart and then projects that structure forward onto the current session, giving you a stable, institutional-style intraday map.
🧱 1. Previous Daily Levels (Core Structure)
IDLP extracts and displays the full previous daily structure, which you can toggle on/off individually via the inputs:
Previous Daily High (PDH)
Previous Daily Low (PDL)
Previous Daily Open
Previous Daily Close,
Previous Daily Mid (50% of the range)
Previous Daily Q1 (25% of the range)
Previous Daily Q3 (75% of the range)
All of these come from the day that just closed and are then locked for the entire current session.
What these levels tell you:
PDH / PDL – true extremes of yesterday’s price action (liquidity zones, breakout/reversal points).
Previous Daily Open / Close – how the market positioned itself between session start and end
Mid (50%) – equilibrium level of the previous day’s auction.
Q1 / Q3 (25% / 75%) internal structure of the previous day’s range, dividing it into four equal zones and helping you see if price is trading in the lower, middle, or upper quarter of yesterday’s range.
All these levels are non-repaint: once the day is completed, they are fixed and never change when you scroll, replay, or backtest.
🎯 2. Previous Day Pivot System (P, S1, S2, R1, R2)
IDLP includes a classic floor-trader pivot grid, but critically:
It is calculated only from the previous day’s high, low, and close.
So for the current session, the following are fixed:
Pivot P – central reference level of the previous day.
Support 1 (S1) and Support 2 (S2)
Resistance 1 (R1) and Resistance 2 (R2)
These levels are widely used by institutional desks and algos to structure:
mean-reversion plays, breakout zones, intraday targets, and risk placement.
Everything in this section is non-repaint because it only uses the previous day’s fully closed OHLC.
📏 3. 1-Day ADR Bands Around Previous Daily Open
Instead of a multi-day ADR, IDLP uses a pure 1-Day ADR logic:
ADR = Range of the previous day
ADR = PDH − PDL
From that, IDLP builds two clean bands centered around the previous daily Open:
ADR Upper Band = Previous Day Open + (ADR × Multiplier)
ADR Lower Band = Previous Day Open − (ADR × Multiplier)
The multiplier is user-controlled in the inputs:
ADR Multiplier (default: 0.8)
This lets you choose how “tight” or “wide” you want the ADR envelope to be around the previous day’s open.
Typical use cases:
Identify realistic intraday extension targets, Spot exhaustion moves beyond ADR bands, Frame reversals after reaching volatility extremes, Align trades with or against volatility expansion
Again, since ADR is calculated only from the completed previous day, these bands are totally non-repaint during the current session.
🔒 4. True Non-Repaint Architecture
The internal logic of IDLP is built to guarantee non-repaint behavior:
It reconstructs each day using time("D") and tracks:
dayOpen, dayHigh, dayLow, dayClose for the current day
prevDayOpen, prevDayHigh, prevDayLow, prevDayClose for the previous day
At the moment a new day starts:
The “current day” gets “frozen” into prevDay*
These prevDay* values then drive: Previous Daily Levels, Pivots, ADR.
During the current day:
All these “previous day” values stay fixed, no matter what happens.
They do not move in real time, they do not shift in replay.
This means:
What you see in the past is exactly what you would have seen live.
No fake backtests.
No illusion of perfection from repainting behavior.
🎯 5. Designed For Intraday Traders
IDLP – Intraday Daily Levels Pro is made for:
- Day traders and scalpers
- Index and FX traders
- Prop firm challenge trading
- Traders using ICT/SMC-style levels, liquidity, and range logic
- Anyone who wants a clean, institutional-style daily framework without noise
You get:
Previous Day OHLC
Mid / Q1 / Q3 of the previous range
Previous-Day Pivots (P, S1, S2, R1, R2)
1-Day ADR Bands around Previous Day Open
All calculated only from closed data, updated once per day, and then locked.

ATR ZigZag - Volatility-Filtered Market StructureDescription
This indicator draws ZigZags using an ATR based threshold for direction switching to identify major swing highs and lows. Instead of relying on fractals or fixed bar-count swings, pivots are confirmed only when price moves beyond the prior extreme by:
threshold = ATR(length) × ATR_mult
This filters noise, enforces valid swing structure (high → low → high), and adapts automatically to volatility. The ATR ZigZag is ideal for traders who want a clean, objective view of swing structure without noise. This has many uses, including mapping swing structure, drawing chart patterns, and trading around extremes.
Lag and Repainting
Pivots are confirmed only after price moves sufficiently in the opposite direction. This creates necessary lag. The ZigZag is drawn when this occurs, and will anchor to the high/low in the past. Optional detection dot plots show exactly when confirmation occurred.
What You See
ZigZag: dashed gray line, repainted to anchor at the confirmed highs and lows
Latest Pivot Levels: Dashed horizontal lines at the most recent confirmed high/low.
Optional Live Swing Leg: A real-time line from the last confirmed pivot to the current swing extreme, updating until a new pivot forms.
Optional ATR Boxes: 1×ATR shaded zones around the latest pivot for structural context.
Optional Pivot Confirmation Dots: Markers show the bar where the threshold is crossed and a swing is officially confirmed. This is to understand the lag and see when the ZigZag repainted.

HTF Frequency Zone [BigBeluga]🔵 OVERVIEW
HTF Frequency Zone highlights the dominant price level (Point of Control) and the full high–low expansion of any higher timeframe — Daily, Weekly, or Monthly. It captures the frequency of closes inside each HTF candle and plots the most traded “frequency zone”, allowing traders to easily see where price spent the most time and where buy/sell pressure accumulated.
This tool transforms each higher-timeframe bar into a fully visualized structure:
• Top = HTF high
• Bottom = HTF low
• Midline = HTF Frequency POC
• Color-coded zones = bullish or bearish bias
• Labels = counts of bullish and bearish candles inside the HTF range
It is designed to give traders an immediate understanding of high-timeframe balance, imbalance, and price attraction zones.
🔵 CONCEPTS
HTF Partitioning — Each Weekly/Daily/Monthly candle is converted into a dedicated zone with its own High, Low, and Frequency Point of Control.
Frequency POC (Most Touched Price) — The indicator divides the HTF range into 100 bins and counts how many times price closed near each level.
Dominant Zone — The level with the highest frequency becomes the HTF “Value Zone,” plotted as a bold central line.
Directional Bias —
• Bullish HTF zone
• Bearish HTF zone
Internal Candle Counting — Within each HTF period the indicator counts:
• Buy candles (close > open)
• Sell candles (close < open)
This reveals whether intraperiod flow was bullish or bearish.
HTF Structure Blocks — High, Low, and POC are connected across the entire higher-timeframe duration, showing the real shape of HTF balance.
🔵 FEATURES
Automatic HTF Zone Construction — Generates a complete price zone every time the selected timeframe flips (Daily / Weekly / Monthly).
Dynamic High & Low Extraction — The indicator scans every bar inside the HTF window to find true extremes of the range.
100-Level Frequency Scan — Each close within the period is assigned to a bin, creating a detailed distribution of price interaction.
HTF POC Highlighting — The most frequent price level is plotted with a bold red line for immediate visual clarity.
Bull/Bear Coloring —
• Green → Bullish HTF zone.
• Orange → Bearish HTF zone.
Zone Shading — High–Low range is filled with a semi-transparent color matching trend direction.
Buy/Sell Candle Counters — Printed at the top and bottom of each HTF block, showing how many internal candles were bullish or bearish.
POC Label — Displays frequency count (how many touches) at the POC level.
Adaptive Threshold Warning — If bars inside the HTF window are too few (<10), the indicator warns the trader to switch timeframe.
🔵 HOW TO USE
Higher-Timeframe Biasing — Read the zone color to determine if the HTF candle leaned bullish or bearish.
Value Zone Reactions — Price often reacts to the Frequency POC; use it as support/resistance or liquidity magnet.
Range Context — Identify when price is trading near HTF highs (breakout potential) or lows (reversal potential).
Momentum Evaluation — More bullish internal candles = internal buying pressure; more bearish = internal selling pressure.
Swing Trading — Use HTF zones as the “macro map,” then execute trades on lower timeframes aligned with the zone structure.
Liquidity Awareness — The HTF POC often aligns with algorithmic liquidity levels, making it a strong reaction point.
🔵 CONCLUSION
HTF Frequency Zone transforms raw higher-timeframe candles into detailed distribution zones that reveal true market behavior inside the HTF structure. By showing highs, lows, buying/selling activity, and the most interacted price level (Frequency POC), this tool becomes invaluable for traders who want to align executions with powerful HTF levels, liquidity magnets, and structural zones.

Pivot Points Standard w/ Future PivotsPivot Points Standard with Future Projections
This indicator displays traditional pivot point levels with an added feature to project future pivot levels based on the current period's price action.
Key Features:
Multiple Pivot Types: Choose from Traditional, Fibonacci, Woodie, Classic, DM, and Camarilla pivot calculations
Flexible Timeframes: Auto-detect or manually select Daily, Weekly, Monthly, Quarterly, Yearly, and multi-year periods
Future Pivot Projections: Visualize potential pivot levels for the next period based on current price movement
Custom Price Scenarios: Test "what-if" scenarios by entering a custom close price to see resulting pivot levels
Customizable Display: Adjust line styles, colors, opacity, and label positioning for both historical and future pivots
Historical Pivots: View up to 200 previous pivot periods for context
Future Pivot Options:
The unique future pivot feature calculates what the next period's support and resistance levels would be using the current period's High, Low, Open, and either the current price or a custom price you specify for the closing value. Future pivots are displayed with customizable line styles (solid, dashed, dotted) and opacity to distinguish them from historical levels.
Use Cases:
Plan entries and exits based on projected support/resistance
Scenario analysis with custom price targets
Identify key levels before the period closes
Multi-timeframe pivot analysis
Works on all timeframes and instruments.

Session, Weekly, Daily LevelsScroll down for hungarian description!
Magyar leíráshoz görgess lejjebb!
Overview
This script provides a unified market structure mapping tool that automatically identifies and visualizes key intraday, daily, and weekly reference levels. It helps traders contextualize price action throughout the trading week by marking true session opens, previous day highs/lows, weekly highs/lows, and weekday opens, all with accurate historical anchoring and correct timezone handling.
What This Script Does
1. Intraday Session Opens (Tokyo, London, New York)
- Detects the exact candle where each session opens.
- Draws horizontal rays with labels.
- Automatically clears lines at the start of each new day.
- Uses a custom local-to-exchange timezone conversion system.
2. Weekly Levels
- Last week high and low (precise bar anchoring, not HTF aggregation)
- Current week open (also Monday open)
- Auto-reset on new week
- Levels are always drawn from the true candle where they formed.
3. Previous Day High & Low
- Continuously tracks intraday highs and lows.
- On a new day, stores yesterday’s values and anchors rays to the exact bars.
- Levels remain visible for the full current day and reset the next day.
4. Weekday Opens (Tue–Fri)
- Captures the exact opening price of Tuesday–Friday.
- Monday open = Week open, so it is not shown separately.
- Auto-reset on new week.
Timezone Logic (Original Feature)
The script converts:
local session times → exchange timezone → chart timestamps
It works correctly regardless of chart timezone or instrument exchange location.
Line Drawing Logic
- Finds the exact bar_index where each level forms.
- Draws rays extending to the right.
- Labels are placed ahead of price.
- Safe updating prevents “bar index too far” errors.
How to Use
- Identify daily/weekly structure.
- Track bias relative to session opens.
- Observe reactions around weekday opens.
- Compare price action to last week's range.
Originality
- Custom timezone conversion engine.
- True historical bar anchoring.
- Fully automated weekly/daily structural resets.
- Independent styling for each level type.
- Not a mashup; all components follow one unified logic.
Limitations
- Does not predict trend or direction.
- Structural tool only.
Summary
A precise and reliable market structure tool that unifies weekly, daily, and intraday reference levels with full timezone automation and true-candle anchoring.
MAGYAR LEÍRÁS
--------------
Áttekintés
Ez az indikátor egy összetett piaci szerkezet-feltérképező eszköz, amely automatikusan megjeleníti a legfontosabb intraday, napi és heti referenciaértékeket. A célja, hogy a kereskedő tisztán lássa a piac aktuális környezetét: hol nyíltak a főbb devizapiaci szekciók, hogyan alakult a tegnapi tartomány, hol volt a múlt heti csúcs/mélypont, és hogyan nyitottak az egyes hétköznapok.
Mit tud a script?
1. Szekciónyitások (Tokyo, London, New York)
- Megkeresi a pontos gyertyát, amely a szekciónyitáskori árat tartalmazza.
- Vízszintes vonalat és címkét rajzol.
- Minden nap elején automatikusan törli a korábbi nap szintjeit.
- Egyedi időzóna-konverziós rendszerrel működik (helyi idő → tőzsdei idő → chart idő).
2. Heti szintek
- Múlt heti maximum és minimum (pontos gyertyapontra horgonyozva)
- Aktuális heti nyitóár (egyben a hétfői nyitó is)
- Új hét kezdetekor automatikusan frissül.
- A múlt heti high/low nem fix időpontra, hanem a valódi gyertyára kerül.
3. Előző napi High és Low
- Folyamatosan követi a napi maximumot és minimumot.
- Napváltáskor elmenti és pontos gyertyáról indítja a ray-t.
- A szintek a teljes nap folyamán megmaradnak, majd a következő nap törlődnek.
4. Hétköznapok nyitóárai (Kedd–Péntek)
- A kedd, szerda, csütörtök és péntek nyitóárát rögzíti és megjeleníti.
- A hétfői nyitó a Week Open, ezért külön nem jelenik meg.
- Heti váltáskor automatikusan törlődnek.
Időzóna-kezelés (egyedi megoldás)
A script a felhasználó helyi idejét átszámítja az instrumentum tőzsdei időzónájára, majd a chartra vetíti.
Ez biztosítja, hogy minden szekciónyitás helyesen jelenik meg, bármely chart vagy instrumentum esetén.
Vonalrajzolási logika
- A szintek a valódi bar_index alapján kerülnek rögzítésre.
- Jobbra nyúló ray-eket rajzol.
- A címkék mindig a jobb oldalon, előre helyezve jelennek meg.
- Biztonságos frissítési rendszer akadályozza meg a hibákat (pl. “bar index too far”).
Használat
- Napi/heti szerkezet meghatározása.
- Bias követése a session openekhez viszonyítva.
- Reakciók figyelése a hétköznapok nyitóárai körül.
- Összevetés a múlt heti tartománnyal.
Eredetiség
- Egyedi időzóna-kezelő motor.
- Igazi gyertyapont-alapú horgonyzás.
- Automatikus napi/heti reset.
- Minden szint külön stílusban konfigurálható.
- Nem mashup; egységes rendszer.
Összegzés
Professzionális, pontos eszköz a piaci szerkezet feltérképezésére, amely egyesíti a heti, napi és intraday szinteket, teljes időzóna-automatizálással és gyertyapontra horgonyzott kijelölésekkel.

Hash Pivot DetectorHash Pivot Detector
Professional Support & Resistance Detection with Multi-Timeframe Zone Analysis
Developed by Hash Capital Research, the Hash Pivot Detector is a sophisticated indicator designed for identifying key support and resistance levels using pivot-based detection with institutional-grade zone analysis.
Key Features
Zone-Based Detection
Unlike traditional single-line S/R indicators, Hash Pivot Detector uses configurable zones around pivot levels to represent realistic institutional order areas. Adjustable zone width accommodates different asset volatilities.
Multi-Timeframe Analysis
Displays higher timeframe support/resistance levels alongside current timeframe pivots, providing crucial context for institutional positioning and stronger price barriers.
Clean Visual Design
Features Hash Capital's signature fluorescent color scheme (pink resistance, cyan support) optimized for dark charts with high contrast and instant visual recognition. Semi-transparent zones keep your chart clean and readable.
How It Works
The indicator uses pivot high/low detection with configurable left and right bar parameters. When a pivot is confirmed, it plots:
Primary support/resistance lines at pivot levels
Semi-transparent zones representing realistic order areas
Higher timeframe S/R levels as crosses for additional context
Recommended Settings
For Swing Trading:
Pivot Bars: 10-20 left/right
Zone Width: 0.5-1.0%
HTF: Daily (on 1H-4H charts)
For Intraday Trading:
Pivot Bars: 5-10 left/right
Zone Width: 0.3-0.5%
HTF: 1H or 4H (on 5min-15min charts)
Asset-Specific Zone Width:
Forex/Crypto: 0.3-0.5%
Stocks: 0.5-1.0%
Volatile Assets: 1.0-2.0%
What Makes It Different
✓ Zone-based approach (more realistic than lines)
✓ Multi-timeframe confluence detection
✓ Minimal visual clutter with maximum information
✓ Professional institutional aesthetic
✓ Comprehensive tooltips for easy optimization
✓ No repainting - all pivots are confirmed
Best Used For
Identifying high-probability entry/exit zones
Setting stop-loss and take-profit levels
Recognizing breakout/breakdown areas
Multi-timeframe confluence analysis
Swing trading and position trading
Intraday scalping with adjusted parameters
Notes
Works on all timeframes and markets
Fully customizable colors and parameters
All settings include detailed optimization guidance
Clean code, efficient performance
No alerts or notifications (visual analysis only)

Multi-Tool VWAP + EMAs (Multi-Timeframe) + Key LevelsDescription
This indicator combines several commonly used technical analysis tools into a single script, especially useful for traders using the free version of TradingView or anyone looking to reduce the number of indicators on their chart.
The goal is to provide clear visual references for trend, structure, and key levels—without generating buy/sell signals or automated trading functions.
Included Features
1. VWAP (session-anchored)
Source: HLC3
Purple line, thickness 2
Useful as a reference for daily institutional average price.
2. EMAs of the current timeframe
EMA 200 (red, thickness 3)
EMA 9 (green, thickness 1)
These EMAs help visualize long-term trend and short-term momentum.
3. Dynamic EMAs (MTF – Multi-Timeframe)
The indicator displays the 200 EMA from higher timeframes as dynamic horizontal levels:
5 minutes
15 minutes
30 minutes
1 hour
4 hours
1 day
Each level includes a descriptive label such as “15 min EMA 200”.
These EMAs serve as reference points for potential support/resistance areas coming from higher timeframes.
4. Automatic Key Levels
The indicator plots several important price levels:
Previous day:
PDH (Previous Day High)
PDL (Previous Day Low)
Previous Day 50% Fibonacci level
Pre-market (04:00–09:30 exchange time):
PMH (Pre-Market High)
PML (Pre-Market Low)
Current session:
Open (session opening price)
Previous Close (prior day’s closing price)
Purpose and Scope
This script is designed to provide basic visual reference points to support discretionary analysis.
It does not generate signals or trading suggestions, and it is not intended to predict future price movements.
How to Use It
Enable or disable each block in the Inputs section according to your analysis style.
Observe how the levels, EMAs, and VWAP interact with market structure.
Use it as a visual complement to your personal technical analysis.
Limitations
This indicator is not a trading system and does not guarantee results.
It does not include alerts, backtesting, or entry/exit logic.
Some values (such as PMH/PML) depend on the symbol’s exchange trading hours.
Credits
Designed as an educational and analytical tool for traders seeking to simplify their charts without losing key information.

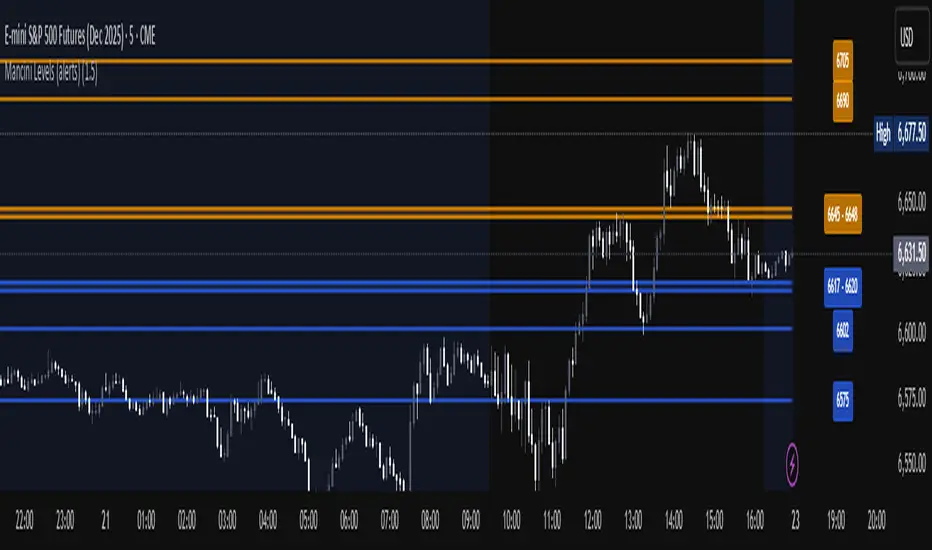
Mancini Levels (with alerts, majors only option)This indicator displays Support and Resistance levels on ES or MES (E-mini and Micro E-mini S&P 500 Index Futures) charts by parsing text copied and pasted by the user.
(The levels displayed on the chart above are not valid, they are for illustration only)
Features
Option to display only the major levels
The chart on the left displays both major and minor levels, distinguished by color and line style. The chart on the right shows only the major levels; minor levels are disabled:
Alert function for when the price approaches a major level or zone (within a customizable distance).
The script provides a trigger for alerts. When creating an alert, you can then choose your desired frequency (Only once/Once per bar/Once per bar close/Once per minute) from the TradingView alert pop-up.
The alert message contains the current price and the approached major level price.
Customizable Lookback Period
Set how many days into the past the lines should appear (Subject to a maximum of 5000 bars).
To display lines for the current day only, set this value to 1.
Functions only on ES or MES (E-mini and Micro E-mini S&P 500 Index Futures) charts, as the text format is intended for these instruments.
How to Use
Copy and paste the support and resistance levels into the indicator's "Supports" and "Resistances" input fields.
Format Example:
For the "Supports" input: 6772-6770 (major), 6764 (major), 6757, 6751-54
For the "Resistances" input: 6799 (major), 6814, 6828-30, 6839-40 (major)
The indicator supports the display of zone levels in multiple formats
(e.g., 6235-45 and 6235-6245 and 6245-6235 are all valid).
For hundred- or thousand-point rollovers, please use only the full number format: 5995-6005.
The indicator includes an error-checking system to help you troubleshoot common setup issues.
An on-chart error label will be displayed on the chart if:
The chart instrument is not ES or MES.
The "Supports" and "Resistances" fields are both empty.
A data formatting error is detected (e.g., non-numeric characters, incomplete zones, etc.).
How It Works
For optimal resource efficiency and performance, the script executes all computationally intensive tasks only once, on the very first bar when the chart loads (if barstate.isfirst).
One-time Parsing: The parsing, splitting, and conversion of the text (string) formatted levels, which are provided in the settings, occurs only once.
Persistent Objects: The lines (line.new), fills (linefill.new), and price labels (label.new) that mark the levels are all persistent graphical objects. The script creates these on the first bar and stores their references in arrays declared with the var keyword.
No Redrawing: On subsequent bars, the indicator does not delete and redraw these objects. It merely updates the x-axis position of the existing lines and labels (line.set_x1, line.set_x2, label.set_x) on the last bar (if barstate.islast), ensuring they always remain on the right edge of the chart, following the formation of new bars.
By default, TradingView charts have a limit of 50 lines and 50 labels. Given that the number of levels often exceeds this, the script's drawing logic is as follows:
The number of displayable lines and labels has been increased (to 500) in the indicator's declaration line.
The script applies a prioritized order when drawing levels and labels. Major levels have priority over minor levels during drawing.
Disclaimer
This indicator is provided for educational and informational purposes only. It is not financial advice.
Trading involves substantial risk of loss and is not suitable for every investor. Past performance shown in examples is not indicative of future results.
The indicator provides signals and calculations, but trading decisions are solely your responsibility. Always:
Test strategies on paper before using real money
Never risk more than you can afford to lose
Understand that all trading involves risk
Consider seeking advice from a licensed financial advisor
The publisher makes no guarantees regarding accuracy, profitability, or performance. Use at your own risk.
Time-Decay Liquidity Zones [BackQuant]Time-Decay Liquidity Zones
A dynamic liquidity map that turns single-bar exhaustion events into fading, color-graded zones, so you can see where trapped traders and unfinished business still matter, and when those areas have finally stopped pulling price.
What this is
This indicator detects unusually strong impulsive moves into wicks, converts them into supply or demand “zones,” then lets those zones decay over time. Each zone carries a strength score that fades bar by bar. Zones that stop attracting or rejecting price are gradually de-emphasized and eventually removed, while the most relevant areas stay bright and obvious.
Instead of static rectangles that live forever, you get a living liquidity map where:
Zones are born from objective criteria: volatility, wick size, and optional volume spikes.
Zones “age” using a configurable decay factor and maximum lifetime.
Zone color and opacity reflect current relative strength on a unified clear → green → red gradient.
Zones freeze when broken, so you can distinguish “active reaction areas” from “historical levels that have already given way”.
Conceptual idea
Large wicks with strong volatility often mark areas where aggressive orders met hidden liquidity and got absorbed. Price may revisit these areas to test leftover interest or to relieve trapped positions. However, not every wick matters for long. As time passes and more bars print, the market “forgets” some areas.
Time-Decay Liquidity Zones turns that idea into a rule-based system:
Find bars that likely reflect strong aggressive flows into liquidity.
Mark a zone around the wick using ATR-based thickness.
Assign a strength score of 1.0 at birth.
Each bar, reduce that score by a decay factor and remove zones that fall below a threshold or live too long.
Color all surviving zones from weak to strong using a single gradient scale and a visual legend.
How events are detected
Detection lives in the Event Detection group. The script combines range, wick size, and optional volume filters into simple rules.
Volatility filter
ATR Length — computes a rolling ATR over your chosen window. This is the volatility baseline.
Min range in ATRs — bar range (High–Low) must exceed this multiple of ATR for an event to be considered. This avoids tiny bars triggering zones.
Wick filters
For each bar, the script splits the candle into body and wicks:
Upper wick = High minus the max(Open, Close).
Lower wick = min(Open, Close) minus Low.
Then it tests:
Upper wick condition — upper wick must be larger than Min wick size in ATRs × ATR.
Lower wick condition — lower wick must be larger than Min wick size in ATRs × ATR.
Only bars with a sufficiently long wick relative to volatility qualify as candidate “liquidity events”.
Volume filter
Optionally, the script requires a volume spike:
Use volume filter — if enabled, volume must exceed a rolling volume SMA by a configurable multiplier.
Volume SMA length — period for the volume average.
Volume spike multiplier — how many times above the SMA current volume needs to be.
This lets you focus only on “heavy” tests of liquidity and ignore quiet bars.
Event types
Putting it together:
Upper event (potential supply / long liquidation, etc.)
Occurs when:
Upper wick is large in ATR terms.
Full bar range is large in ATR terms.
Volume is above the spike threshold (if enabled).
Lower event (potential demand / short liquidation, etc.)
Symmetric conditions using the lower wick.
How zones are constructed
Zone geometry lives in Zone Geometry .
When an event is detected, the script builds a rectangular box that anchors to the wick and extends in the appropriate direction by an ATR-based thickness.
For upper (supply-type) zones
Bottom of the zone = event bar high.
Top of the zone = event bar high + Zone thickness in ATRs × ATR.
The zone initially spans only the event bar on the x-axis, but is extended to the right as new bars appear while the zone is active.
For lower (demand-type) zones
Top of the zone = event bar low.
Bottom of the zone = event bar low − Zone thickness in ATRs × ATR.
Same extension logic: box starts on the event bar and grows rightward while alive.
The result is a band around the wick that scales with volatility. On high-ATR charts, zones are thicker. On calm charts, they are narrower and more precise.
Zone lifecycle, decay, and removal
All lifecycle logic is controlled by the Decay & Lifetime group.
Each zone carries:
Score — a floating-point “importance” measure, starting at 1.0 when created.
Direction — +1 for upper zones, −1 for lower zones.
Birth index — bar index at creation time.
Active flag — whether the zone is still considered unbroken and extendable.
1) Active vs broken
Each confirmed bar, the script checks:
For an upper zone , the zone is counted as “broken” when the close moves above the top of the zone.
For a lower zone , the zone is counted as “broken” when the close moves below the bottom of the zone.
When a zone breaks:
Its right edge is frozen at the previous bar (no further extension).
The zone remains on the chart, but is no longer updated by price interaction. It still decays in score until removal.
This lets you see where a major level was overrun, while naturally fading its influence over time.
2) Time decay
At each confirmed bar:
Score := Score × Score decay per bar .
A decay value close to 1.0 means very slow decay and long-lived zones.
Lower values (closer to 0.9) mean faster forgetting and more current-focused zones.
You are controlling how quickly the market “forgets” past events.
3) Age and score-based removal
Zones are removed when either:
Age in bars exceeds Max bars a zone can live .
This is a hard lifetime cap.
Score falls below Minimum score before removal .
This trims zones that have decayed into irrelevance even if their age is still within bounds.
When a zone is removed, its box is deleted and all associated state is freed to keep performance and visuals clean.
Unified gradient and color logic
Color control lives in Gradient & Color . The indicator uses a single continuous gradient for all zones, above and below price, so you can read strength at a glance without guessing what palette means what.
Base colors
You set:
Mid strength color (green) — used for mid-level strength zones and as the “anchor” in the gradient.
High strength color (red) — used for the strongest zones.
Max opacity — the maximum visual opacity for the solid part of the gradient. Lower values here mean more solid; higher values mean more transparent.
The script then defines three internal points:
Clear end — same as mid color, but with a high alpha (close to transparent).
Mid end — mid color at the strongest allowed opacity.
High end — high color at the strongest allowed opacity.
Strength normalization
Within each update:
The script finds the maximum score among all existing zones.
Each zone’s strength is computed as its score divided by this maximum.
Strength is clamped into .
This means a zone with strength 1.0 is currently the strongest zone on the chart. Other zones are colored relative to that.
Piecewise gradient
Color is assigned in two stages:
For strength between 0.0 and 0.5: interpolate from “clear” green to solid green.
Weak zones are barely visible, mid-strength zones appear as solid green.
For strength between 0.5 and 1.0: interpolate from solid green to solid red.
The strongest zones shift toward the red anchor, clearly separating them from everything else.
Strength scale legend
To make the gradient readable, the indicator draws a vertical legend on the right side of the chart:
About 15 cells from top (Strong) to bottom (Weak).
Each cell uses the same gradient function as the zones themselves.
Top cell is labeled “Strong”; bottom cell is labeled “Weak”.
This legend acts as a fixed reference so you can instantly map a zone’s color to its approximate strength rank.
What it plots
At a glance, the indicator produces:
Upper liquidity zones above price, built from large upper wick events.
Lower liquidity zones below price, built from large lower wick events.
All zones colored by relative strength using the same gradient.
Zones that freeze when price breaks them, then fade out via decay and removal.
A strength scale legend on the right to interpret the gradient.
There are no extra lines, labels, or clutter. The focus is the evolving structure of liquidity zones and their visual strength.
How to read the zones
Bright red / bright green zones
These are your current “major” liquidity areas. They have high scores relative to other zones and have not yet decayed. Expect meaningful reactions, absorption attempts, or spillover moves when price interacts with them.
Faded zones
Pale, nearly transparent zones are either old, decayed, or minor. They can still matter, but priority is lower. If these are in the middle of a long consolidation, they often become background noise.
Broken but still visible zones
Zones whose extension has stopped have been overrun by closing price. They show where a key level gave way. You can use them as context for regime shifts or failed attempts.
Absence of zones
A chart with few or no zones means that, under your current thresholds, there have not been strong enough liquidity events recently. Either tighten the filters or accept that recent price action has been relatively balanced.
Use cases
1) Intraday liquidity hunting
Run the indicator on lower timeframes (e.g., 1–15 minute) with moderately fast decay.
Use the upper zones as potential sell reaction areas, the lower zones as potential buy reaction areas.
Combine with order flow, CVD, or footprint tools to see whether price is absorbing or rejecting at each zone.
2) Swing trading context
Increase ATR length and range/wick multipliers to focus only on major spikes.
Set slower decay and higher max lifetime so zones persist across multiple sessions.
Use these zones as swing inflection areas for larger setups, for example anticipating re-tests after breakouts.
3) Stop placement and invalidation
For longs, place invalidation beyond a decaying lower zone rather than in the middle of noise.
For shorts, place invalidation beyond strong upper zones.
If price closes through a strong zone and it freezes, treat that as additional evidence your prior bias may be wrong.
4) Identifying trapped flows
Upper zones formed after violent spikes up that quickly fail can mark trapped longs.
Lower zones formed after violent spikes down that quickly reverse can mark trapped shorts.
Watching how price behaves on the next touch of those zones can hint at whether those participants are being rescued or squeezed.
Settings overview
Event Detection
Use volume filter — enable or disable the volume spike requirement.
Volume SMA length — rolling window for average volume.
Volume spike multiplier — how aggressive the volume spike filter is.
ATR length — period for ATR, used in all size comparisons.
Min wick size in ATRs — minimum wick size threshold.
Min range in ATRs — minimum bar range threshold.
Zone Geometry
Zone thickness in ATRs — vertical size of each liquidity zone, scaled by ATR.
Decay & Lifetime
Score decay per bar — multiplicative decay factor for each zone score per bar.
Max bars a zone can live — hard cap on lifetime.
Minimum score before removal — score cut-off at which zones are deleted.
Gradient & Color
Mid strength color (green) — base color for mid-level zones and the lower half of the gradient.
High strength color (red) — target color for the strongest zones.
Max opacity — controls the most solid end of the gradient (0 = fully solid, 100 = fully invisible).
Tuning guidance
Fast, session-only liquidity
Shorter ATR length (e.g., 20–50).
Higher wick and range multipliers to focus only on extreme events.
Decay per bar closer to 0.95–0.98 and moderate max lifetime.
Volume filter enabled with a decent multiplier (e.g., 1.5–2.0).
Slow, structural zones
Longer ATR length (e.g., 100+).
Moderate wick and range thresholds.
Decay per bar very close to 1.0 for slow fading.
Higher max lifetime and slightly higher min score threshold so only very weak zones disappear.
Noisy, high-volatility instruments
Increase wick and range ATR multipliers to avoid over-triggering.
Consider enabling the volume filter with stronger settings.
Keep decay moderate to avoid the chart getting overloaded with old zones.
Notes
This is a structural and contextual tool, not a complete trading system. It does not account for transaction costs, execution slippage, or your specific strategy rules. Use it to:
Highlight where liquidity has recently been tested hard.
Rank these areas by decaying strength.
Guide your attention when layering in separate entry signals, risk management, and higher-timeframe context.
Time-Decay Liquidity Zones is designed to keep your chart focused on where the market has most recently “cared” about price, and to gradually forget what no longer matters. Adjust the detection, geometry, decay, and gradient to fit your product and timeframe, and let the zones show you which parts of the tape still have unfinished business.

Important Cracked Levels This indicator shows you all the levels from the previous day and the premarket. This is all you really need

Level LinesThis indicator displays levels in close proximity to the current price, enabling users to identify psychological levels on charts that serve as support/resistance zones or key reference points for price action.
In the settings, you can customize the number of lines shown above and below the current price, along with the interval size for rendering them.
As the price moves higher or lower, the lines dynamically adjust to reflect the most relevant levels.
In settings you can fully customize the style of lines (color, width, style) with separate settings available for lines above & below the current price.

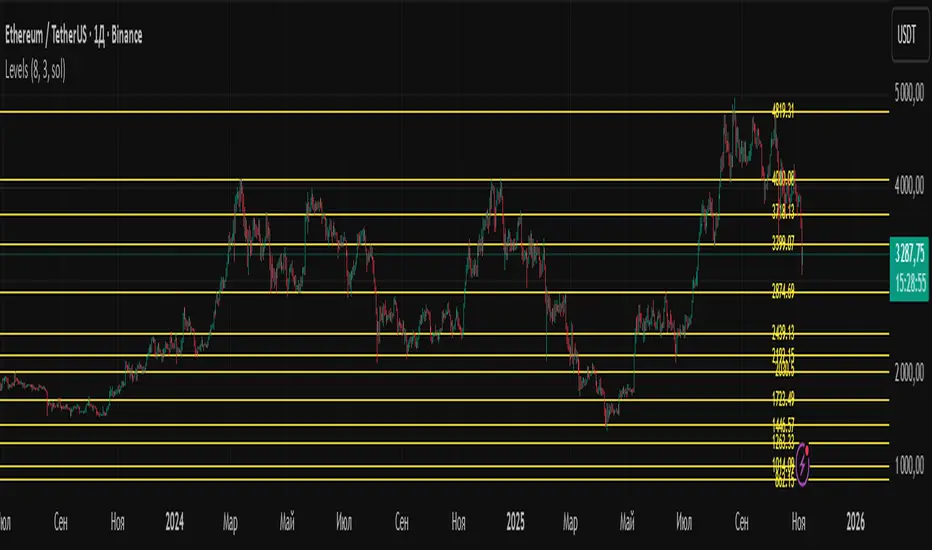
LevelsLevels is a powerful technical analysis tool that automatically identifies and displays key support and resistance levels on the chart. The indicator analyzes historical price data, detecting significant price levels where multiple reversals or price stops have occurred.
How the Indicator Works?
1. Identification of Reversal Points:
- The indicator tracks price extremes using an algorithm to identify local highs and lows
- A reversal point is recorded when:
- Uptrend: price reaches a new low for the last 10 bars
- Downtrend: price reaches a new high for the last 10 bars
2. Level Grouping:
- All found reversal points are analyzed and grouped into key levels
- Levels are combined if they fall within the specified percentage tolerance
3. Filtering Significant Levels:
- Only levels that have been tested the minimum number of times (set in settings) are preserved
- This ensures only statistically significant levels are displayed
How to Use the Indicator?
Trading Scenarios:
1. Bounce from Level:
- When price approaches an identified level, a bounce can be expected
- Opening positions on the bounce with protective stop-loss beyond the level
2. Level Breakout:
- Breaking through a key level may signal trend continuation
- Support level becomes resistance and vice versa
3. Consolidation near Level:
- Prolonged price presence near a level indicates its significance
- Strong movement can be expected after exiting consolidation
Advantages:
- Automatic level identification eliminates subjectivity
- Sensitivity customization for different timeframes and instruments
- Visual simplicity - only significant levels
Indicator Settings
Main Parameters:
- Show Key Levels - enable/disable level display
- Level Tolerance (%) - percentage tolerance for level grouping
- Smaller values: more levels, more precise
- Larger values: fewer levels, more significant
- Minimum Touches - minimum number of touches to form a level
Visual Settings:
- Level Color - level display color
- Level Style - line style (solid, dashed, dotted)
Limitations
- Levels are built only on available historical data
- Does not account for trading volumes
- Parameter adjustment may be required during high volatility periods
The indicator is particularly effective when combined with other analysis tools for signal confirmation.
R Dominant Range [CRT] by Sergi SernaR Dominant Range identifies the most influential R range located to the left of the current price action. It highlights the dominant zone that still impacts market behavior, helping traders understand which range is controlling the current structure.

AG Pro Dynamic ChannelsAG Pro Dynamic Channels V2
Discover a new lens through which to view market structure with the AG Pro Dynamic Channels V2. This advanced indicator moves beyond simple trendlines, automatically identifying, classifying, and drawing eight distinct types of support and resistance channels directly on your chart.
Built on a sophisticated pivot-point detection engine, this script intelligently distinguishes between Major and Minor price structures, as well as Internal and External channels. This provides a comprehensive and multi-dimensional map of the market's flow, helping you identify trend continuations, corrections, and potential reversals.
The indicator is complete with a powerful, fully customizable alert system designed to notify you of the two most critical events: channel breakouts and price reactions.
Key Features
Fully Automatic Channels: The script automatically analyzes price action to find pivot highs and lows, using them to construct relevant channels without any manual drawing required.
8-Channel Classification: Gain deep market insight by viewing eight distinct channel types:
Major External (Up/Down)
Major Internal (Up/Down)
Minor External (Up/Down)
Minor Internal (Up/Down)
Advanced Pivot Engine: The core logic classifies pivots into categories like Higher Highs (MHH/mHH), Lower Lows (MLL/mLL), Higher Lows (MHL/mHL), and Lower Highs (MLH/mLH) to determine the precise start and end points for each channel.
Deep Customization: Take full control of your chart's appearance. You can individually toggle the visibility, color, line style (solid, dashed, dotted), and line width for all eight channel types.
Chart Clarity: A "Delete Previous" option is available for each channel type, allowing you to keep your chart clean and focused on only the most current and relevant market structures.
Comprehensive Alert System
Never miss a key price interaction. The AG Pro Dynamic Channels V2 features a robust, built-in alert module.
Dual-Alert Conditions: Get notifications for two distinct events:
Break Alert: Triggers when price confirms a close outside of a channel, signaling a potential breakout.
React Alert: Triggers when price touches or interacts with a channel line before closing back inside, signaling a test or rejection.
16 Unique Alerts: You have full control to enable or disable "Break" and "React" alerts for all 8 channel types individually, giving you 16 unique alert conditions to monitor.
Professional Alert Messages: The embedded alert sender provides detailed messages that include the asset, timeframe, and the specific event, such as "Break Major External Up Channel" or "React Minor Internal Down Channel".
Alert Configuration: Easily set your global Alert Name, Message Frequency (e.g., Once Per Bar, Once Per Bar Close), and Alert Time Zone from the script's settings.
How to Use
Trend Identification: Use the Major External Channels (drawn from MHH and MLL pivots) to identify the primary, long-term trend direction.
Pullback & Entry Zones: Use the Internal Channels (drawn from MHL and MLH pivots) to spot corrections and potential entry zones within an established trend.
Breakout Trading: Set Break Alerts on Major channels to be notified of significant, structure-shifting moves.
Short-Term & Counter-Trend: Utilize the Minor Channels to identify shorter-term price swings and potential reversal points.

Previous D/W/M HLOCHey traders,
Here's a simple Multi-Timeframe indicator that essentially turns time and price into a box. It'll take the previous high, low, opening price, or closing price from one of the three timeframes of your choice (day, week, or month). For whatever reason I can't get the opening price to function consistently so if you find improvements feel free to let me know, this will help traders who prefer to use opening price over closing price.
Naturally this form of charting is classical and nature and some key figures you could use to study its usage are
- Richard W. Schabacker (1930s)
- Edwards & Magee (1948)
- Peter Brandt
- Stacey Burke (more on the intraday side - typically our preference)
It's usage put plainly:
- Quantifying Accumulation or Distribution
- Revealing Energy Build-Up (Compression)
- Framing Breakouts and False Breakouts
- Structuring Time
- Identifying opportunities to trade a daily, weekly, or monthly range.

[Kpt-Ahab] Assistant: Risk & DCA PlannerScript Description – Assistant: Risk & DCA Planner
The Risk & DCA Planner is a technical assistant for position and risk management.
It automatically calculates, based on volatility (ATR%), swing structure, and your settings:
Stop-Loss (SL) and corresponding Take-Profit targets (TPs) in R-multiples
DCA (Dollar-Cost-Averaging) levels — both price and amount
A market suitability check (based on volatility & volume)
Plus a clear table and summary label displayed on the chart
The script helps you plan risk, scaling, and profit targets consistently and quantitatively.
Core Logic
Risk Profile
Three modes: Low, Normal, High.
These define how reactive the script behaves internally:
Low → conservative, longer lookbacks, tighter analysis
Normal → balanced
High → aggressive, faster reaction, wider stops
Stop-Loss (SL)
Automatically calculated from ATR% and recent swing structure, limited by minimum and maximum thresholds.
The SL percentage defines the R-unit, which all TPs and DCA levels are based on.
Take-Profits (TPs)
Up to six targets, each a multiple of the defined risk (e.g., 1R, 2R, 3R).
Prices are automatically adjusted depending on long or short direction.
DCA Strategy
Optional. Adds scaling levels evenly between Entry and SL or in multiples of the ATR.
Each DCA allocation grows geometrically until the maximum position size is reached.
Suitability Check
Evaluates whether the market is within an appropriate ATR% range and has sufficient volume.
The table displays “OK” or “Caution” depending on volatility and historical consistency.
Visualization
Lines for SL, TPs, and DCA levels
A table with all parameters, prices, and risk data
A chart label summarizing key info (profile, direction, SL%, TPs, DCA, etc.)

Levels[cz]Description
Levels is a proportional price grid indicator that draws adaptive horizontal levels based on higher timeframe (HTF) closes.
Instead of relying on swing highs/lows or pivots, it builds structured support and resistance zones using fixed percentage increments from a Daily, Weekly, or Monthly reference close.
This creates a consistent geometric framework that helps traders visualize price zones where reactions or consolidations often occur.
How It Works
The script retrieves the last HTF close (Daily/Weekly/Monthly).
It then calculates percentage-based increments (e.g., 0.5%, 1%, 2%, 4%) above and below that reference.
Each percentage forms a distinct “level group,” creating layered grids of potential reaction zones.
Levels are automatically filtered to avoid overlap between different groups, keeping the chart clean.
Visibility is dynamically controlled by timeframe:
Level 1 → up to 15m
Level 2 → up to 1h
Level 3 → up to 4h
Level 4 → up to 1D
This ensures the right amount of structural detail at every zoom level.
How to Use
Identify confluence zones where multiple levels cluster — often areas of strong liquidity or reversals.
Use the grid as a support/resistance map for entries, targets, and stop placement.
Combine with trend or momentum indicators to validate reactions at key price bands.
Adjust the percentage increments and reference timeframe to match the volatility of your instrument (e.g., smaller steps for crypto, larger for indices).
Concept
The indicator is based on the idea that markets move in proportional price steps, not random fluctuations.
By anchoring levels to a higher-timeframe close and expanding outward geometrically, Levels highlights recurring equilibrium and expansion zones — areas where traders can anticipate probable turning points or consolidations.
Features
4 customizable percentage-based level sets
Dynamic visibility by timeframe
Non-overlapping level hierarchy
Lightweight on performance
Fully customizable colors, styles, and widths
