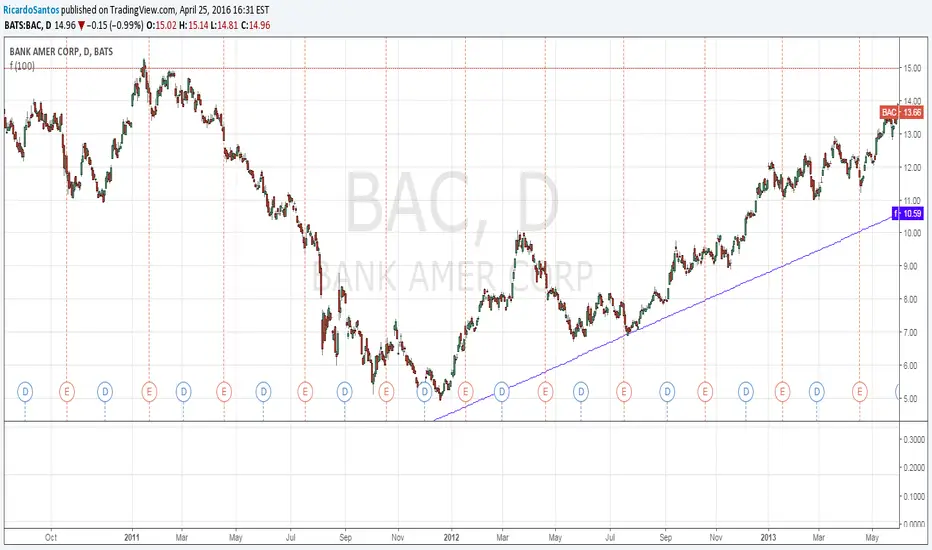
Pivot Points Monthly & YearlyMonthly and Yearly only
What is a Pivot Point?
A pivot point is a technical analysis indicator, or calculations, used to determine the overall trend of the market over different time frames. The pivot point itself is simply the average of the high, low and closing prices from the previous trading day. On the subsequent day, trading above the pivot point is thought to indicate ongoing bullish sentiment, while trading below the pivot point indicates bearish sentiment.
The pivot point is the basis for the indicator, but it also includes other support and resistance levels that are projected based on the pivot point calculation. All these levels help traders see where the price could experience support or resistance. Similarly, if the price moves through these levels it lets the trader know the price is trending in that direction.
When the price of an asset is trading above the pivot point, it indicates the day is bullish or positive.
When the price of an asset is trading below the pivot point, it indicates the day is bearish or negative.
The indicator typically includes four additional levels: S1, S2, R1, and R2. These stand for support one and two, and resistance one and two.
Support and resistance one and two may cause reversals, but they may also be used to confirm the trend. For example, if the price is falling and moves below S1, it helps confirm the downtrend and indicate a possible continuation to S2.
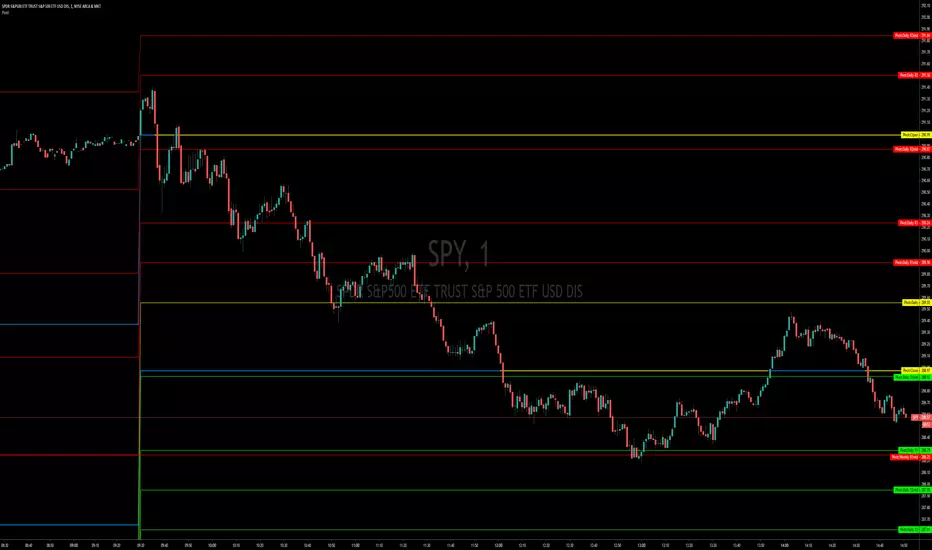
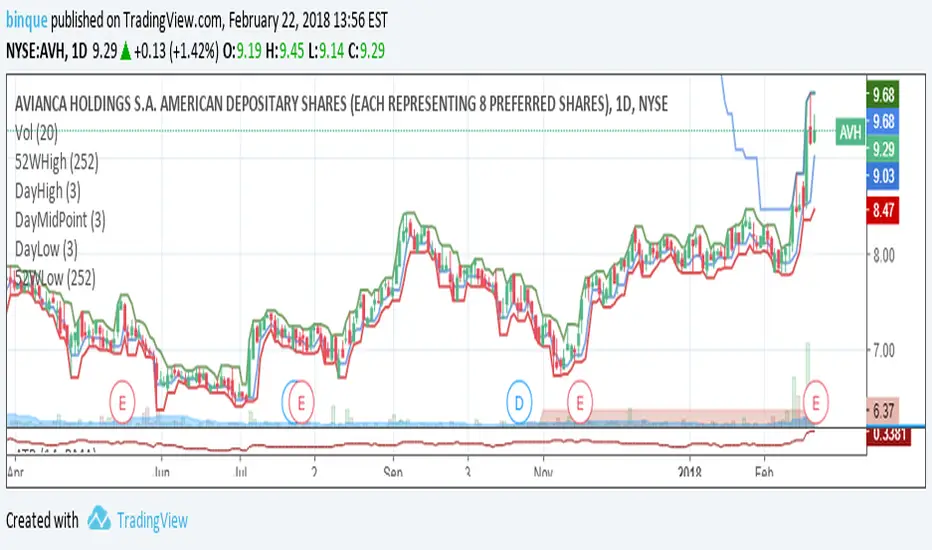
This Script includes the Mid Pivot Points, Open and Close levels
LINE
Pivot Points, Daily, Weekly, Open and Close lines What is a Pivot Point?
A pivot point is a technical analysis indicator, or calculations, used to determine the overall trend of the market over different time frames. The pivot point itself is simply the average of the high, low and closing prices from the previous trading day. On the subsequent day, trading above the pivot point is thought to indicate ongoing bullish sentiment, while trading below the pivot point indicates bearish sentiment.
The pivot point is the basis for the indicator, but it also includes other support and resistance levels that are projected based on the pivot point calculation. All these levels help traders see where the price could experience support or resistance. Similarly, if the price moves through these levels it lets the trader know the price is trending in that direction.
When the price of an asset is trading above the pivot point, it indicates the day is bullish or positive.
When the price of an asset is trading below the pivot point, it indicates the day is bearish or negative.
The indicator typically includes four additional levels: S1, S2, R1, and R2. These stand for support one and two, and resistance one and two.
Support and resistance one and two may cause reversals, but they may also be used to confirm the trend. For example, if the price is falling and moves below S1, it helps confirm the downtrend and indicate a possible continuation to S2.
This Script includes the Mid Pivot Points, Open and Close levels
CL Kijun Support Resistance LinesExperimental support / resistance lines inspired by the ichimoku indicator.

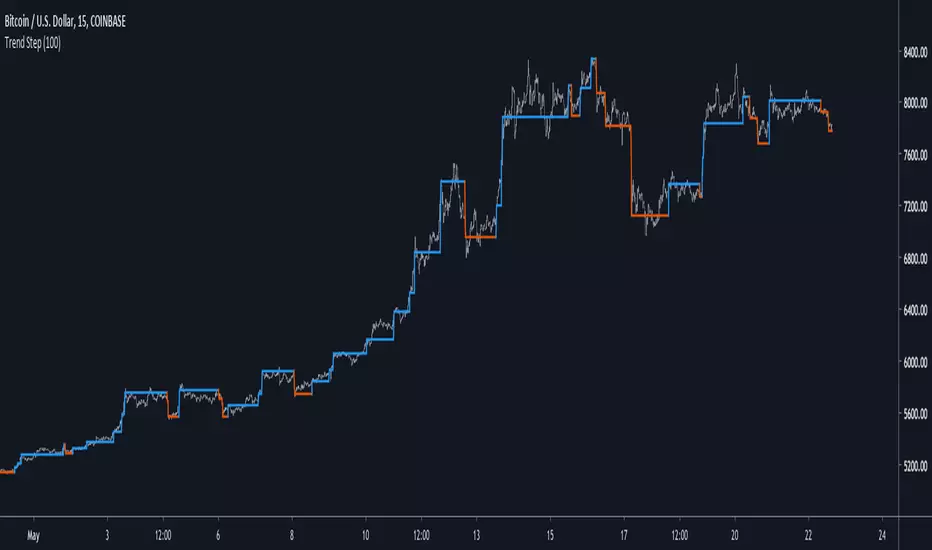
Trend StepJust a modification of my old auto-line script, lot of errors fixed and a correction in the standard deviation. Also changed the tittle because "auto-line" was really confusing.
Tower Line IndicatorHere is the code of twr indicator
I'v already posted a idea about this indicator. You guys can make this chart more complete if you want.
Complete indicator is just fixed the color align in some price pattern.
The rule is hard to write for me but we have simple version here. :)
Read more about tower line:
Tower line here
Need help about tower line(To add the color align when price expand or other situation)
Detail about tower line
Have you heard about tower line
[RESEARCH] Dashed Line StyleA simple as ass concept that uses modular arithmetic to plot dashed line.

Simple LinesIntroduction
Making lines is great in technical analysis since it can highlights principal movements and make the analysis of the price easier when using certain methodologies (Elliott Waves, patterns).
However most of the indicators making lines (Zig-Zag, simple linear regression) are non causal (repaint), this is the challenge i tried to overcome, making an indicator capable of making lines in a smart way (able to follow price without loosing a linear approach) and with the least lag possible, i inspired myself from the behaviour of the renko when using a small brick size. This indicator does not repaint .
The code is short and i hope, understandable for all of you, making lines is not a difficult task and its important to know that when a problem appear complex it does not mean that the code used to solve this problem must be complex. Lets see the indicator in details.
The indicator
The indicator have 4 parameters, the length parameter who control the length of lines, the emphasis parameter who control the stability and also the ability to make lines closer to the price (thus minimizing the sum of squares) , the mult parameter which is similar to emphasis and a point option that we will discuss later.
When emphasis and mult are both equal to 1 the indicator will sometimes draw a perfect line, however this line will try to follow the price and thus can create a noisy result.
This is where emphasis and mult will correct this behaviour. The emphasis parameter give a more periodic look as well as some control to the lines but can also destroy them.
This should not happen with mult , this parameter also give more predictability to the lines. Overall it correct the drawbacks of the parameters combinations mentioned earlier.
Its also possible to mix both the emphasis and mult parameter, but take into account that when both are equals the result consist of less reactive lengthy lines with low accuracy. Its better to only use one of them and let the other stay to 1.
Point Option
The indicator can sometimes have a weird look, appearing almost flat or just dont appearing at all. When such thing happen use the point option.
XPDUSD without point option.
with point option :
Time Frame Problem and Its Fix
When using higher time-frames the result of the indicator can appear different, in general the higher the time frame the lengthier are the lines. In order to fix this you can use decimals in the length parameter
length and mult both equal to 5.5, emphasis cant use decimals.
Conclusion
I have highlighted a simple way to make use of the small renko box size method in order to return reactive lines without making the indicator repaint. However Its ability to be close to the price as well as being always super reactive is not a guarantee.
For any suggestion/help feel free to pm me, i would be happy to help you :)

Efficient Auto LineMore Efficiency
Based on the Auto-Line code, the Efficient Auto Line aim to provide a more controlled adaptivity of the indicator. The first indicator of this sort worked this way : when the absolute difference between the price and the indicator is higher than the previous indicator +/- A pips of amplitude, the indicator will display the closing price, else its anterior value. The second indicator (Auto-Line) was adaptive and used the standard deviation instead of a constant A . This indicator will run both methodology providing both a trend strength indicator (Efficiency Ratio) parameter and two constant parameter.
Parameters
The length parameter will control the period of the efficiency ratio, a high period return lower values of the efficiency ratio. Since its an indicator in a range of (0,1) we use it to make our indicator more adaptive in trending market, this is when we need our two constant parameters, the fast/slow parameter can be any amount of pips where fast < slow , when the price is trending (efficiency ratio close to 1) the indicator will use the fast parameter, if its ranging (efficiency ratio away from 1) the indicator will use the slow parameter, then it will work like the first methodology previously explained. So the fast parameter should be equal to a small movement of pips (0.0001 or 1 pip) and the slow parameter should be equal to a number of pips you wont expect to see in a ranging market. At this point it is good to test for both parameter and see which values work better (a more automatic process is in development) .
Hope you like it !

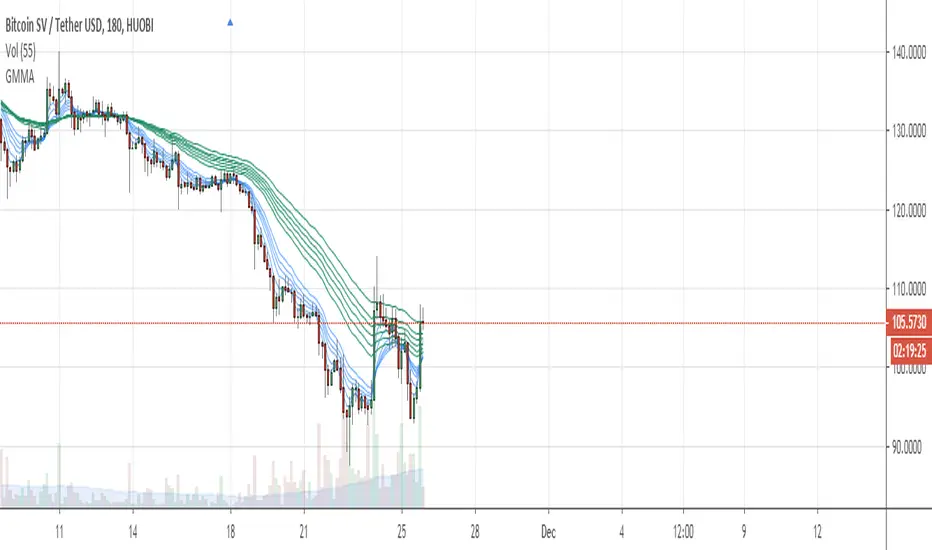
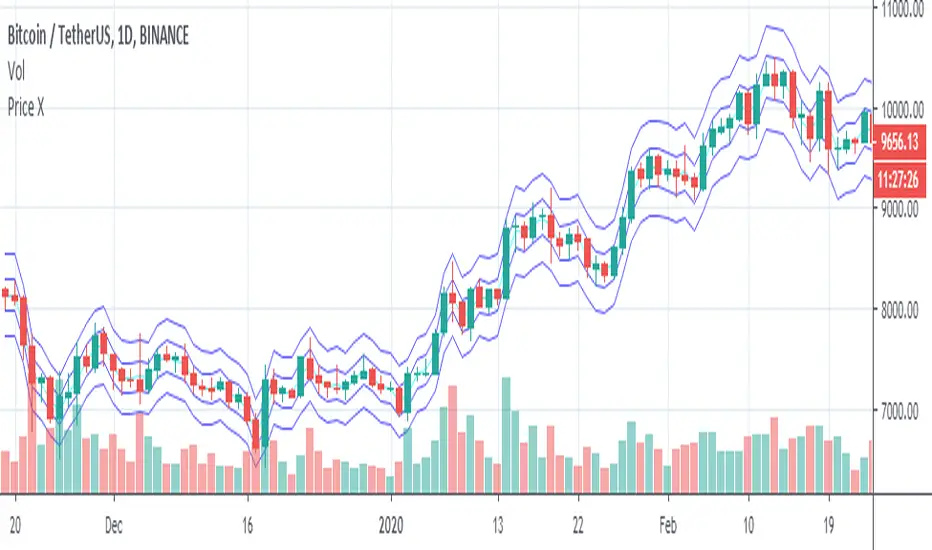
Priceit plots
ema - you can choose length
it plots a custom price say x
it plots price x*factors >
1.0005* price
1.001* price
0.9995* price
0.999* price
1.002* price
1.004* price
1.006* price
1.008* price
1.010* price
1.012* price
you can edit these , the scrip is open source
it plots ohlc4 and ohlc4* factors
1.0005* ohlc4
1.001* ohlc4
0.9995* ohlc4
0.999* ohlc4
you can edit these , the scrip is open source
line plotline plot any of the following or any combination of them together:
high, low, open, close, hl2, ohlc4

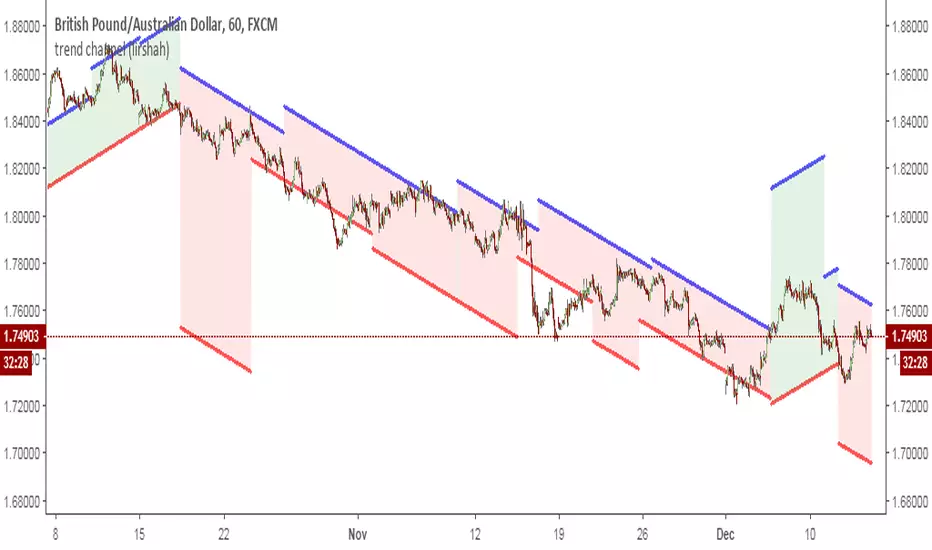
trend channel (lirshah)this indicator shows the trend lines and the channel which price fluctuate within, according to highest and lowest prices (historical data)
every line is calculated according to present bar and no repaint occurs.
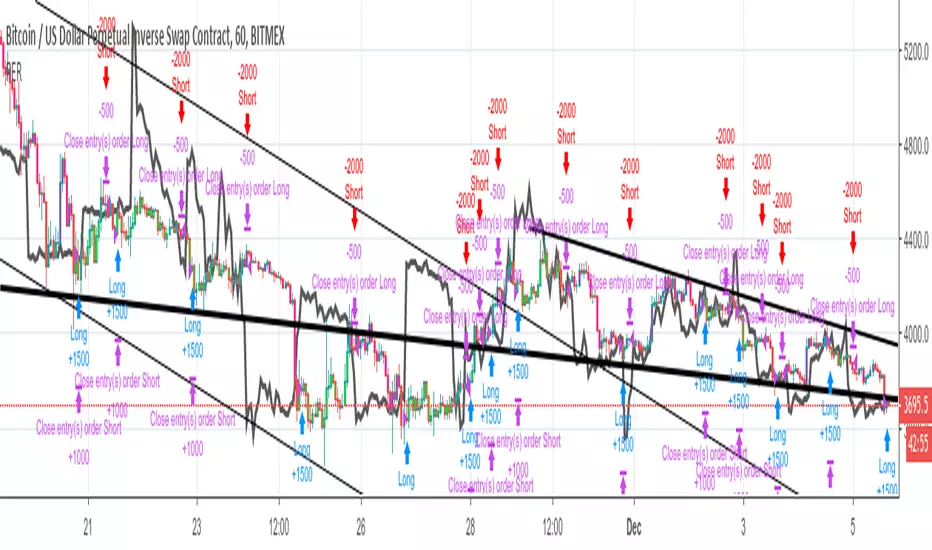
Relative Estimated Price KivanÇ version (Strategy) By Wicksell Thanks to the great work of KIVANÇ in the Relative Estimated Price REP by KIVANÇ fr3762, it has adapted modifications in the Lookback bar length, transformed into strategy, where a line determines a relative average price of XBTUSD, BTCUSD, ETHUSD and BCH.
the line is a calculation, where it involves reading previous candles where it determines what the current price should be.
When the REP line is above the candle, open buy and close sell, when it is below, open sell and close buy.
When setting which currency, do not forget to change the settings where they are:
1 - XBTUSD
2 - BTCUSD
3 - ETHUSD
4 - BCHBTC
may also be modified:
the Lookback bar length, stop loss settings, test date.
The best results are in the 1H time, with the default settings, but try to modify the data and if you find better results, I would be grateful if you post here.
Auto-Line With DriftA variation on the Auto-Line indicator, we allow it to get closer to the price thanks to a drift , this also allow the line to be more directional .
This indicator can be used with moving averages using crosses as signals or as a band indicator by ploting a + dev as the upper band and a - dev as the lower one.
For any help or suggestions feel free to send a message :)

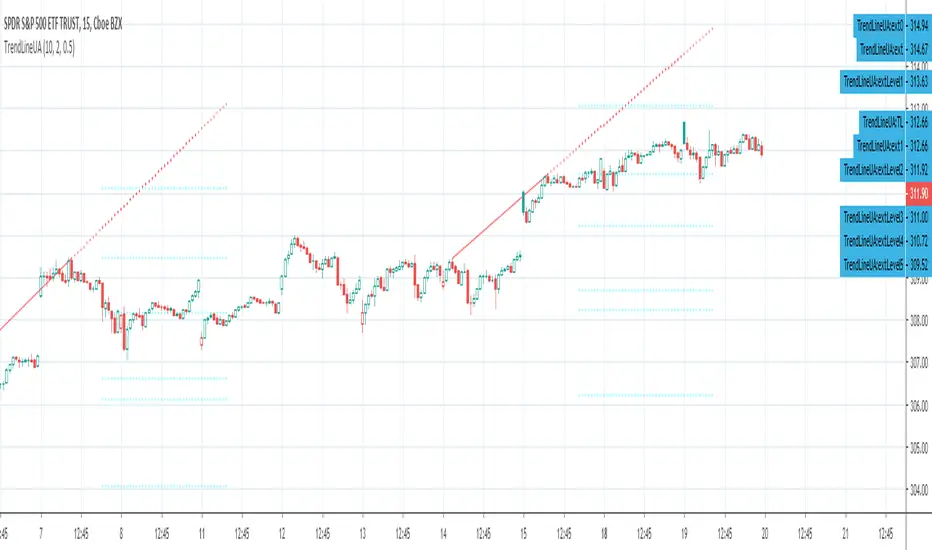
Auto Trendline, uptrend ascending Trend lineThis is a customized Tradingview indicator will automatically plots ascending trend lines which formed by two adjacent swing highs. It will also draw 5 extended resistance and support levels after the trend line detected.
Please contact me for purchase info.
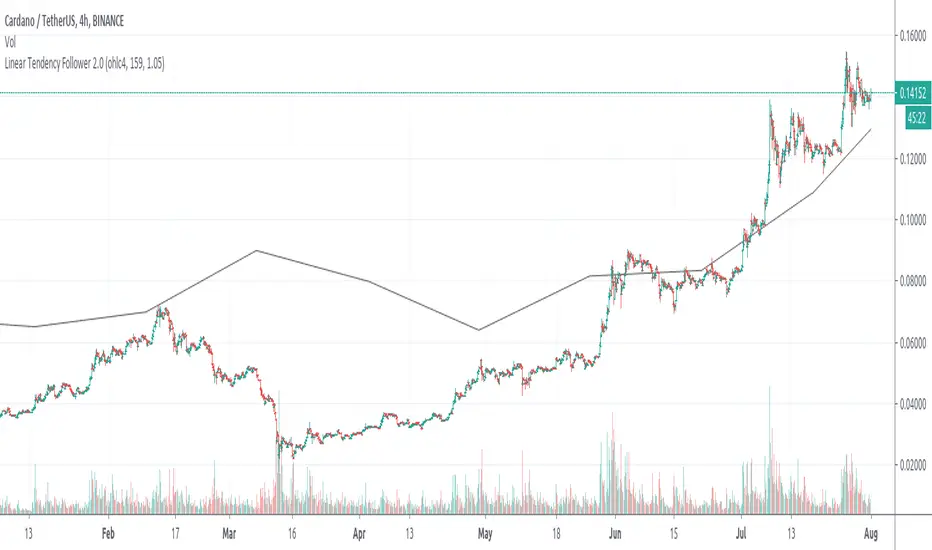
Linear Tendency FollowerLinear Trend Follower follows 'source' trend using lines within a number of periods ('length') using the last n periods source variation divided by 'length' as line slope. It is delayed by 'length' periods.
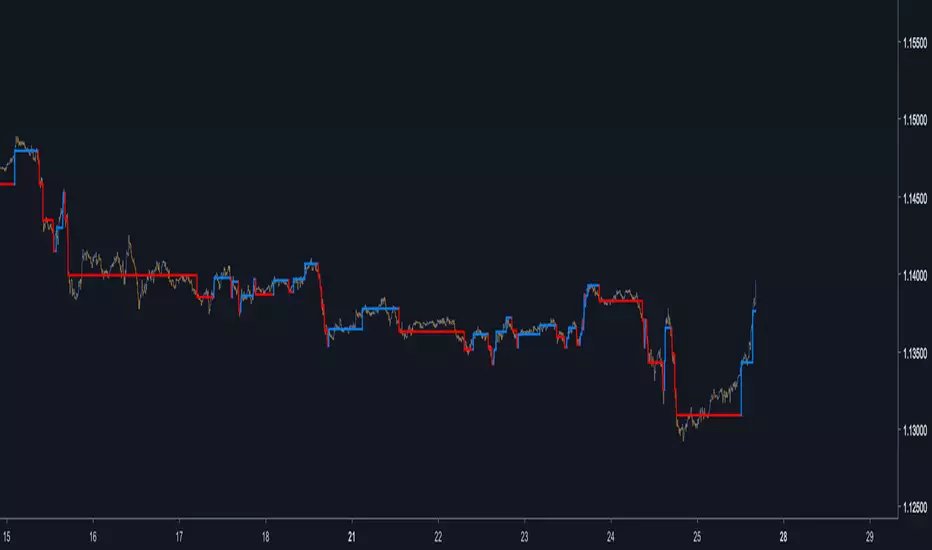
Auto-LineAn indicator inspired by the Renko chart.Instead of using a static box size we use standard deviation, this make the indicator more reactive to the market state.
If the indicator show no values then you have to round the price to the nearest integer, for that use the round parameter.
Hope you enjoy :)
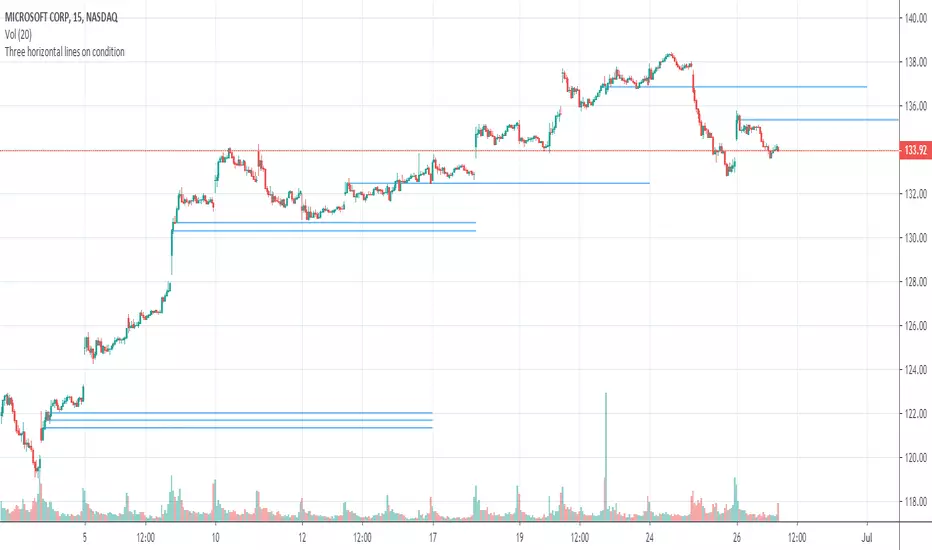
draw line at bar on condition, up to 40 bars in lengthDraws line at bar on condition, up to 40 bars in length.
Well, that's not a line, but a set of `—` characters. But it looks like a line, so it is line.
52WLow - 52 Week Low 52WLow - Plot the moving 52week low of the stocks daily price. Great for giving warning when a stock is close or about to break down to a new low. Best is used with a light red shading below line.
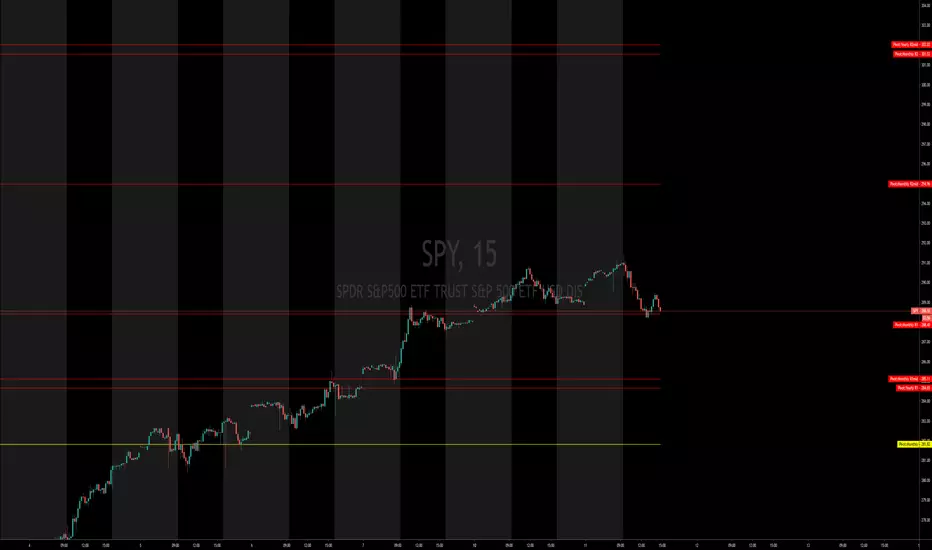
Daily Deviations (Self Input Version)
Plots the standard deviation resistance/support levels.
Input the previous settlement price and the implied volatility.
credit to u/UberBotMan and u/Living_Granger for the idea and formulas
(preview example is using settlement of 2420 and IV of 11)

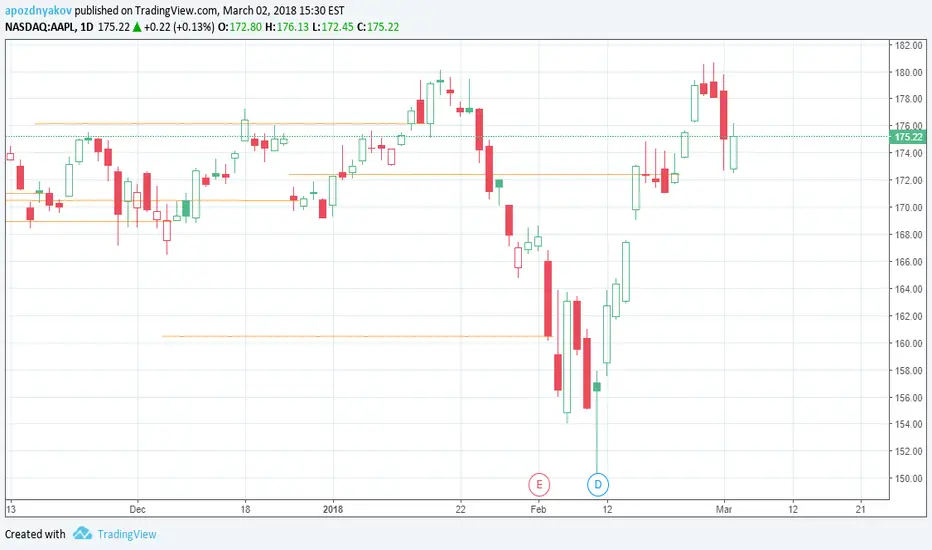
Auto Trendline, Upper Descending Trend line detector with alertThis is a custom Tradingview indicator that automatically plots descending trend lines above price bars. It will alert when the price closes above the trend line.
The concept is straightforward: the trend line is formed by two adjacent peaks when the price is in a downtrend. It will save a lot of time for people (just like me) who uses trendline often.
By deploying this indicator, should the condition meet, you don't need to draw the trend lines by hand anymore. You can also consider it as a trend line reminder.
It's also very easy to use, just load it on chart and set your desired inputs.
Features:
Adjust the strength of the 2 peaks that form the trend line.
Set price difference between two peaks in two variables: amount or percentage.
Turn on/off the cross above alert.
It works on all symbols and all timeframes.
never paint
A detailed instruction will show you how to properly adjust each input.

Open/Close Vertical Line by WiscoDishOpen and close lines. I used a 4 minute timeframe, so the open price goes on 08:28-08:32 central time for the 8:30 open. You can change those times if you want, just copy/paste the script and edit.

Function 2 Point Line using UNIX TIMESTAMP V1experimental:
draws a line from 2 vectors(price, time)
update:
reformatted the function,
added automatic detection of the period multiplier by approximation(gets a bit goofy with stocks/week time),
example using timestamp() function.
offsetting is still bugged, i cant find a way around it atm.