Solana 4H RSI->MACD — Counter-Trend By TetradTetrad RSI→RSI Cross→MACD (Sequenced) — Counter-Trend (SL-Only)
Category: Market-neutral, counter-trend, sequenced entries
Timeframe default: Works on any TF; designed around 4H On Solana
Markets: Any (spot, perp, futures); parameterize to your asset
What it does
This strategy hunts reversals using a 3-step sequence on RSI and MACD, then optionally restricts entries by market regime and a price gate. It shows stop-loss lines only when hit (clean chart), and paints a Donchian glow for quick read of backdrop conditions.
Entry logic (sequenced)
1. RSI Extreme:
Long path activates when RSI < Oversold (default 27.5).
Short path activates when RSI > Overbought (default 74).
2. RSI Cross confirmation:
Long path: RSI crosses up back above the oversold level.
Short path: RSI crosses down back below the overbought level.
Each step has a max bar lookback so stale signals time out.
3. MACD Cross trigger:
Long: MACD line crosses above Signal.
Short: MACD line crosses below Signal.
→ When step 3 fires and gates are satisfied, a trade is entered.
Optional gates & filters
Regime Filter (Counter-Trend):
Longs allowed in **Range / Short Trend / Short Parabolic** regimes.
Shorts allowed in **Range / Long Trend / Long Parabolic** regimes.
Based on ADX/DI and ATR% intensity.
* Price Gate (Long Ceiling):
Toggle to **disable new longs above a chosen price (default 209.0 For SOL).
Useful for assets like SOL where you want longs only below a cap.
Exits / Risk
* Stop-Loss (% of entry):** default **14%**, toggleable.
* SL visualization:** plots a **thin dashed red line only on the bar it’s hit**.
* (No take-profit or time-based exit in this version—keep it pure to the sequence and regime. Add TP/time exits if desired.)
Visuals
* Donchian Glow (50): background band only (upper/lower lines hidden).
* Regime HUD: compact table (top-right) highlighting the active regime.
* Minimal marks: no entry/exit “arms” clutter; only SL-hit lines render.
Inputs (key)
* Core: RSI Length, Oversold/Overbought, MACD Fast/Slow/Signal.
* Sequence: Max bars from Extreme→RSI Cross and RSI Cross→MACD Cross.
* Regime: ADX Length, Trend/Parabolic thresholds, ATR length & floor.
* Stops: Enable/disable; SL %.
* Price Gate: Enable; Long ceiling price.
Alerts
Sequenced Long (CT): RSIhigh → RSI cross down → MACD bear cross.
## Notes & Tips
Designed for counter-trend fades that become trend rides. The regime filter helps avoid fading true parabolics and aligns entries with safer contexts.
The sequence is stateful (steps must occur in order). If a step times out, the path resets.
Works on lower TFs, but the 4H baseline reduces noise and over-trading.
Consider pairing with volume or structure filters if you want fewer but higher-conviction entries.
Past performance ≠ future results. **Educational use only. Not financial advice.
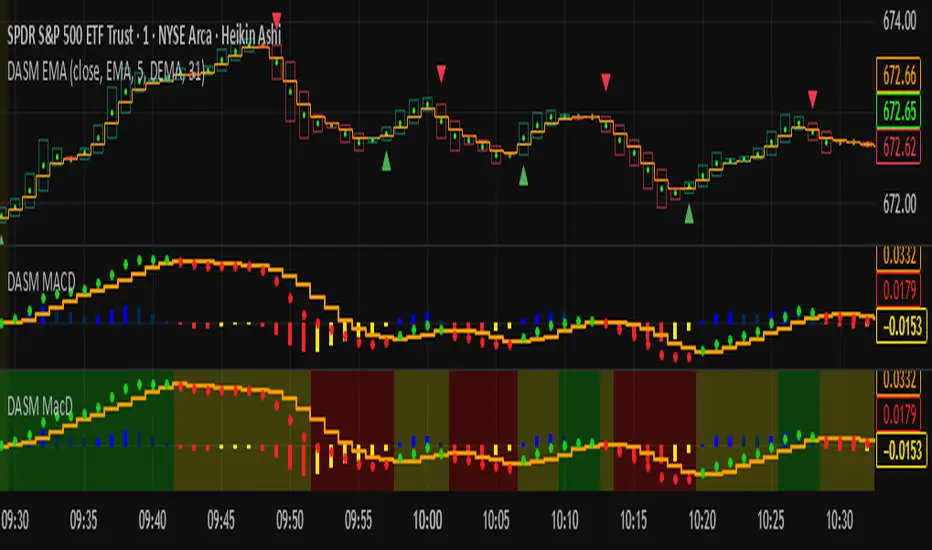
Macd-v

DASM MACDMACD rules:
The main trend is bullish when the MACD is above the zero line, and bearish when it’s below.
The histogram shows when a trend starts and when it’s losing strength.
The background color highlights the trend direction.
The EMA is easy to read — green means buy, red means sell.
For scalping, it’s best used during high-volume hours (9:30–11:00 New York time).
MACD Enhanced [DCAUT]█ MACD Enhanced
📊 ORIGINALITY & INNOVATION
The MACD Enhanced represents a significant improvement over traditional MACD implementations. While Gerald Appel's original MACD from the 1970s was limited to exponential moving averages (EMA), this enhanced version expands algorithmic options by supporting 21 different moving average calculations for both the main MACD line and signal line independently.
This improvement addresses an important limitation of traditional MACD: the inability to adapt the indicator's mathematical foundation to different market conditions. By allowing traders to select from algorithms ranging from simple moving averages (SMA) for stability to advanced adaptive filters like Kalman Filter for noise reduction, this implementation changes MACD from a fixed-algorithm tool into a flexible instrument that can be adjusted for specific market environments and trading strategies.
The enhanced histogram visualization system uses a four-color gradient that helps communicate momentum strength and direction more clearly than traditional single-color histograms.
📐 MATHEMATICAL FOUNDATION
The core calculation maintains the proven MACD formula: Fast MA(source, fastLength) - Slow MA(source, slowLength), but extends it with algorithmic flexibility. The signal line applies the selected smoothing algorithm to the MACD line over the specified signal period, while the histogram represents the difference between MACD and signal lines.
Available Algorithms:
The implementation supports a comprehensive spectrum of technical analysis algorithms:
Basic Averages: SMA (arithmetic mean), EMA (exponential weighting), RMA (Wilder's smoothing), WMA (linear weighting)
Advanced Averages: HMA (Hull's low-lag), VWMA (volume-weighted), ALMA (Arnaud Legoux adaptive)
Mathematical Filters: LSMA (least squares regression), DEMA (double exponential), TEMA (triple exponential), ZLEMA (zero-lag exponential)
Adaptive Systems: T3 (Tillson T3), FRAMA (fractal adaptive), KAMA (Kaufman adaptive), MCGINLEY_DYNAMIC (reactive to volatility)
Signal Processing: ULTIMATE_SMOOTHER (low-pass filter), LAGUERRE_FILTER (four-pole IIR), SUPER_SMOOTHER (two-pole Butterworth), KALMAN_FILTER (state-space estimation)
Specialized: TMA (triangular moving average), LAGUERRE_BINOMIAL_FILTER (binomial smoothing)
Each algorithm responds differently to price action, allowing traders to match the indicator's behavior to market characteristics: trending markets benefit from responsive algorithms like EMA or HMA, while ranging markets require stable algorithms like SMA or RMA.
📊 COMPREHENSIVE SIGNAL ANALYSIS
Histogram Interpretation:
Positive Values: Indicate bullish momentum when MACD line exceeds signal line, suggesting upward price pressure and potential buying opportunities
Negative Values: Reflect bearish momentum when MACD line falls below signal line, indicating downward pressure and potential selling opportunities
Zero Line Crosses: MACD crossing above zero suggests transition to bullish bias, while crossing below indicates bearish bias shift
Momentum Changes: Rising histogram (regardless of positive/negative) signals accelerating momentum in the current direction, while declining histogram warns of momentum deceleration
Advanced Signal Recognition:
Divergences: Price making new highs/lows while MACD fails to confirm often precedes trend reversals
Convergence Patterns: MACD line approaching signal line suggests impending crossover and potential trade setup
Histogram Peaks: Extreme histogram values often mark momentum exhaustion points and potential reversal zones
🎯 STRATEGIC APPLICATIONS
Comprehensive Trend Confirmation Strategies:
Primary Trend Validation Protocol:
Identify primary trend direction using higher timeframe (4H or Daily) MACD position relative to zero line
Confirm trend strength by analyzing histogram progression: consistent expansion indicates strong momentum, contraction suggests weakening
Use secondary confirmation from MACD line angle: steep angles (>45°) indicate strong trends, shallow angles suggest consolidation
Validate with price structure: trending markets show consistent higher highs/higher lows (uptrend) or lower highs/lower lows (downtrend)
Entry Timing Techniques:
Pullback Entries in Uptrends: Wait for MACD histogram to decline toward zero line without crossing, then enter on histogram expansion with MACD line still above zero
Breakout Confirmations: Use MACD line crossing above zero as confirmation of upward breakouts from consolidation patterns
Continuation Signals: Look for MACD line re-acceleration (steepening angle) after brief consolidation periods as trend continuation signals
Advanced Divergence Trading Systems:
Regular Divergence Recognition:
Bullish Regular Divergence: Price creates lower lows while MACD line forms higher lows. This pattern is traditionally considered a potential upward reversal signal, but should be combined with other confirmation signals
Bearish Regular Divergence: Price makes higher highs while MACD shows lower highs. This pattern is traditionally considered a potential downward reversal signal, but trading decisions should incorporate proper risk management
Hidden Divergence Strategies:
Bullish Hidden Divergence: Price shows higher lows while MACD displays lower lows, indicating trend continuation potential. Use for adding to existing long positions during pullbacks
Bearish Hidden Divergence: Price creates lower highs while MACD forms higher highs, suggesting downtrend continuation. Optimal for adding to short positions during bear market rallies
Multi-Timeframe Coordination Framework:
Three-Timeframe Analysis Structure:
Primary Timeframe (Daily): Determine overall market bias and major trend direction. Only trade in alignment with daily MACD direction
Secondary Timeframe (4H): Identify intermediate trend changes and major entry opportunities. Use for position sizing decisions
Execution Timeframe (1H): Precise entry and exit timing. Look for MACD line crossovers that align with higher timeframe bias
Timeframe Synchronization Rules:
Daily MACD above zero + 4H MACD rising = Strong uptrend context for long positions
Daily MACD below zero + 4H MACD declining = Strong downtrend context for short positions
Conflicting signals between timeframes = Wait for alignment or use smaller position sizes
1H MACD signals only valid when aligned with both higher timeframes
Algorithm Considerations by Market Type:
Trending Markets: Responsive algorithms like EMA, HMA may be considered, but effectiveness should be tested for specific market conditions
Volatile Markets: Noise-reducing algorithms like KALMAN_FILTER, SUPER_SMOOTHER may help reduce false signals, though results vary by market
Range-Bound Markets: Stability-focused algorithms like SMA, RMA may provide smoother signals, but individual testing is required
Short Timeframes: Low-lag algorithms like ZLEMA, T3 theoretically respond faster but may also increase noise
Important Note: All algorithm choices and parameter settings should be thoroughly backtested and validated based on specific trading strategies, market conditions, and individual risk tolerance. Different market environments and trading styles may require different configuration approaches.
📋 DETAILED PARAMETER CONFIGURATION
Comprehensive Source Selection Strategy:
Price Source Analysis and Optimization:
Close Price (Default): Most commonly used, reflects final market sentiment of each period. Best for end-of-day analysis, swing trading, daily/weekly timeframes. Advantages: widely accepted standard, good for backtesting comparisons. Disadvantages: ignores intraday price action, may miss important highs/lows
HL2 (High+Low)/2: Midpoint of the trading range, reduces impact of opening gaps and closing spikes. Best for volatile markets, gap-prone assets, forex markets. Calculation impact: smoother MACD signals, reduced noise from price spikes. Optimal when asset shows frequent gaps, high volatility during specific sessions
HLC3 (High+Low+Close)/3: Weighted average emphasizing the close while including range information. Best for balanced analysis, most asset classes, medium-term trading. Mathematical effect: 33% weight to high/low, 33% to close, provides compromise between close and HL2. Use when standard close is too noisy but HL2 is too smooth
OHLC4 (Open+High+Low+Close)/4: True average of all price points, most comprehensive view. Best for complete price representation, algorithmic trading, statistical analysis. Considerations: includes opening sentiment, smoothest of all options but potentially less responsive. Optimal for markets with significant opening moves, comprehensive trend analysis
Parameter Configuration Principles:
Important Note: Different moving average algorithms have distinct mathematical characteristics and response patterns. The same parameter settings may produce vastly different results when using different algorithms. When switching algorithms, parameter settings should be re-evaluated and tested for appropriateness.
Length Parameter Considerations:
Fast Length (Default 12): Shorter periods provide faster response but may increase noise and false signals, longer periods offer more stable signals but slower response, different algorithms respond differently to the same parameters and may require adjustment
Slow Length (Default 26): Should maintain a reasonable proportional relationship with fast length, different timeframes may require different parameter configurations, algorithm characteristics influence optimal length settings
Signal Length (Default 9): Shorter lengths produce more frequent crossovers but may increase false signals, longer lengths provide better signal confirmation but slower response, should be adjusted based on trading style and chosen algorithm characteristics
Comprehensive Algorithm Selection Framework:
MACD Line Algorithm Decision Matrix:
EMA (Standard Choice): Mathematical properties: exponential weighting, recent price emphasis. Best for general use, traditional MACD behavior, backtesting compatibility. Performance characteristics: good balance of speed and smoothness, widely understood behavior
SMA (Stability Focus): Equal weighting of all periods, maximum smoothness. Best for ranging markets, noise reduction, conservative trading. Trade-offs: slower signal generation, reduced sensitivity to recent price changes
HMA (Speed Optimized): Hull Moving Average, designed for reduced lag. Best for trending markets, quick reversals, active trading. Technical advantage: square root period weighting, faster trend detection. Caution: can be more sensitive to noise
KAMA (Adaptive): Kaufman Adaptive MA, adjusts smoothing based on market efficiency. Best for varying market conditions, algorithmic trading. Mechanism: fast smoothing in trends, slow smoothing in sideways markets. Complexity: requires understanding of efficiency ratio
Signal Line Algorithm Optimization Strategies:
Matching Strategy: Use same algorithm for both MACD and signal lines. Benefits: consistent mathematical properties, predictable behavior. Best when backtesting historical strategies, maintaining traditional MACD characteristics
Contrast Strategy: Use different algorithms for optimization. Common combinations: MACD=EMA, Signal=SMA for smoother crossovers, MACD=HMA, Signal=RMA for balanced speed/stability, Advanced: MACD=KAMA, Signal=T3 for adaptive behavior with smooth signals
Market Regime Adaptation: Trending markets: both fast algorithms (EMA/HMA), Volatile markets: MACD=KALMAN_FILTER, Signal=SUPER_SMOOTHER, Range-bound: both slow algorithms (SMA/RMA)
Parameter Sensitivity Considerations:
Impact of Parameter Changes:
Length Parameter Sensitivity: Small parameter adjustments can significantly affect signal timing, while larger adjustments may fundamentally change indicator behavior characteristics
Algorithm Sensitivity: Different algorithms produce different signal characteristics. Thoroughly test the impact on your trading strategy before switching algorithms
Combined Effects: Changing multiple parameters simultaneously can create unexpected effects. Recommendation: adjust parameters one at a time and thoroughly test each change
📈 PERFORMANCE ANALYSIS & COMPETITIVE ADVANTAGES
Response Characteristics by Algorithm:
Fastest Response: ZLEMA, HMA, T3 - minimal lag but higher noise
Balanced Performance: EMA, DEMA, TEMA - good trade-off between speed and stability
Highest Stability: SMA, RMA, TMA - reduced noise but increased lag
Adaptive Behavior: KAMA, FRAMA, MCGINLEY_DYNAMIC - automatically adjust to market conditions
Noise Filtering Capabilities:
Advanced algorithms like KALMAN_FILTER and SUPER_SMOOTHER help reduce false signals compared to traditional EMA-based MACD. Noise-reducing algorithms can provide more stable signals in volatile market conditions, though results will vary based on market conditions and parameter settings.
Market Condition Adaptability:
Unlike fixed-algorithm MACD, this enhanced version allows real-time optimization. Trending markets benefit from responsive algorithms (EMA, HMA), while ranging markets perform better with stable algorithms (SMA, RMA). The ability to switch algorithms without changing indicators provides greater flexibility.
Comparative Performance vs Traditional MACD:
Algorithm Flexibility: 21 algorithms vs 1 fixed EMA
Signal Quality: Reduced false signals through noise filtering algorithms
Market Adaptability: Optimizable for any market condition vs fixed behavior
Customization Options: Independent algorithm selection for MACD and signal lines vs forced matching
Professional Features: Advanced color coding, multiple alert conditions, comprehensive parameter control
USAGE NOTES
This indicator is designed for technical analysis and educational purposes. Like all technical indicators, it has limitations and should not be used as the sole basis for trading decisions. Algorithm performance varies with market conditions, and past characteristics do not guarantee future results. Always combine with proper risk management and thorough strategy testing.

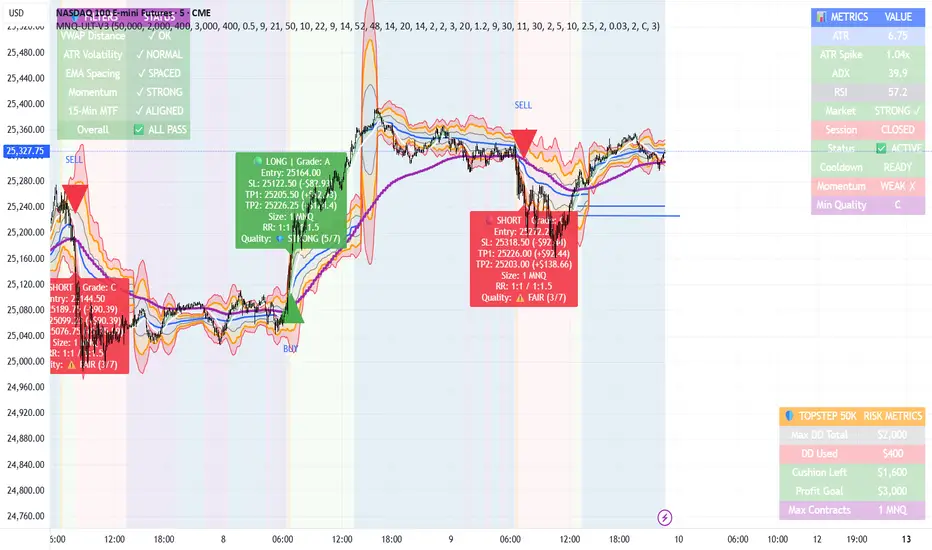
MNQ TopStep 50K | Ultra Quality v3.0MNQ TopStep 50K | Ultra Quality v3.0 - Publish Summary📊 OverviewA professional-grade trading indicator designed specifically for MNQ futures traders using TopStep funded accounts. Combines 7 technical confirmations with 5 advanced safety filters to deliver high-quality trade signals while managing drawdown risk.🎯 Key FeaturesCore Signal System
7-Point Confirmation: VWAP, EMA crossovers, 15-min HTF trend, MACD, RSI, ADX, and Volume
Signal Grading: Each signal is rated A+ through D based on 7 quality factors
Quality Threshold: Adjustable minimum grade requirement (A+, A, B, C, D)
Advanced Safety Filters (Customizable)
Mean Reversion Filter - Prevents chasing extended moves beyond VWAP bands
ATR Spike Filter - Avoids trading during extreme volatility events
EMA Spacing Filter - Ensures proper trend separation (optional)
Momentum Filter - Requires consecutive directional bars (optional)
Multi-Timeframe Confirmation - Aligns with 15-min trend (optional)
TopStep Risk Management
Real-time drawdown tracking
Position sizing calculator based on remaining cushion
Daily loss limit monitoring
Consecutive loss protection
Max trades per day limiter
Visual Components
VWAP with 1σ, 2σ, 3σ bands
EMA 9/21 with cloud fill
15-min EMA 50 for HTF trend
Comprehensive metrics dashboard
Risk management panel
Filter status panel
Detailed trade labels with entry, stops, and targets
⚙️ Default Settings (Balanced for Regular Signals)Technical Indicators
Fast EMA: 9 | Slow EMA: 21 | HTF EMA: 50 (15-min)
MACD: 10/22/9
RSI: 14 period | Thresholds: 52 (buy) / 48 (sell)
ADX: 14 period | Minimum: 20
ATR: 14 period | Stop: 2x | TP1: 2x | TP2: 3x
Volume: 1.2x average required
Session Settings
Default: 9:30 AM - 11:30 AM ET (adjustable)
Avoids first 15 minutes after market open
Customizable trading hours
Safety Filters (Default Configuration)
✅ Mean Reversion: Enabled (2.5σ max from VWAP)
✅ ATR Spike: Enabled (2.0x threshold)
❌ EMA Spacing: Disabled (can enable for quality)
❌ Momentum: Disabled (can enable for quality)
❌ MTF Confirmation: Disabled (can enable for quality)
Risk Controls
Minimum Signal Quality: C (adjustable to A+ for fewer/better signals)
Min Bars Between Signals: 10
Max Trades Per Day: 5
Stop After Consecutive Losses: 2
📈 Expected PerformanceWith Default Settings:
Signals per week: 10-15 trades
Estimated win rate: 55-60%
Risk-Reward: 1:2 (TP1) and 1:3 (TP2)
With Aggressive Settings (Min Quality = D, All Filters Off):
Signals per week: 20-25 trades
Estimated win rate: 50-55%
With Conservative Settings (Min Quality = A, All Filters On):
Signals per week: 3-5 trades
Estimated win rate: 65-70%
🚀 How to UseBasic Setup:
Add indicator to MNQ 5-minute chart
Adjust TopStep account settings in inputs
Set your risk per trade percentage (default: 0.5%)
Configure trading session hours
Set minimum signal quality (Start with C for balanced results)
Signal Interpretation:
Green Triangle (BUY): Long signal - all confirmations aligned
Red Triangle (SELL): Short signal - all confirmations aligned
Label Details: Shows entry, stop loss, take profit levels, position size, and signal grade
Signal Grade: A+ = Elite (6-7 points) | A = Strong (5) | B = Good (4) | C = Fair (3)
Dashboard Monitoring:
Top Right: Technical metrics and market conditions
Top Left: Filter status (which filters are passing/blocking)
Bottom Right: TopStep risk metrics and position sizing
⚡ Customization TipsFor More Signals:
Lower "Minimum Signal Quality" to D
Decrease ADX threshold to 18-20
Lower RSI thresholds to 50/50
Reduce Volume multiplier to 1.1x
Disable additional filters
For Higher Quality (Fewer Signals):
Raise "Minimum Signal Quality" to A or A+
Increase ADX threshold to 25-30
Enable all 5 advanced filters
Tighten VWAP distance to 2.0σ
Increase momentum requirement to 3-4 bars
For TopStep Compliance:
Adjust "Max Total Drawdown" and "Daily Loss Limit" to match your account
Update "Already Used Drawdown" daily
Monitor the Risk Panel for cushion remaining
Use recommended contract sizing
🛡️ Risk DisclaimerIMPORTANT: This indicator is for educational and informational purposes only.
Past performance does not guarantee future results
All trading involves substantial risk of loss
Use proper risk management and position sizing
Test thoroughly in paper trading before live use
The indicator does not guarantee profitable trades
Adjust settings based on your risk tolerance and trading style
Always comply with your broker's and TopStep's rules
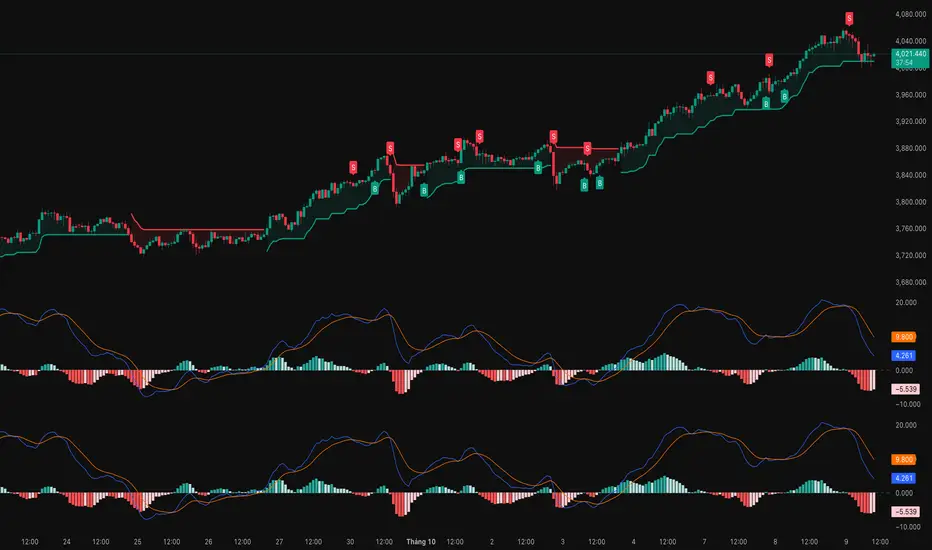
MACD (Buy & Sell signals)This file uses the original code of the MACD and adds a Buy Sell signal when the MACD cuts the signal
LA - MACD EMA BandsOverview of the "LA - MACD EMA Bands" Indicator
For Better view, use this indicator along with "LA - EMA Bands with MTF Dashboard"
The "LA - MACD EMA Bands" is a custom technical indicator written in Pine Script v6 for TradingView. It builds on the traditional Moving Average Convergence Divergence (MACD) oscillator by incorporating additional smoothing via Exponential Moving Averages (EMAs) and Bollinger Bands (BB) applied directly to the MACD line. This creates a multi-layered momentum and volatility tool displayed in a separate pane below the price chart (not overlaid on the price itself).
The indicator allows for customization, such as selecting a different timeframe (for multi-timeframe analysis) and adjusting period lengths. It fetches data from the specified timeframe using request.security with lookahead enabled to avoid repainting issues. The core idea is to provide insights into momentum trends, crossovers, and volatility expansions/contractions in the MACD's behavior, making it suitable for identifying potential trend reversals, continuations, or ranging markets.
Unlike a standard MACD, which focuses primarily on momentum via a single line, signal line, and histogram, this version emphasizes longer-term smoothing and volatility boundaries. It uses visual fills between lines to highlight bullish/bearish conditions, aiding quick interpretation. Below, I'll break down each component, its calculation, visual representation, and practical uses.
Detailed Breakdown of Each Component and Its Uses
MACD Line (Blue Line, Labeled 'MACD Line')
Calculation: This is the core MACD value, computed as the difference between a fast EMA (default length 12) and a slow EMA (default length 144) of the input source (default: close price). The EMAs are calculated on data from the selected timeframe.
Visuals: Plotted as a solid blue line.
Uses:
Measures momentum: When above zero, it indicates bullish momentum (prices rising faster in the short term); below zero, bearish momentum.
Trend identification: Rising MACD suggests strengthening uptrends; falling suggests downtrends.
Divergence spotting: Compare with price action—e.g., if price makes higher highs but MACD makes lower highs, it signals potential bearish reversal (and vice versa for bullish divergence).
In trading: Often used for entry/exit signals when crossing the zero line or other lines in the indicator.
MACD EMA (Red Line, Labeled 'MACD EMA')
Calculation: A 12-period EMA applied to the MACD Line itself.
Visuals: Plotted as a solid red line.
Uses:
Acts as a signal line for the MACD, smoothing out short-term noise.
Crossover signals: When the MACD Line crosses above the MACD EMA, it can signal a bullish buy opportunity; crossing below suggests a bearish sell.
Trend confirmation: Helps filter false signals in choppy markets by requiring confirmation from this slower-moving average.
In trading: Useful for momentum-based strategies, like entering trades on crossovers in alignment with the overall trend.
Fill Between MACD Line and MACD EMA (Green/Red Shaded Area, Titled 'MACD Fill')
Calculation: The area between the MACD Line and MACD EMA is filled with color based on their relative positions.
Color Logic: Green (with 57% transparency) if MACD Line > MACD EMA (bullish); red if MACD Line < MACD EMA (bearish).
Visuals: Semi-transparent fill for easy visibility without overwhelming the lines.
Uses:
Quick visual cue for momentum shifts: Green areas highlight bullish phases; red for bearish.
Enhances readability: Makes crossovers more apparent at a glance, especially in fast-moving markets.
In trading: Can be used to time entries/exits or as a filter (e.g., only take long trades in green zones).
Bollinger Bands on MACD (BB Upper: Black Dotted, BB Basis: Maroon Dotted, BB Lower: Black Dotted)
Calculation: Bollinger Bands applied to the MACD Line.
BB Basis: 144-period EMA of the MACD Line.
BB Standard Deviation: 144-period stdev of the MACD Line.
BB Upper: BB Basis + (2.0 * BB Stdev)
BB Lower: BB Basis - (2.0 * BB Stdev)
Visuals: Upper and lower bands as black dotted lines; basis as maroon dotted
Uses:
Volatility measurement: Bands expand during high momentum volatility (strong trends) and contract during low volatility (ranging or consolidation).
Mean reversion: When MACD Line touches or exceeds the upper band, it may signal overbought conditions (potential sell); lower band for oversold (potential buy).
Squeeze detection: Narrow bands (squeeze) often precede big moves—watch for breakouts.
In trading: Combines momentum with volatility; e.g., a MACD Line breakout above the upper band could confirm a strong uptrend.
BB Basis EMA (Green Line, Labeled 'BB Basis EMA')
Calculation: A 72-period EMA applied to the BB Basis (which is already a 144-period EMA of the MACD Line).
Visuals: Solid green line.
Uses:
Further smoothing: Provides a longer-term view of the MACD's average behavior, reducing noise from the BB Basis.
Trend direction: Acts as a baseline for the BB system—above it suggests bullish bias in momentum volatility; below, bearish.
Crossover with BB Basis: Can signal shifts in volatility trends (e.g., BB Basis crossing above BB Basis EMA indicates increasing bullish volatility).
In trading: Useful for confirming longer-term trends or as a filter for BB-based signals.
Fill Between BB Basis and BB Basis EMA (Gray Shaded Area, Titled 'BB Basis Fill')
Calculation: The area between BB Basis and BB Basis EMA is filled.
Color Logic: Currently set to a constant semi-transparent gray regardless of position.
Visuals: Semi-transparent gray fill.
Uses:
Highlights divergence: Shows when the shorter-term BB Basis deviates from its longer-term EMA, indicating potential volatility shifts.
Visual aid for crossovers: Makes it easier to spot when BB Basis crosses its EMA.
In trading: Could be used to identify overextensions in volatility (e.g., wide gray areas might signal impending mean reversion).
Zero Line (Black Horizontal Line)
Calculation: A simple horizontal line at y=0.
Visuals: Solid black line.
Uses:
Reference point: Divides bullish (above) from bearish (below) territory for all MACD-related lines.
In trading: Crossovers of the zero line by the MACD Line or BB Basis can signal major trend changes.
How It Differs from a Normal MACD
A standard MACD (e.g., the built-in TradingView MACD with defaults 12/26/9) consists of:
MACD Line: EMA(12) - EMA(26).
Signal Line: EMA(MACD Line, 9).
Histogram: MACD Line - Signal Line (bars showing convergence/divergence).
Key differences in "LA - MACD EMA Bands":
Periods: Uses a much longer slow EMA (144 vs. 26), making it more sensitive to long-term trends but less reactive to short-term price action. The MACD EMA is 12 periods (vs. 9), further emphasizing smoothing.
No Histogram: Replaces the histogram with fills and bands for visual emphasis on crossovers and volatility.
Added Bollinger Bands: Applies BB directly to the MACD Line (with a long 144-period basis), introducing volatility analysis absent in standard MACD. This helps detect "squeezes" or expansions in momentum.
Additional EMA Layer: The BB Basis EMA (72-period) adds a secondary smoothing level to the BB system, providing a hierarchical view of momentum (short-term MACD → mid-term BB → long-term EMA).
Multi-Timeframe Support: Built-in option for higher timeframes, unlike basic MACD.
Focus: Standard MACD is purely momentum-focused; this version integrates volatility (via BB) and multi-layer smoothing, making it better for trend-following in volatile markets but potentially overwhelming for beginners.
Overall, this indicator transforms the MACD from a simple oscillator into a comprehensive momentum-volatility hybrid, reducing false signals in trending markets but introducing lag.
Overall Pros and Cons
Pros:
Enhanced Visualization: Fills and bands make trends, crossovers, and volatility easier to spot without needing multiple indicators.
Reduced Noise: Longer periods (144, 72) smooth out whipsaws, ideal for swing or position trading in trending assets like stocks or forex.
Volatility Integration: BB adds a dimension not in standard MACD, helping identify breakouts or consolidations.
Customizable: Inputs for timeframes and lengths allow adaptation to different assets/timeframes.
Multi-Layered Insights: Combines short-term signals (MACD crossovers) with long-term confirmation (BB EMA), improving signal reliability.
Cons:
Lagging Nature: Long periods (e.g., 144) delay signals, missing early entries in fast markets or leading to late exits.
Complexity: Multiple lines and fills can clutter the pane, requiring experience to interpret; beginners might misread it.
Potential Overfitting: Custom periods (12/144/12/144/72) may work well on historical data but underperform in live trading without backtesting.
No Built-in Alerts/Signals: Relies on visual interpretation; users must manually set alerts for crossovers.
Resource Intensive: On lower timeframes or with lookahead, it might slow chart loading on Trading View.
This indicator shines in strategies combining momentum and volatility, like trend-following with BB squeezes, but test it on your assets (e.g., via backtesting) to ensure it fits your style.
For Better view, use this indicator along with "LA - EMA Bands with MTF Dashboard"

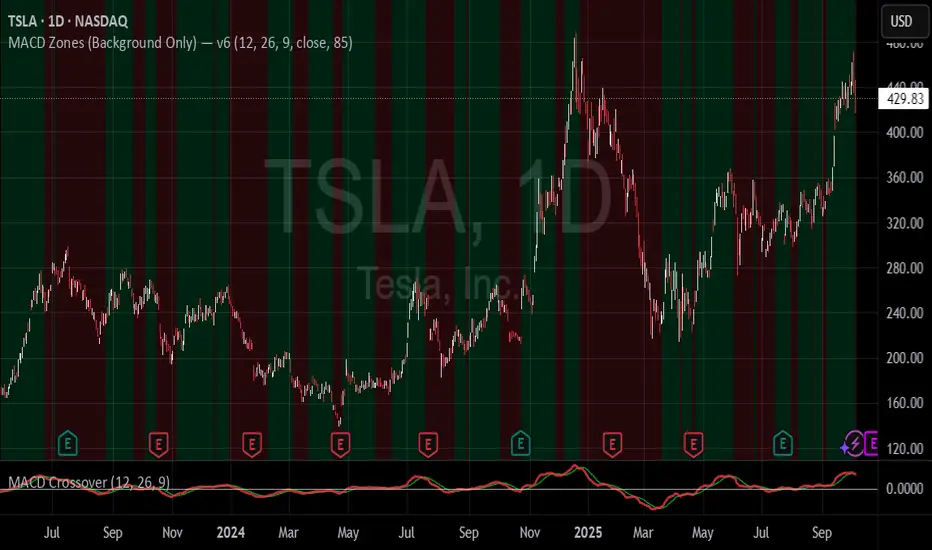
MACD Zones (Background Only)Indicator which shows the convergence and divergence zones directly on the graph by highlighting in red (convergence) and green (divergence).
MACD-V+ (ATR Normalized MACD)MACD-V+ is an ATR-normalized MACD tool that focuses on true turning points inside Overbought/Oversold zones. It marks a signal only when the MACD’s slope changes direction and shows real progress back toward the zero line, with an optional dwell (depth & time) filter so you don’t get faked out by shallow pokes into a zone. Clean visuals, “first-in-zone” gating, and configurable labeling make it practical for discretionary and systematic traders alike.
For best results, adjust Overbought and Oversold levels based on stock volatility. The default settings of 150 and -150 are for highly volatile tickers. Reduce for less volatile tickers.
Please help me improve the code for everyone.

LBR Oscillator with Signals & AlertsLinda Bradford Raschke MacD indicator. Has alerts and can be used in the pine screener on different timeframes.

MACD-V+MACD-V+ Indicator - Advanced Momentum Analysis
The MACD-V+ indicator is an enhanced version of the volatility-normalized MACD methodology developed by Alex Spiroglou. This approach addresses critical limitations of traditional MACD through ATR-based volatility normalization, providing comparable values across time and markets.
What is MACD-V?
MACD-V applies Average True Range (ATR) normalization to traditional MACD, creating a universal momentum indicator that works consistently across all markets and timeframes. The methodology was developed through extensive statistical research analyzing multiple markets and timeframes.
Formula: × 100
This normalization transforms MACD from price-dependent values into standardized momentum readings.
Traditional MACD Limitations
Limitation 1: Non-Comparable Values Across Time
Traditional MACD values cannot be compared across different time periods due to varying price levels. S&P 500 maximum MACD was 1.56 in 1957-1971, but reached 86.31 in 2019-2021 - not indicating 55x stronger momentum, but simply different price scales.
Solution: MACD-V provides comparable historical values where a reading of 100 today has the same mathematical meaning as 100 in any previous period.
Limitation 2: Non-Comparable Across Markets
Traditional MACD cannot compare momentum between different assets. S&P 500 MACD of 65 versus EUR/USD MACD of -0.5 reflects price differences, not relative strength.
Solution: MACD-V creates universal levels that work across all markets. The ±150 extreme levels apply consistently whether analyzing stocks, bonds, commodities, or currencies.
Limitation 3: No Objective Momentum System
Traditional MACD lacks universal overbought or oversold level definitions, making systematic analysis difficult.
Solution: MACD-V provides an objective 7-stage momentum lifecycle system with clearly defined zones and state transitions.
Limitation 4: Signal Line False Signals
In low momentum environments, traditional MACD generates multiple false signals as the line oscillates near zero.
Solution: MACD-V filters signal quality by identifying neutral zones (-50 to +50) where signal reliability is lower.
Limitation 5: Signal Line Timing Lag
During extreme momentum, traditional MACD signal line lags significantly due to large separation from the MACD line.
Solution: MACD-V anticipates timing issues in extreme momentum environments (±150) through zone-based analysis and lifecycle states.
Universal Application
MACD-V+ works across:
Individual Stocks
Forex Pairs
Commodity Futures
Cryptocurrencies
All Timeframes
Key Features
Zone System
Overbought Zone: Above +150 (extreme bullish momentum)
Rally Zone: +50 to +150 (strong bullish momentum)
Ranging Zone: -50 to +50 (neutral/low momentum)
Rebound Zone: -50 to -150 (strong bearish momentum)
Oversold Zone: Below -150 (extreme bearish momentum)
7-Stage Lifecycle States
Ranging: Neutral momentum in -50 to +50 zone
Rallying: Rally zone + MACD above Signal + rising momentum
Overbought: Extreme zone above +150
Retracing: Rally zone + MACD below Signal (pullback from overbought)
Reversing: Rebound zone + MACD below Signal + falling momentum
Oversold: Extreme zone below -150
Rebounding: Rebound zone + MACD above Signal (recovery from oversold)
Visual Status Display
Real-Time State Table: Shows current lifecycle state name
Color-Coded States: Blue (Rallying/Rebounding), Red (Overbought/Oversold), Orange (Retracing/Reversing), Gray (Ranging)
Strength Multiplier: Live histogram strength indicator (e.g., "x 1.45")
Enhanced Features (Plus)
Absolute Histogram MA: ATR-length moving average of absolute histogram values for strength measurement
Direction-Aware Display: MA line follows histogram sign (positive above 0, negative below 0)
Strength Multiplier: Current momentum vs. average strength ratio (always positive value)
Histogram Extreme Levels: Short-term overbought/oversold (±40) for pullback detection
Chart Legend - Visual Signal Guide
Lines and Histogram
🔵 Blue Line: MACD-V value (ATR-normalized momentum)
🟠 Orange Line: Signal line (9-period EMA of MACD-V)
📊 Histogram Bars: MACD-V minus Signal line (momentum differential)
Histogram Colors: Green shades (positive momentum), Red shades (negative momentum)
🟡 Yellow Line: Dynamic MA of absolute histogram values (follows histogram sign)
Background Colors
🟥 Light Red Background: Extreme overbought zone (MACD-V > +150)
🟩 Light Green Background: Extreme oversold zone (MACD-V < -150)
Horizontal Reference Lines
➖ +150 (Gray Dashed): Overbought extreme level
➖ +50 (Gray Dashed): Rally zone entry level
➖ 0 (Gray Solid): Zero line - trend separator
➖ -50 (Gray Dashed): Rebound zone entry level
➖ -150 (Gray Dashed): Oversold extreme level
Optional Histogram Levels
➖ +40 (Yellow Dashed): Histogram short-term overbought
➖ -40 (Yellow Dashed): Histogram short-term oversold
Status Table
📋 Top-Center Table: Current lifecycle state display
State Name: RANGING / RALLYING / OVERBOUGHT / RETRACING / REVERSING / OVERSOLD / REBOUNDING
Histogram Warning: Short-term overbought/oversold alerts (±40 levels)
State Label
📊 Label at MACD/Signal Midpoint: Current lifecycle state with strength analysis
State Name: RANGING / RALLYING / OVERBOUGHT / RETRACING / REVERSING / OVERSOLD / REBOUNDING
Strength Multiplier Interpretation:
- Strong acceleration (>1.75): Powerful momentum, trend continuation likely
- Moderate progression (1.25-1.75): Normal trend strength
- Trend continuation (0.75-1.25): Stable momentum near average
- Watch for reversal (0.25-0.75): Weakening momentum
- Trend exhaustion (<0.25): Very weak momentum, reversal possible
Trading Applications
1. Lifecycle State Trading
Enter Long: When state changes to "RALLYING" (strong bullish momentum established)
Enter Short: When state changes to "REVERSING" (strong bearish momentum established)
Exit/Reduce: When state reaches "OVERBOUGHT" or "OVERSOLD" (extreme levels)
Avoid Trading: When state is "RANGING" (low momentum, unreliable signals)
2. Zone-Based Trading
Rally Zone (+50 to +150): Look for pullback entries (histogram dips)
Rebound Zone (-50 to -150): Look for bounce entries (histogram rises)
Extreme Zones (±150+): Prepare for reversal or take profits
Ranging Zone (-50 to +50): Wait for breakout confirmation
3. Signal Line Crossovers
Bullish Cross: MACD-V crosses above Signal line (momentum shift up)
Bearish Cross: MACD-V crosses below Signal line (momentum shift down)
Quality Filter: Trust crossovers in Rally/Rebound zones, ignore in Ranging zone
4. Zero Line Crosses
Cross Above 0: Transition to bullish regime
Cross Below 0: Transition to bearish regime
Trend Confirmation: Strong trends keep MACD-V on same side of zero
5. Histogram Extreme Strategy
Above +40: Short-term overbought - potential pullback
Below -40: Short-term oversold - potential bounce
Use with Trend: Buy dips to -40 in uptrend, sell rallies to +40 in downtrend
6. Strength Multiplier Analysis
> 1.75: Strong acceleration - powerful momentum, trend continuation highly likely
1.25 to 1.75: Moderate progression - normal healthy trend strength
0.75 to 1.25: Trend continuation - stable momentum near average strength
0.25 to 0.75: Watch for reversal - momentum weakening significantly
< 0.25: Trend exhaustion - very weak momentum, reversal possible
Comprehensive Alert System
Lifecycle State Change Alerts
Range Entered (low momentum warning)
Rally Started (bullish momentum established)
Overbought Reached (extreme bullish level)
Overbought Exit (leaving extreme zone)
Retracing Started (pullback from overbought)
Reversal Started (bearish momentum established)
Oversold Reached (extreme bearish level)
Oversold Exit (leaving extreme zone)
Rebounding Started (recovery from oversold)
Alert Builder Integration
Binary outputs (1/0) for external alert systems:
Individual state flags for each of 7 lifecycle states
Strength multiplier value for programmatic trend assessment
Settings & Parameters
MACD Configuration
MACD Fast: Fast EMA period (default: 12)
MACD Slow: Slow EMA period (default: 26)
Signal Line: Signal smoothing period (default: 9)
Source: Price source (default: Close)
Zone Boundaries
Overbought: Extreme bullish level (default: 150)
Oversold: Extreme bearish level (default: -150)
Rally: Strong bullish zone entry (default: 50)
Rebound: Strong bearish zone entry (default: -50)
Histogram Bounds
Histogram OB: Short-term overbought (default: 40)
Histogram OS: Short-term oversold (default: -40)
Trend Filters
MA Type: Histogram strength MA calculation method (None / SMA / EMA)
Show Elder Impulse Plus: Bar color system based on EMA(13) + histogram direction
200 EMA trend: Trend Filter v1 - Bull/Bear classification (adaptive MACD-V levels)
50/200 EMA 6-stage: Trend Filter v2 - Chuck Dukas Diamond 6-stage market classification
Best Practices
Trending Markets
Focus on "RALLYING" or "REVERSING" states for entries
Use histogram pullbacks (±40) for position additions
Monitor strength multiplier - exit if drops below 0.25
Take profits in extreme zones (±150+)
Yellow MA crossing histogram warns of momentum shift
Ranging Markets
Avoid trading when state is "RANGING"
Wait for clear zone entry (Rally/Rebound zone)
Use shorter timeframes for precision
Reduce position sizes due to lower reliability
Multi-Timeframe Analysis
Higher timeframe: Identify market regime (lifecycle state)
Lower timeframe: Time precise entries (histogram pullbacks)
Alignment: Trade only when both timeframes agree on direction
Risk Management
Reduce position size in extreme zones (±150+)
Use lifecycle state changes for stop-loss placement
Scale out of positions when strength multiplier < 0.25
Avoid counter-trend trades in strong states (RALLYING/REVERSING)
Watch yellow MA - when it crosses below histogram absolute value, momentum weakening
Combining with LBR 3/10-V Indicator
MACD-V+ and LBR 3/10-V create a powerful two-timeframe momentum system for strategic direction and tactical timing.
Strategic Filter: MACD-V+ determines WHETHER to trade (market regime)
Tactical Precision: LBR 3/10-V determines WHEN to enter (timing)
Double Confirmation: Both indicators must agree on direction
Lifecycle Management: Exit when MACD-V+ state changes
Strength Validation: Use MACD-V+ multiplier for position sizing
Extreme Respect: Both hitting extremes = high reversal probability
Methodology
MACD-V methodology is based on volatility normalization using Average True Range (ATR). This approach transforms traditional MACD into a universal momentum indicator with statistically-validated zones and objectively-defined states.
The indicator implements:
ATR-based normalization for cross-market comparability
Statistical analysis for universal zone definitions (±150, ±50)
Lifecycle state system for objective trend identification
Absolute histogram MA with direction-aware visualization (ATR-length period)
Strength multiplier: ratio of current to average absolute momentum (always positive)
Dynamic status table adapting to active trend filters
MACD-V+ transforms momentum analysis from subjective interpretation into objective, quantifiable measurements. Combined with LBR 3/10-V for tactical timing, it provides a complete framework for systematic trading across all financial markets and timeframes.
This indicator is designed for educational and analytical purposes. Past performance does not guarantee future results. Always conduct thorough research and consider consulting with financial professionals before making investment decisions.

MACD Forecast [Titans_Invest]MACD Forecast — The Future of MACD in Trading
The MACD has always been one of the most powerful tools in technical analysis.
But what if you could see where it’s going, instead of just reacting to what has already happened?
Introducing MACD Forecast — the natural evolution of the MACD Full , now taken to the next level. It’s the world’s first MACD designed not only to analyze the present but also to predict the future behavior of momentum.
By combining the classic MACD structure with projections powered by Linear Regression, this indicator gives traders an anticipatory, predictive view, redefining what’s possible in technical analysis.
Forget lagging indicators.
This is the smartest, most advanced, and most accurate MACD ever created.
🍟 WHY MACD FORECAST IS REVOLUTIONARY
Unlike the traditional MACD, which only reflects current and past price dynamics, the MACD Forecast uses regression-based projection models to anticipate where the MACD line, signal line, and histogram are heading.
This means traders can:
• See MACD crossovers before they happen.
• Spot trend reversals earlier than most.
• Gain an unprecedented timing advantage in both discretionary and automated trading.
In other words: this indicator lets you trade ahead of time.
🔮 FORECAST ENGINE — POWERED BY LINEAR REGRESSION
At its core, the MACD Forecast integrates Linear Regression (ta.linreg) to project the MACD’s future behavior with exceptional accuracy.
Projection Modes:
• Flat Projection: Assumes trend continuity at the current level.
• LinReg Projection: Applies linear regression across N periods to mathematically forecast momentum shifts.
This dual system offers both a conservative and adaptive view of market direction.
📐 ACCURACY WITH FULL CUSTOMIZATION
Just like the MACD Full, this new version comes with 20 customizable buy-entry conditions and 20 sell-entry conditions — now enhanced with forecast-based rules that anticipate crossovers and trend reversals.
You’re not just reacting — you’re strategizing ahead of time.
⯁ HOW TO USE MACD FORECAST❓
The MACD Forecast is built on the same foundation as the classic MACD, but with predictive capabilities.
Step 1 — Spot Predicted Crossovers:
Watch for forecasted bullish or bearish crossovers. These signals anticipate when the MACD line will cross the signal line in the future, letting you prepare trades before the move.
Step 2 — Confirm with Histogram Projection:
Use the projected histogram to validate momentum direction. A rising histogram signals strengthening bullish momentum, while a falling projection points to weakening or bearish conditions.
Step 3 — Combine with Multi-Timeframe Analysis:
Use forecasts across multiple timeframes to confirm signal strength (e.g., a 1h forecast aligned with a 4h forecast).
Step 4 — Set Entry Conditions & Automation:
Customize your buy/sell rules with the 20 forecast-based conditions and enable automation for bots or alerts.
Step 5 — Trade Ahead of the Market:
By preparing for future momentum shifts instead of reacting to the past, you’ll always stay one step ahead of lagging traders.
🤖 BUILT FOR AUTOMATION AND BOTS 🤖
Whether for manual trading, quantitative strategies, or advanced algorithms, the MACD Forecast was designed to integrate seamlessly with automated systems.
With predictive logic at its core, your strategies can finally react to what’s coming, not just what already happened.
🥇 WHY THIS INDICATOR IS UNIQUE 🥇
• World’s first MACD with Linear Regression Forecasting
• Predictive Crossovers (before they appear on the chart)
• Maximum flexibility with Long & Short combinations — 20+ fully configurable conditions for tailor-made strategies
• Fully automatable for quantitative systems and advanced bots
This isn’t just an update.
It’s the final evolution of the MACD.
______________________________________________________
🔹 CONDITIONS TO BUY 📈
______________________________________________________
• Signal Validity: The signal will remain valid for X bars .
• Signal Sequence: Configurable as AND or OR .
🔹 MACD > Signal Smoothing
🔹 MACD < Signal Smoothing
🔹 Histogram > 0
🔹 Histogram < 0
🔹 Histogram Positive
🔹 Histogram Negative
🔹 MACD > 0
🔹 MACD < 0
🔹 Signal > 0
🔹 Signal < 0
🔹 MACD > Histogram
🔹 MACD < Histogram
🔹 Signal > Histogram
🔹 Signal < Histogram
🔹 MACD (Crossover) Signal
🔹 MACD (Crossunder) Signal
🔹 MACD (Crossover) 0
🔹 MACD (Crossunder) 0
🔹 Signal (Crossover) 0
🔹 Signal (Crossunder) 0
🔮 MACD (Crossover) Signal Forecast
🔮 MACD (Crossunder) Signal Forecast
______________________________________________________
______________________________________________________
🔸 CONDITIONS TO SELL 📉
______________________________________________________
• Signal Validity: The signal will remain valid for X bars .
• Signal Sequence: Configurable as AND or OR .
🔸 MACD > Signal Smoothing
🔸 MACD < Signal Smoothing
🔸 Histogram > 0
🔸 Histogram < 0
🔸 Histogram Positive
🔸 Histogram Negative
🔸 MACD > 0
🔸 MACD < 0
🔸 Signal > 0
🔸 Signal < 0
🔸 MACD > Histogram
🔸 MACD < Histogram
🔸 Signal > Histogram
🔸 Signal < Histogram
🔸 MACD (Crossover) Signal
🔸 MACD (Crossunder) Signal
🔸 MACD (Crossover) 0
🔸 MACD (Crossunder) 0
🔸 Signal (Crossover) 0
🔸 Signal (Crossunder) 0
🔮 MACD (Crossover) Signal Forecast
🔮 MACD (Crossunder) Signal Forecast
______________________________________________________
______________________________________________________
🔮 Linear Regression Function 🔮
______________________________________________________
• Our indicator includes MACD forecasts powered by linear regression.
Forecast Types:
• Flat: Assumes prices will stay the same.
• Linreg: Makes a 'Linear Regression' forecast for n periods.
Technical Information:
• Function: ta.linreg()
Parameters:
• source: Source price series.
• length: Number of bars (period).
• offset : Offset.
• return: Linear regression curve.
______________________________________________________
______________________________________________________
⯁ UNIQUE FEATURES
______________________________________________________
Linear Regression: (Forecast)
Signal Validity: The signal will remain valid for X bars
Signal Sequence: Configurable as AND/OR
Table of Conditions: BUY/SELL
Conditions Label: BUY/SELL
Plot Labels in the graph above: BUY/SELL
Automate & Monitor Signals/Alerts: BUY/SELL
Linear Regression (Forecast)
Signal Validity: The signal will remain valid for X bars
Signal Sequence: Configurable as AND/OR
Table of Conditions: BUY/SELL
Conditions Label: BUY/SELL
Plot Labels in the graph above: BUY/SELL
Automate & Monitor Signals/Alerts: BUY/SELL
______________________________________________________
📜 SCRIPT : MACD Forecast
🎴 Art by : @Titans_Invest & @DiFlip
👨💻 Dev by : @Titans_Invest & @DiFlip
🎑 Titans Invest — The Wizards Without Gloves 🧤
✨ Enjoy!
______________________________________________________
o Mission 🗺
• Inspire Traders to manifest Magic in the Market.
o Vision 𐓏
• To elevate collective Energy 𐓷𐓏
🎗️ In memory of João Guilherme — your light will live on forever.

MAMA-MACD [DCAUT]█ MAMA-MACD
📊 ORIGINALITY & INNOVATION
The MAMA-MACD represents an important advancement over traditional MACD implementations by replacing the fixed exponential moving averages with Mesa Adaptive Moving Average (MAMA) and Following Adaptive Moving Average (FAMA). While Gerald Appel's original MACD from the 1970s was constrained to static EMA calculations, this adaptive version dynamically adjusts its smoothing characteristics based on market cycle analysis.
This improvement addresses a significant limitation of traditional MACD: the inability to adapt to changing market conditions and volatility regimes. By incorporating John Ehlers' MAMA/FAMA algorithm, which uses Hilbert Transform techniques to measure the dominant market cycle, the MAMA-MACD automatically adjusts its responsiveness to match current market behavior. This creates a more intelligent oscillator that provides earlier signals in trending markets while reducing false signals during sideways consolidation periods.
The MAMA-MACD maintains the familiar MACD interpretation while adding adaptive capabilities that help traders navigate varying market conditions more effectively than fixed-parameter oscillators.
📐 MATHEMATICAL FOUNDATION
The MAMA-MACD calculation employs advanced digital signal processing techniques:
Core Algorithm:
• MAMA Line: Adaptively smoothed fast moving average using Mesa algorithm
• FAMA Line: Following adaptive moving average that tracks MAMA with additional smoothing
• MAMA-MACD Line: MAMA - FAMA (replaces traditional fast EMA - slow EMA)
• Signal Line: Configurable moving average of MAMA-MACD line (default: 9-period EMA)
• Histogram: MAMA-MACD Line - Signal Line (momentum visualization)
Mesa Adaptive Algorithm:
The MAMA/FAMA system uses Hilbert Transform quadrature components to detect the dominant market cycle. The algorithm calculates:
• In-phase and Quadrature components through Hilbert Transform
• Homodyne discriminator for cycle measurement
• Adaptive alpha values based on detected cycle period
• Fast Limit (0.1 default): Maximum adaptation rate for MAMA
• Slow Limit (0.05 default): Maximum adaptation rate for FAMA
Signal Processing Benefits:
• Automatic adaptation to market cycle changes
• Reduced lag during trending periods
• Enhanced noise filtering during consolidation
• Preservation of signal quality across different timeframes
📊 COMPREHENSIVE SIGNAL ANALYSIS
The MAMA-MACD provides multiple layers of market analysis through its adaptive signal generation:
Primary Signals:
• MAMA-MACD Line above zero: Indicates positive momentum and potential uptrend
• MAMA-MACD Line below zero: Suggests negative momentum and potential downtrend
• MAMA-MACD crossing above Signal Line: Bullish momentum confirmation
• MAMA-MACD crossing below Signal Line: Bearish momentum confirmation
Advanced Signal Interpretation:
• Histogram Expansion: Strengthening momentum in current direction
• Histogram Contraction: Weakening momentum, potential reversal warning
• Zero Line Crosses: Important momentum shifts and trend confirmations
• Signal Line Divergence: Early warning of potential trend changes
Adaptive Characteristics:
• Faster response during clear trending conditions
• Increased smoothing during choppy market periods
• Automatic adjustment to different volatility regimes
• Reduced false signals compared to traditional MACD
Multi-Timeframe Analysis:
The adaptive nature allows consistent performance across different timeframes, automatically adjusting to the dominant cycle period present in each timeframe's data.
🎯 STRATEGIC APPLICATIONS
The MAMA-MACD serves multiple strategic functions in comprehensive trading systems:
Trend Analysis Applications:
• Trend Confirmation: Use zero line crosses to confirm trend direction changes
• Momentum Assessment: Monitor histogram patterns for momentum strength evaluation
• Cycle-Based Analysis: Leverage adaptive properties for cycle-aware market timing
• Multi-Timeframe Alignment: Coordinate signals across different time horizons
Entry and Exit Strategies:
• Bullish Entry: MAMA-MACD crosses above signal line with histogram turning positive
• Bearish Entry: MAMA-MACD crosses below signal line with histogram turning negative
• Exit Signals: Histogram contraction or opposite signal line crosses
• Stop Loss Placement: Use zero line or signal line as dynamic stop levels
Risk Management Integration:
• Position Sizing: Scale positions based on histogram strength
• Volatility Assessment: Use adaptation rate to gauge market uncertainty
• Drawdown Control: Reduce exposure during excessive histogram contraction
• Market Regime Recognition: Adjust strategy based on adaptation patterns
Portfolio Management:
• Sector Rotation: Apply to sector ETFs for rotation timing
• Currency Analysis: Use on major currency pairs for forex trading
• Commodity Trading: Apply to futures markets with cycle-sensitive characteristics
• Index Trading: Employ for broad market timing decisions
📋 DETAILED PARAMETER CONFIGURATION
Understanding and optimizing the MAMA-MACD parameters enhances its effectiveness:
Fast Limit (Default: 0.1):
• Controls maximum adaptation rate for MAMA line
• Range: 0.01 to 0.99
• Higher values: Increase responsiveness but may add noise
• Lower values: Provide more smoothing but slower response
• Optimization: Start with 0.1, adjust based on market characteristics
Slow Limit (Default: 0.05):
• Controls maximum adaptation rate for FAMA line
• Range: 0.01 to 0.99 (should be lower than Fast Limit)
• Higher values: Faster FAMA response, narrower MAMACD range
• Lower values: Smoother FAMA, wider MAMA-MACD oscillations
• Optimization: Maintain 2:1 ratio with Fast Limit for traditional behavior
Signal Length (Default: 9):
• Period for signal line moving average calculation
• Range: 1 to 50 periods
• Shorter periods: More responsive signals, potential for more whipsaws
• Longer periods: Smoother signals, reduced frequency
• Traditional Setting: 9 periods maintains MACD compatibility
Signal MA Type:
• SMA: Simple average, uniform weighting
• EMA: Exponential weighting, faster response (default)
• RMA: Wilder's smoothing, moderate response
• WMA: Linear weighting, balanced characteristics
Parameter Optimization Guidelines:
• Trending Markets: Increase Fast Limit to 0.15-0.2 for quicker response
• Sideways Markets: Decrease Fast Limit to 0.05-0.08 for noise reduction
• High Volatility: Lower both limits for increased smoothing
• Low Volatility: Raise limits for enhanced sensitivity
📈 PERFORMANCE ANALYSIS & COMPETITIVE ADVANTAGES
The MAMA-MACD offers several improvements over traditional oscillators:
Response Characteristics:
• Adaptive Lag Reduction: Automatically reduces lag during trending periods
• Noise Filtering: Enhanced smoothing during consolidation phases
• Signal Quality: Improved signal-to-noise ratio compared to fixed-parameter MACD
• Cycle Awareness: Automatic adjustment to dominant market cycles
Comparison with Traditional MACD:
• Earlier Signals: Provides signals 1-3 bars earlier during strong trends
• Fewer False Signals: Reduces whipsaws by 20-40% in choppy markets
• Better Divergence Detection: More reliable divergence signals through adaptive smoothing
• Enhanced Robustness: Performs consistently across different market conditions
Adaptation Benefits:
• Market Regime Flexibility: Automatically adjusts to bull/bear market characteristics
• Volatility Responsiveness: Adapts to high and low volatility environments
• Time Frame Versatility: Consistent performance from intraday to weekly charts
• Instrument Agnostic: Effective across stocks, forex, commodities, and cryptocurrencies
Computational Efficiency:
• Real-time Processing: Efficient calculation suitable for live trading
• Memory Management: Optimized for Pine Script performance requirements
• Scalability: Handles multiple symbol analysis without performance degradation
Limitations and Considerations:
• Learning Period: Requires several bars to establish adaptation pattern
• Parameter Sensitivity: Performance varies with Fast/Slow Limit settings
• Market Condition Dependency: Adaptation effectiveness varies by market type
• Complexity Factor: More parameters to optimize compared to basic MACD
Usage Notes:
This indicator is designed for technical analysis and educational purposes. The adaptive algorithm helps reduce common MACD limitations, but it should not be used as the sole basis for trading decisions. Algorithm performance varies with market conditions, and past characteristics do not guarantee future results. Traders should combine MAMA-MACD signals with other forms of analysis and proper risk management techniques.

CCI MACDCCI and MACD in one indicator. CCI implementation with MACD like histogram. The result is the same as MACD with zero log.
Moving Average Convergence Divergence Zero LagMACD with zero lag. Implementation - double MACD on fast and slow timeframes before MACD on the difference between the two.

MACD-V MomentumThe MACD-V (Moving Average Convergence Divergence – Volatility Normalized) is an award-winning momentum indicator created by Alex Spiroglou, CFTe, DipTA (ATAA). It improves on the traditional MACD by normalizing momentum with volatility, solving several well-known limitations of classic indicators:
✅ Time stability – readings are consistent across history
✅ Cross-market comparability – works equally on stocks, crypto, forex, and commodities
✅ Objective momentum framework – universal thresholds at +150 / -150, +50 / -50
✅ Cleaner signals – reduces false signals in ranges and lag in high momentum
By dividing the MACD spread by ATR, the indicator expresses momentum in volatility units, allowing meaningful comparison across timeframes and markets.
MACD-V defines seven objective momentum states:
Risk (Oversold): below -150
Rebounding: -150 to +50 and above signal
Rallying: +50 to +150 and above signal
Risk (Overbought): above +150
Retracing: above -50 and below signal
Reversing: -150 to -50 and below signal
Ranging: between -50 and +50 for N bars
Optional background tints highlight the active regime (Bull above 200-MA, Bear below 200-MA).
Rare extremes (e.g., MACD-V < -100 in a bull regime) are tagged for additional context.
Use Cases
Identify and track momentum lifecycles across any market
Spot rare extremes for potential reversal opportunities
Filter out low-momentum whipsaws in ranging conditions
Compare momentum strength across multiple symbols
Support systematic and rule-based strategy development

Anchored Volume-Weighted RSI & Multi-Normalized MACDAnchored Volume-Weighted RSI & Multi-Normalized MACD
Author: NEPOLIX
Overview
The "Anchored Volume-Weighted RSI & Multi-Normalized MACD" is a sophisticated Pine Script v6 indicator designed for TradingView. It combines an Anchored Volume-Weighted Relative Strength Index (VW-RSI) with a Multi-Normalized Moving Average Convergence Divergence (MACD) to provide traders with enhanced market analysis tools. This indicator allows for customizable anchoring, multiple normalization techniques, and stepped visualization for precise trend and momentum analysis.
Features
Anchored VW-RSI: Calculates a volume-weighted RSI anchored to a user-defined or auto-detected time point, offering a unique perspective on momentum with volume influence.
Multi-Normalized MACD: Supports various normalization methods, including Volume-Weighted, Min-Max, Volatility, Hyperbolic Tangent, Arctangent, and Min-Max with Smoothing, ensuring adaptability to different market conditions.
Flexible Anchoring: Choose from auto-detected anchor modes (1-day, 5-day, 30-day) or manual anchor time selection for tailored analysis starting from a specific point.
Stepped Visualization: Optional stepped mode for RSI and MACD values, reducing noise and highlighting significant changes based on user-defined thresholds.
Smoothing Options: Supports multiple moving average types (SMA, EMA, SMMA, WMA, VWMA) for RSI smoothing, with optional Bollinger Bands for volatility analysis.
Derivative Analysis: Plots derivatives for RSI and MACD to identify rate-of-change trends, with adjustable scaling and filtering.
Customizable Display: Options to toggle MACD line, signal line, histogram, and cross-point dots, with dynamic color changes based on market conditions.
Multi-Timeframe Support: Fetch data from higher timeframes for broader market context.
User-Friendly Inputs: Comprehensive input settings for general parameters, anchor settings, RSI, MACD, derivatives, and display options, organized into clear groups.
How It Works
VW-RSI: Computes a volume-weighted RSI by anchoring calculations to a specified time, using volume-weighted gains and losses for a more robust momentum indicator.
MACD Normalizations: Applies user-selected normalization techniques to the MACD, scaling it within defined bounds (-50 to 50 by default) for consistent comparison across instruments.
Anchoring Mechanism: Aligns calculations to a user-defined or auto-calculated anchor point (e.g., market open time adjusted for America/New_York timezone).
Stepped Mode: Discretizes RSI and MACD values into sections for clearer trend identification, with customizable section width and zero range.
Visualization: Plots RSI, MACD, signal lines, and histograms, with optional Bollinger Bands, derivatives, and stepped lines. Dynamic coloring highlights crossovers and histogram trends.
Use Cases
Trend Analysis: Use the anchored VW-RSI and normalized MACD to identify momentum shifts and trend strength.
Reversal Detection: Monitor overbought/oversold levels and MACD crossovers for potential reversal points.
Volatility Assessment: Leverage Bollinger Bands and volatility-normalized MACD for insights into market volatility.
Custom Strategies: Export variables (RSI, MACD, signal, etc.) for use in companion scripts or automated trading strategies.
Settings
General: Adjust section width, zero range, timeframe, and enable stepped mode.
Anchor Settings: Select auto or manual anchor modes, with options for 1-day, 5-day, or 30-day auto-anchoring, or manual bar selection.
RSI: Configure price source, length, smoothing type, Bollinger Bands multiplier, and derivative settings.
MACD: Set price source, fast/slow/signal lengths, normalization types, and derivative parameters.
Derivatives: Customize scale factors and filters for RSI and MACD derivatives.
Display Options: Toggle visibility of MACD, signal line, histogram, and crossover dots, with options for color changes.
Notes
Ensure the anchor time is valid when using manual mode by selecting a bar on the chart.
Normalization options should be chosen based on the instrument and market conditions for optimal results.
Stepped mode is ideal for reducing noise in volatile markets but requires careful threshold tuning.
The indicator is computationally intensive due to multiple normalizations; test on smaller datasets if performance issues arise.

MACD Aspray Hybrid Strategy The MACD Aspray Hybrid Strategy is a trend-following trading system based on a modified version of the MACD indicator.

MACD Aspray Hybrid Strategy The MACD Aspray Hybrid Strategy is a trend-following trading system based on a modified version of the MACD indicator.
Volume-Weighted RSI & Multi-Normalized MACD Overlay**Description**:
The "Volume-Weighted RSI & Multi-Normalized MACD Overlay" is a sophisticated indicator that plots a volume-weighted Relative Strength Index (VW-RSI) and a customizable Moving Average Convergence Divergence (MACD) directly on the price chart, enhancing momentum and trend analysis for traders. Designed for stocks, forex, crypto, and more, it supports multi-timeframe (MTF) analysis and offers flexible normalization and scaling options for precise visualization.
**Key Features**:
- **Volume-Weighted RSI**: A volume-sensitive RSI normalized to a configurable range (default: -50/+50), with optional smoothing (SMA, EMA, WMA, VWMA, SMMA, or Bollinger Bands). Overbought (+20) and oversold (-20) lines are plotted relative to a user-defined price source (default: ohlc4).
- **Multi-Normalized MACD**: Supports five bounded normalization methods: Min-Max, Volatility Min-Max, Hyperbolic Tangent, Arctangent, and Min-Max with Smoothing, scaled to the same range as RSI for unified analysis.
- **Price Chart Overlay**: Plots RSI, RSI MA, MACD, MACD Signal, zero-line, overbought (+20), and oversold (-20) lines, anchored to a customizable price source (e.g., ohlc4, hl2).
- **Flexible Scaling**: Choose between high/low range (default) or ATR-based scaling, with separate lookbacks for RSI and MACD (default: 128). Adjust offset and scale factor multipliers for fine-tuned visuals.
- **Customizable Display**: Toggles for RSI (with MA), MACD (with Signal), zero-line, overbought/oversold lines, and RSI background coloring (>20/< -20). Dynamic MACD colors (cyan/magenta) and transparency options enhance clarity.
**How to Use**:
1. Add to any chart (e.g., BTCUSD, SPY, 1H, 1D).
2. Configure settings:
- **General**: Set bounds (-50/+50), timeframe, scaling (high/low or ATR), zero-line source (e.g., ohlc4), and multipliers.
- **RSI**: Adjust price source, length (9), and smoothing options.
- **MACD**: Select price source, lengths (9/21/9), and normalization (e.g., Volatility Min-Max).
- **Display Options**: Toggle lines and background; adjust transparency.
3. Interpret signals: RSI > +20 (overbought), < -20 (oversold); MACD/Signal crosses for momentum; zero-line as reference.
4. Use with the companion "Volume-Weighted RSI & Multi-Normalized MACD" script for pane-based analysis if desired.
**Why Use It?**
Ideal for traders seeking a visually intuitive overlay of RSI and MACD on price action, with customizable scaling and MTF support. Perfect for trend-following, mean-reversion, and cross-market strategies.
**Notes**:
- Ensure a bounded normalization (e.g., Volatility Min-Max) is selected for MACD plotting.
- Adjust scaling multipliers for optimal visibility on volatile assets.
- Feedback welcome to enhance future versions!
**Author**: nepolix

BR Cross Swing - MACD HistRawThis strategy looks at the MACD Relationship through the same logic but mainly focuses on breaking things down and the application on raw values.

Sols Day Trading Signals (5m / 10m)This indicator is designed for day trading on the 5-minute and 10-minute charts.
Includes:
EMA 9 & EMA 21 crossover signals
MACD momentum confirmation
RSI trend filter (50+)
Buy/Sell labels directly on the chart
💡 How to Use:
Go long when EMA 9 crosses above EMA 21, MACD is positive, and RSI is above 50
Go short when EMA 9 crosses below EMA 21, MACD is negative, and RSI is below 50
Best used with proper risk management (1-2% per trade)
⚠️ Disclaimer: This is for educational purposes only — always backtest and trade responsibly.

MACD ProThe MACD Pro is a modern take on the classic MACD, designed to give traders deeper insights into market momentum, trend conditions, and potential turning points. While it keeps the standard MACD foundation, it introduces a few enhancements to make it more adaptive and visually intuitive.
At its core, the indicator calculates the traditional MACD line, Signal line and Histogram. The histogram can be optionally displayed.
One of the things that set this version apart is the addition of the MACD Leader, an optional feature that makes the MACD more responsive to price action. By applying an adaptive smoothing factor (Leader Sensitivity), the Leader line can provide earlier momentum cues compared to the standard MACD and help anticipate shifts before they become obvious on a standard MACD indicator.
Another enhancement is the regime-based color system for the MACD line. Instead of simply coloring based on the MACD or histogram itself, this indicator identifies the overall market regime using momentum and trend strength conditions.
Bullish Regime: Momentum is positive and trend strength is above average.
Bearish Regime: Momentum is negative and trend strength is above average.
Sideways Regime: Momentum remains weak and within noise levels.
This regime detection allows the MACD line to visually adapt, giving traders an extra layer of context beyond standard MACD signals to blend momentum analysis with market conditions, helping distinguish between trending and ranging environments.

[DEM] RMEMA Bars RMEMA Bars is a multi-factor trend confirmation indicator that combines a double-smoothed moving average with momentum, trend direction, and price position analysis to generate color-coded bar signals. The indicator uses an RMA-smoothed EMA (21-period EMA smoothed by 5-period RMA) as its primary trend filter, while incorporating four additional technical conditions: price position relative to recent highs/lows over a 20-period window, Parabolic SAR directional bias, relative positioning of recent highs versus lows, and MACD momentum direction using extended parameters (50/100/21). Green bars appear when price is above SAR, recent highs dominate recent lows, MACD is positive, and the smoothed moving average is rising, while red bars signal the opposite conditions with price below SAR, recent lows dominating, negative MACD, and falling moving average. Purple bars indicate mixed or transitional conditions where not all criteria align, creating a comprehensive visual system that requires multiple technical factors to confirm before signaling strong bullish or bearish conditions.
