Indicator420double hull moving average crossover
hull moving average / volume weighted moving average crossover
Red dot = SELL
Green dot = BUY
or
Longest MA color change to green = BUY
Longest MA color change to red = SELL
by SeaSide420
Moving

Double HullMA CrossThe Hull Moving Average (HMA), developed by Alan Hull, is an extremely fast and smooth moving average. In fact, the HMA almost eliminates lag altogether and manages to improve smoothing at the same time. The Hull Moving Average solves the dilemma of making a moving average more responsive to current price activity whilst maintaining curve smoothness. (hoping in less false signals).
indicator doubles the input value to make the second HullMA value, then marks the crossover


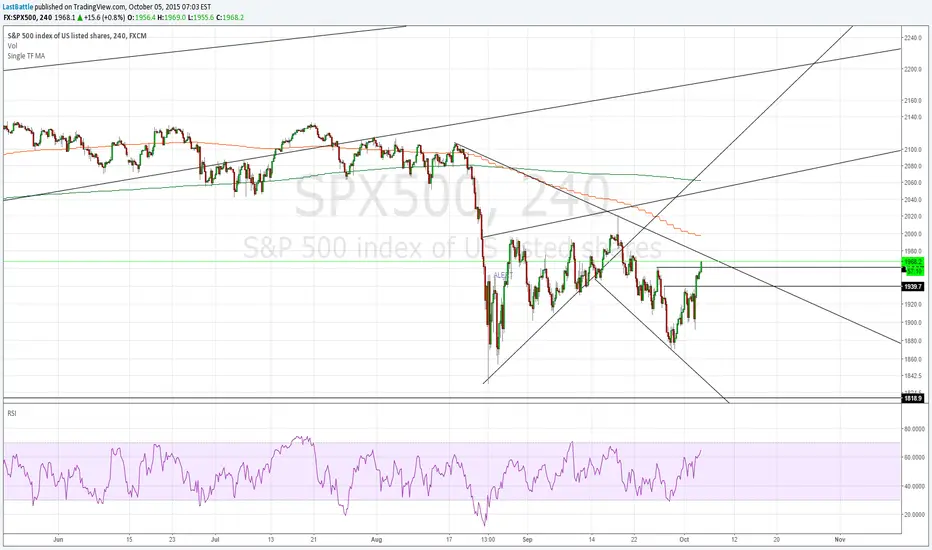
Single Timeframe Moving AverageProvides Moving average of 200 and 50 at the specific timeframe regardless of what interval you're looking at.
Saving the need to change it manually each time you switch the interval.
In this chart, I am looking at 4H interval with EMA of 50/200 of daily timeframe.
Humble Student OB/OS Trifecta indicatorAfter reading Cam Hui's blog post about his "Trifecta" bottom spotting model I thought I'd try my hand at scripting it as an indicator. The results are pretty close to what he describes. Though the data TradingView feeds me doesn't seem to be identical to what he's using on StockCharts.com the results are close enough that I will call the effort a success worth publishing.

[RS]Multiple Moving Average Candle System V0double ma system built into candle sticks,
wick, above body shows true high, under true low.
the body symbolizes the double ma's, colors for expansion/contraction of the ma's.
optional: can hide true close point(black dots)
good usage with rsi candles:

TUX 1h-15m Time TrendThis indicator takes the SMA of the current 1 hour chart and the 15 minute chart of the current symbol.
When the close is below the SMA it shows a red line, when it is above it shows a green line.
When both are red, its in a down trend (Short).
When both lines are green, its in an uptrend (Long).
You can change the SMA in the settings.
Good luck!

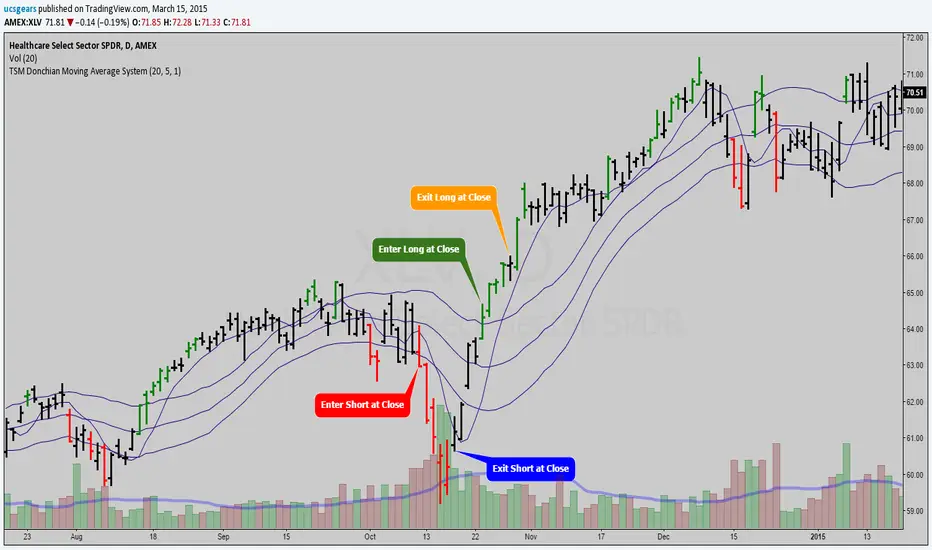
TSM Donchian Moving Average System_by_ucsgearsThis is just the raw code for the system / strategies.
Will Complete this when I get more time.
Green - Setup Long
Red - Setup Short
Madrid Moving AverageThis plots the moving averages, either exponential or standard. When it is declining it shows the MA in red, green when rising.
Trading MA: Bullish when it is rising, Bearish when it is falling

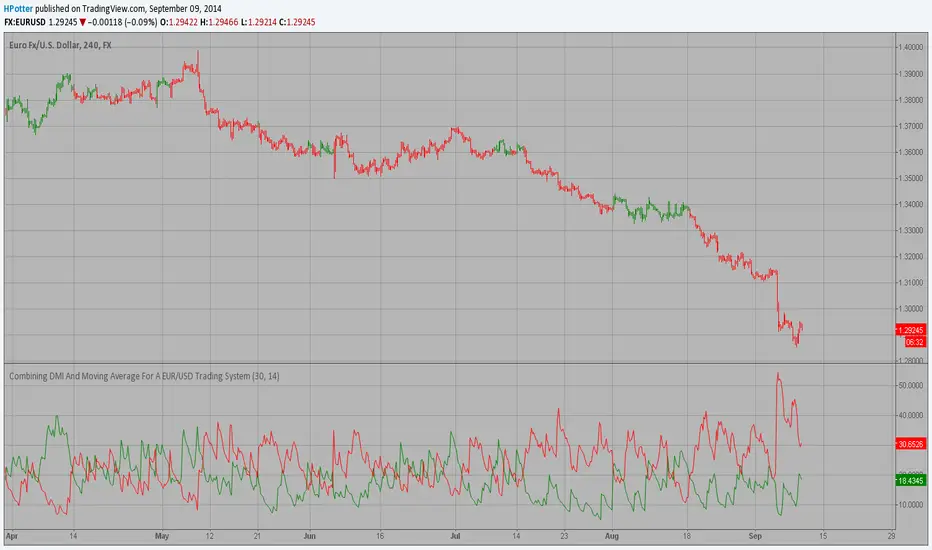
Combining DMI And Moving Average For A EUR/USD Trading SystemCombining DMI And Moving Average For A EUR/USD Trading System, by Rombout Kerstens
The related article is copyrighted material from Stocks & Commodities Aug 2009
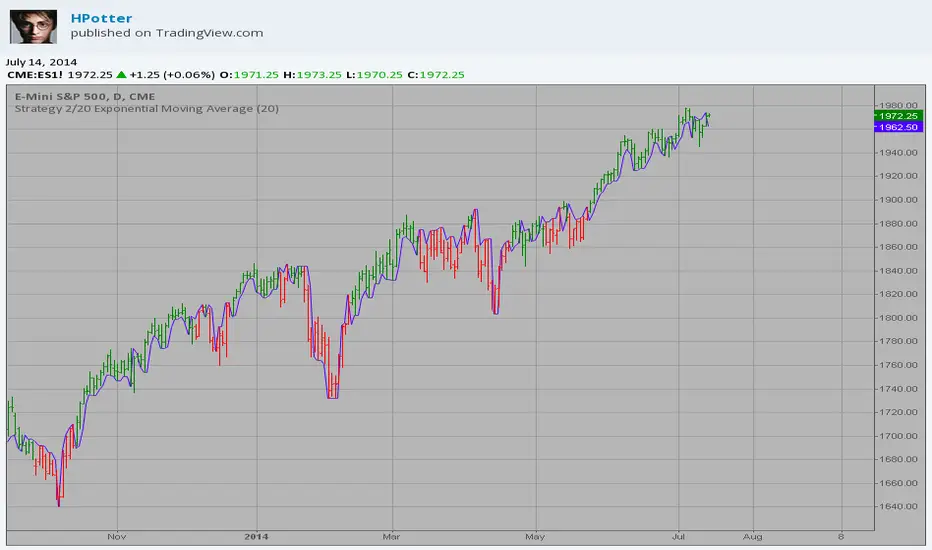
Strategy 2/20 Exponential Moving Average Strategy.
This indicator plots 2/20 exponential moving average. For the Mov
Avg X 2/20 Indicator, the EMA bar will be painted when the Alert criteria is met.
You can use in the xPrice any series: Open, High, Low, Close, HL2, HLC3, OHLC4 and ect...
2/20 Exponential Moving Average This indicator plots 2/20 exponential moving average. For the Mov
Avg X 2/20 Indicator, the EMA bar will be painted when the Alert criteria is met.
You can use in the xPrice any series: Open, High, Low, Close, HL2, HLC3, OHLC4 and ect...

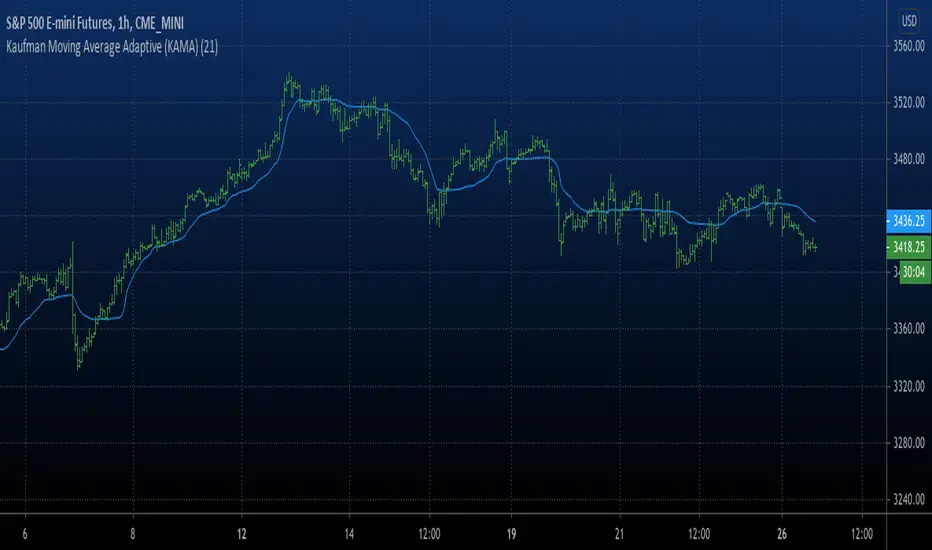
Kaufman Moving Average Adaptive (KAMA) Everyone wants a short-term, fast trading trend that works without large
losses. That combination does not exist. But it is possible to have fast
trading trends in which one must get in or out of the market quickly, but
these have the distinct disadvantage of being whipsawed by market noise
when the market is volatile in a sideways trending market. During these
periods, the trader is jumping in and out of positions with no profit-making
trend in sight. In an attempt to overcome the problem of noise and still be
able to get closer to the actual change of the trend, Kaufman developed an
indicator that adapts to market movement. This indicator, an adaptive moving
average (AMA), moves very slowly when markets are moving sideways but moves
swiftly when the markets also move swiftly, change directions or break out of
a trading range.