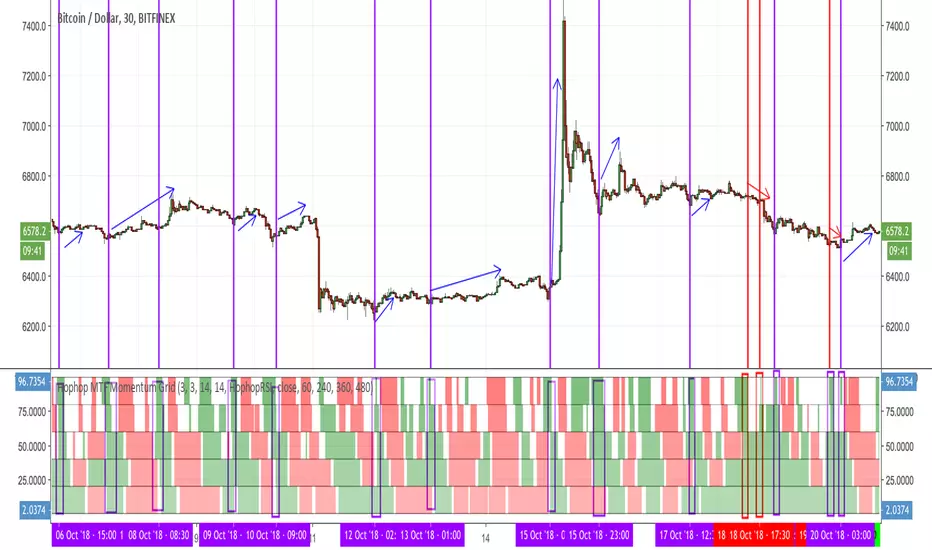
Hophop Multiple Timeframe Momentum GridThis indicator is intended to highlight the over bought and over sold momentums for multiple timeframe
As of now it only supports StochRSI and also a variation of it that is more responsive than StochRsi called HophopRsi, I might consider adding more momentum indicators if it is desired
All the needed variables for StochRsi are included as the original indicator, feel free to change them as you normally do on StochRsi
On top of that you can select up to 4 higher timeframe , just make sure that your current timeframe is the smallest one
The top line of the graph shows the current timeframe momentum
1st line = high timeframe 1
2st line = high timeframe 2
3st line = high timeframe 3
4st line = high timeframe 4
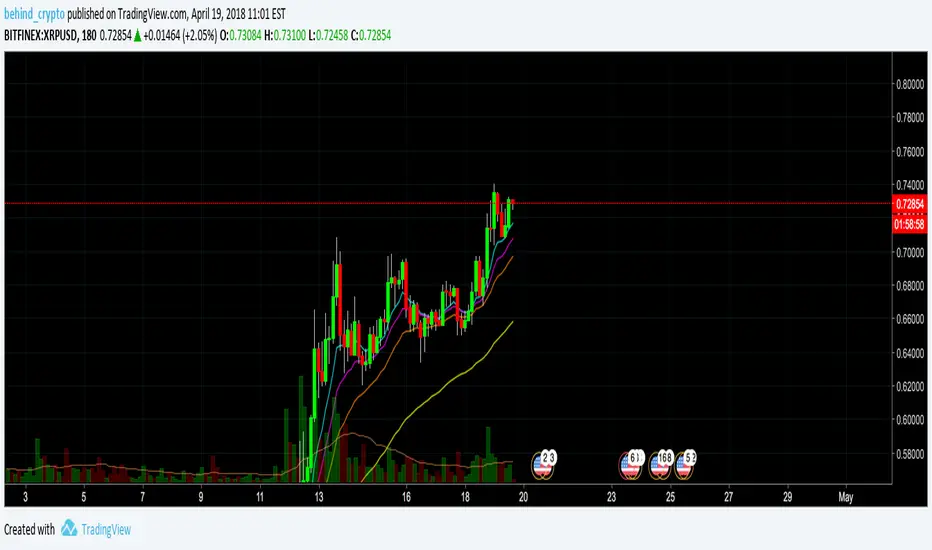
Quick demonstration of the usage:
If you benefit from this indicator and you would like to see more of these, please support me by your tips
BTC Tip: 39bwXN1chms1yHskBaYwz76UhDakc7grJ7
LTC Tip: MGD3U9dBCBVctwnoCa1grU8ompxG6hUhMk
ETH Tip: 0xEE9684a5aceE85036527aB48E596DeE4627bD84b
Multiple

Moving Average 6xDisplays up to six moving averages at a time in one indicator.
Default: 5, 10, 20, 50, 100, 200

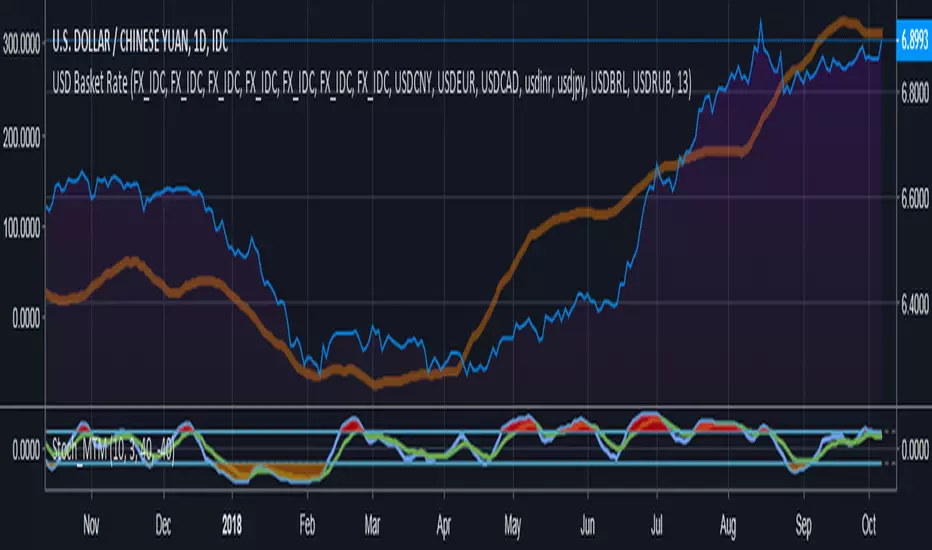
Compare currency against multiple (Basket of currencies)Early version of a script to compare one currency against multiple to get an index.
Default values loaded basically make something along the lines of, "USD global exchange rate"
I plan on making this less clunky/messy in future with respect to the coding and the user inputs. Works 100% right now though.
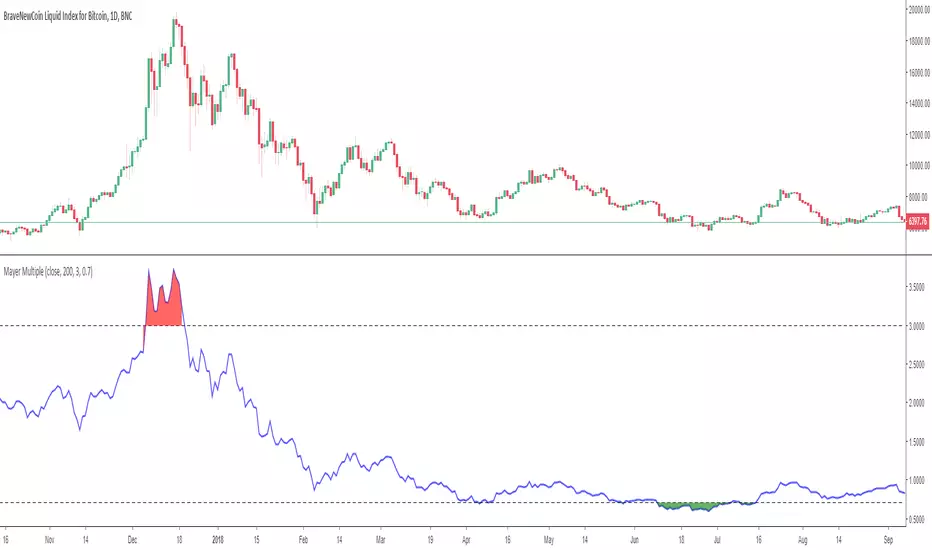
HSS Bitcoin Mayer MultipleIntroducing the Mayer Multiple script…the Mayer Multiple looks over extended periods of time and pinpoints when a cryptocurrency was overbought/sold. The calculation itself is simply the price of the cryptocurrency divided by the 200-day SMA. The default settings are based on Trace Mayer’s recommended numbers but can be adjusted to satisfy your own preferences.
So check it out – I hope you find it useful. As always, this indicator/script should not be taken as trading or financial advice of any kind; it should be used for educational purposes only.

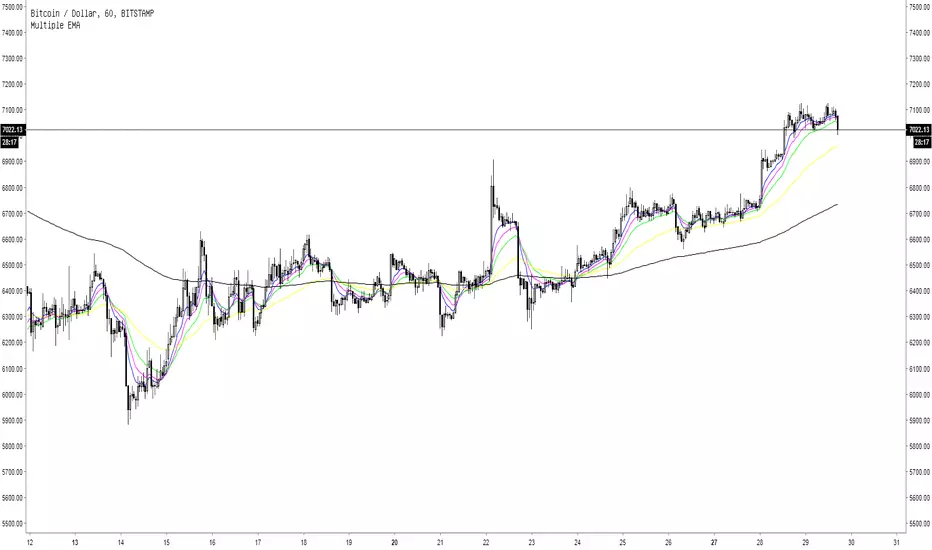
Multiple EMA5 Exponential Moving Averages
EMA 1: length 8, blue line
EMA 2: length 13, pink line
EMA 3: length 21, green line
EMA 4: length 55, yellow line
EMA 5: length 200, black line
Multiple Moving Averages [clean]Very simple indicator script to display multiple simple moving averages. I know others have made this but they often are too feature-rich and can get cluttered.
Can optionally show a cross when MA 1 crosses MA 3. These are colors such that when MA 1 crosses BELOW MA 3 a red cross is shown, and green when crossing above.

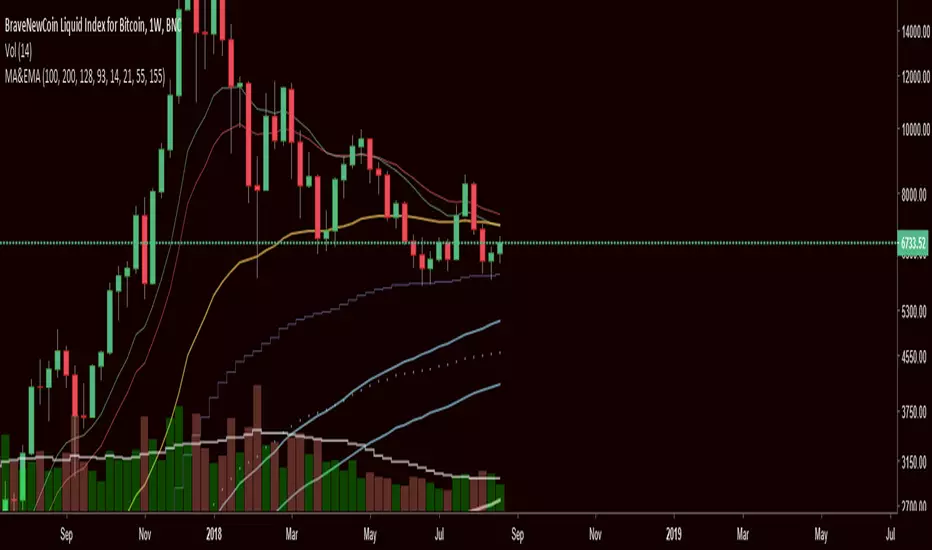
Multiple MAs & EMAsMultiple MA & EMA for swing and scalp trading. Good for every timeframe with specific MA's for weekly.
Suited for Bitcoin. Change the MA periods if you want to use it on other assets.
Seven Moving AvveragesThis is a simple yet very flexible moving average script. There are more than few moving average scripts out there but non of them are as flexible as this one.
This script lets you have seven different moving averages. Each moving average can be set separately, each can :
1- switch the moving average between EMA and SMA
2- set the flat percentage, this setting will be used to determine where we don't have trend in that moving average to set the color to black (default)
3- set the source
You can easily set the colors in the style tab.
This script was developed by request of few of my friends.

Multiple Moving Averages using only 1 indicator! (configurable)Simple modification to an existing script that allows for configurable MA lookback-lengths

Multiple Moving Averages A&GMultiple Moving Averages A&G in an indicator
1.- ema 4
2.- ema 9
3.- ema 18
4.- ma 200
5.- ma 200
everything is customizable!!
ENJOY
By: AlexVille

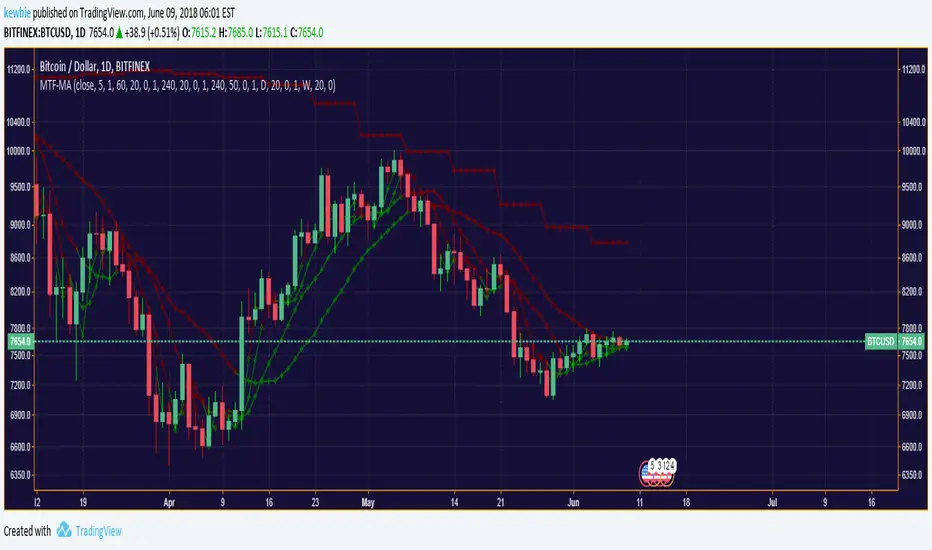
Multiple Timeframe Moving Average SystemModified code from ChrisMoody, RicardoSantos & Ricardo M Arjona.
Allows for multiple moving average types across custom time-frames.
Multiple Ema 8/13/21/55 by melihgulerIn one graph, 4 different periods include EMA (8/13/21/55). It is not recommended for short-term investments. You can get efficient results using at least 4 hours chart.
It is not an investment recommendation. Your use is at your own risk.

Multiple Ema 8/13/21/55 by melihgulerIn one graph, 4 different periods include EMA (8/13/21/55). It is not recommended for short-term investments. You can get efficient results using at least 4 hours chart.
It is not an investment recommendation. Your use is at your own risk.


Binque's Multi-Moving AverageMultiple Moving Averages - A Single indicator that will allow you to put 4 EMA, 5 MA, Hi MA and Lo MA with a single indicator. It also allow you to add verticle background stripes to make it easier to see your price lines.


SMA/EMA 12|26|50SMA/EMA 12|26|50
Exactly as title says
SMA is bold
EMA is light
Orange 12
Green 26
Blue 50

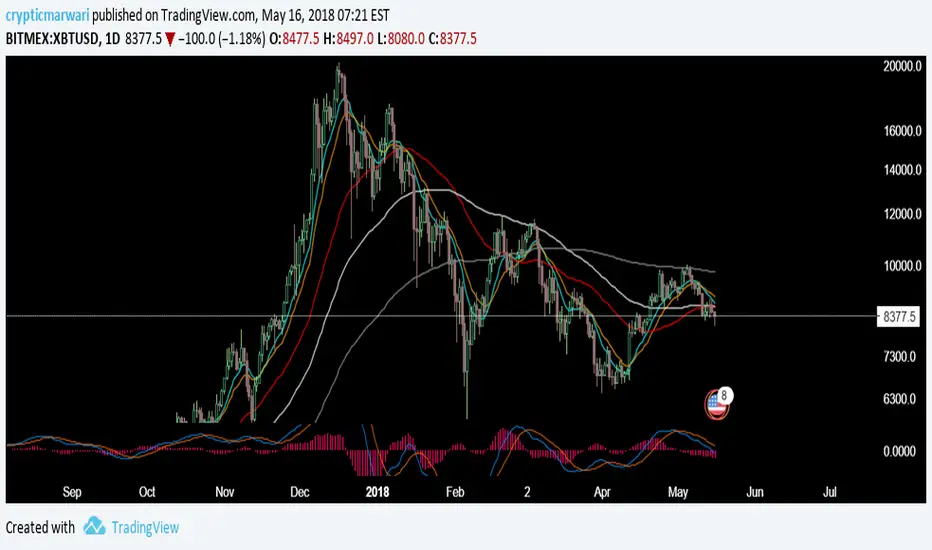
Multiple Moving Averages by CrypticMarwariMoving Averages - Mixed
Choose with ease from MA, WMA, EMA, DEMA, TEMA
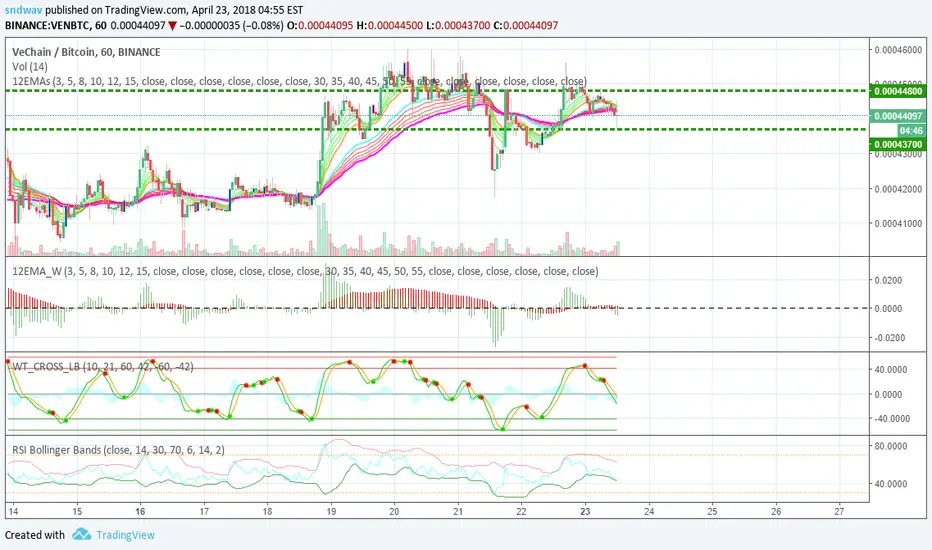
Frosted 12 EMA WIDTHThis is a complementary indicator for the 12 EMAs indicator ()
This width indicator shows the fanning width of each fan (shorter MAs and longer MAs).
To make things easier to see:
You can turn off one of the histograms to view just one of the widths (and add a 2nd instance of this indicator, turning off the other width).
Fibonacci Exponential Moving Averages ( EMA )Here you can have 4 EMA on one indicator. The inputs are for 8, 13, 21 and 55 previous open&close which are from Fibonacci sequence.
How to : To use the script, click on "Add to Favourite Scripts", then load the script from Indicators on the Chart.