Adaptive MTF Candle SeparatorAuto MTF candle separators that dynamically adapt to the current chart timeframe.
The indicator automatically draws higher-timeframe candle boundaries to help with structure, bias, and multi-timeframe analysis:
• 1m → 15m
• 5m → 1H
• 15m → 4H
• 1H → 1D
• 1D → 1W
• 1W → 1M
• 1M → 1Y
Designed for clean market structure visualization and higher-timeframe alignment.
Multipletimeframe

Ace Algo [Anson5129]🏆 Exclusive Indicator: Ace Algo
📈 Works for stocks, forex, crypto, indices
📈 Easy to use, real-time alerts, no repaint
📈 No grid, no martingale, no hedging
📈 One position at a time
----------------------------------------------------------------------------------------
Ace Algo
A trend-following TradingView strategy using a confluence of technical indicators and time-based rules for structured long/short entries and exits:
----------------------------------------------------------------------------------------
Parameters Explanation
Moving Average Length
Indicates the number of historical data points used for the average price calculation.
Shorter = volatile (short-term trends); longer = smoother (long-term trends, less noise).
Default: 20
Entry delay in bars
After a trade is closed, delay the next entry in bars. The lower the number, the more trades you will get.
Default: 4
Take Profit delay in bars
After a trade is opened, delay the take profit in bars. The lower the number, the more trades you will get.
Default: 3
Enable ADX Filter
No order will be placed when ADX < 20
Default: Uncheck
Block Period
Set a block period during which no trading will take place.
----------------------------------------------------------------------------------------
Entry Condition:
Only Long when the price is above the moving average (Orange line).
Only Short when the price is below the moving average (Orange line).
* Also, with some hidden parameter that I set in the backend.
Exit Condition:
When getting profit:
Trailing Stop Activates after a position has been open for a set number of bars (to avoid premature exits).
When losing money:
In a long position, when the price falls below the moving average, and the conditions for a short position are met, the long position will be closed, and the short position will be opened.
In a short position, when the price rises above the moving average, and the conditions for a long position are met, the short position will be closed, and the long position will be opened.
----------------------------------------------------------------------------------------
How to get access to the strategy
Read the author's instructions on the right to learn how to get access to the strategy.

The Trader's Edge (A professional Trader's tool)This is a script which is made by a professional stock trader and this script is capable of drawing Demand / Supply zones as well as capable of scoring the trade as well depending upon freshness, time spent in the zone, it also has the power to calculate the pre - defined risk to reward for every trade that you take as per this indicator. This script also displays the Trendo f the stock on 3 difrerent time frames on one single time frame easy to do multiple time frame analysis. and it also as the power of identifying which zones are falling outside "THE BOLLINGER BANDS" There by signaling an "ALL STAR ENTRY" This tool is A must have for any professional Stock trader.

Bollinger Band Screener [Pineify]Multi-Symbol Bollinger Band Screener Pineify – Advanced Multi-Timeframe Market Analysis
Unlock the power of rapid, multi-asset scanning with this original TradingView Pine Script. Expose trends, volatility, and reversals across your favorite tickers—all in a single, customizable dashboard.
Key Features
Screens up to 8 symbols simultaneously with individual controls.
Covers 4 distinct timeframes per symbol for robust, multi-timeframe analysis.
Integrates advanced Bollinger Band logic, adaptable with 11+ moving average types (SMA, EMA, RMA, HMA, WMA, VWMA, TMA, VAR, WWMA, ZLEMA, and TSF).
Visualizes precise state changes: Open/Parallel Uptrends & Downtrends, Consolidation, Breakouts, and more.
Highly interactive table view for instant signal interpretation and actionable alerts.
Flexible to any market: crypto, stocks, forex, indices, and commodities.
How It Works
For each chosen symbol and timeframe, the script calculates Bollinger Bands using your specified source, length, standard deviation, and moving average method.
Real-time state recognition assigns one of several states (Open Rising, Open Falling, Parallel Rising, Parallel Falling), painting the table with unique color codes.
State detection is rigorously defined: e.g., “Open Rising” is set when both bands and the basis rise, indicating strong up momentum.
All bands, signals, and strategies dynamically update as new bars print or user inputs change.
Trading Ideas and Insights
Identify volatility expansions and compressions instantly, spotting breakouts and breakdowns before they play out.
Spot multi-timeframe confluences—when trends align across several TFs, conviction increases for potential trades.
Trade reversals or continuations based on unique Bollinger Band patterns, such as squeeze-break or persistent parallel moves.
Harness this tool for scalping, swing trading, or systematic portfolio screens—your logic, your edge!
How Multiple Indicators Work Together
This screener’s core strength is its integration of multiple moving average types into Bollinger Band construction, not just standard SMA. Each average adapts the bands’ responsiveness to trend and noise, so traders can select the underlying logic that matches their market environment (e.g., HMA for fast moves or ZLEMA for smoothed lag). Overlaying 4 timeframes per symbol ensures trends, reversals, and volatility shifts never slip past your radar. When all MAs and bands synchronize across symbols and TFs, it becomes easy to separate real opportunity from market noise.
Unique Aspects
Perhaps the most flexible Bollinger Band screener for TradingView—choose from over 10 moving average methods.
Powerful multi-timeframe and multi-asset design, rare among Pine scripts.
Immediate visual clarity with color-coded table cells indicating band state—no need for guesswork or chart clutter.
Custom configuration for each asset and time slice to suit any trading style.
How to Use
Add the script to your TradingView chart.
Use the user-friendly input settings to specify up to 8 symbols and 4 timeframes each.
Customize the Bollinger Band parameters: source (price type), band length, standard deviation, and type of moving average.
Interpret the dashboard: Color codes and “state” abbreviations show you instantly which symbols and timeframes are trending, consolidating, or breaking out.
Take trades according to your strategy, using the screener as a confirmation or primary scan tool.
Customization
Fully customize: symbols, timeframes, source, band length, standard deviation multiplier, and moving average type.
Supports intricate watchlists—anything TradingView allows, this script tracks.
Adapt for cryptos, equities, forex, or derivatives by changing symbol inputs.
Conclusion
The Multi-Symbol Bollinger Band Screener “Pineify” is a comprehensive, SEO-optimized Pine Script tool to supercharge your market scanning, trend spotting, and decision-making on TradingView. Whether you trade crypto, stocks, or forex—its fast, intuitive, multi-timeframe dashboard gives you the informational edge to stay ahead of the market.
Try it now to streamline your trading workflow and see all the bands, all the trends, all the time!

Golden Cross Screener [Pineify]Golden Cross Screener Pineify – Multi-Symbol Trend Detection Screener for TradingView
Discover the Golden Cross Screener Pineify for TradingView: a multi-symbol, multi-timeframe indicator for crypto and other assets. Customizable Golden Cross detection, robust algorithm, and intuitive screener design for smarter portfolio trend analysis.
Key Features
Multi-symbol screening across major cryptocurrencies or assets – BTCUSD, ETHUSD, XRPUSD, USDT, BNB, SOLUSD, DOGEUSD, TRXUSD (fully customizable).
Multi-timeframe analysis (e.g., 1m, 5m, 10m, 30m), enabling robust trend detection from scalp to swing.
Customizable Moving Average settings for both Fast and Slow MA (source and length).
Efficient screener table, highlighting Golden Cross events and current asset trends in one panel.
Visual cues for bullish, bearish, and cross states using intuitive color-coding and labels.
Flexible symbol and timeframe inputs to tailor the screener to any portfolio or watchlist.
How It Works
The Golden Cross Screener Pineify leverages the classic Golden Cross methodology—a bullish trend signal triggered when a shorter-term moving average crosses above a longer-term moving average. To improve robustness, you are empowered to configure both Fast MA and Slow MA periods and sources, making the detection logic applicable to any symbol, timeframe, or asset class.
Internally, the script runs dedicated calculations on each chosen symbol and timeframe, generating independent signals using exponential moving averages (EMA). Using the TradingView `request.security` function, it fetches and processes price data for up to eight portfolio assets on four timeframes, displaying the detected Golden Cross, Bullish, or Bearish states in a central screener table.
Trading Ideas and Insights
Spot emerging bullish or bearish trends across your favorite crypto pairs or trading assets in real time.
Capture prime opportunities when multiple assets align with Golden Cross signals—ideal for portfolio rebalancing or rotational strategies.
Analyze trend consistency by monitoring cross events at multiple timeframes for a given asset.
Swiftly identify when short-term and long-term momentum diverge—flagging potential reversals or trend initiations.
The Golden Cross Screener Pineify is not just a trend signal; it’s a holistic multi-asset scanner built for traders who know the power of combining technical breadth with agile timing.
How Multiple Indicators Work Together
This screener stands out with its modular approach: each asset/timeframe pair is monitored in isolation, yet displayed collectively for multidimensional market insight. Each symbol’s price action is processed through independently configured EMAs—Fast and Slow—whose crossovers are analyzed for directional bias. The implementation’s real innovation is in its screener table engine: it aggregates signals, synchronizes timeframes, and color-codes market states, allowing users to see confluences, divergences, and sector trends at a glance.
Combining Golden Cross detection with customizable moving averages and flexible multi-timeframe, multi-symbol scanning means users can fine-tune sensitivity, focus on specific signals, and adapt screener logic for scalping, swing trading, or investing.
Unique Aspects
True multi-symbol screener within the TradingView indicator framework.
Full customization of screener assets, timeframes, and moving averages.
Advanced, efficient use of TradingView table for clear, actionable visualization.
No dependency on standard, static MA settings—adjust everything to match your strategy.
Big-picture and granular trend detection in one tool, designed for both active traders and portfolio managers.
How to Use
Add the Golden Cross Screener Pineify to your TradingView chart.
Choose up to eight symbols—crypto, stock, forex, or custom assets.
Set four timeframes for screening, from lower to higher intervals.
Adjust moving average sources (price, close, etc.) and period lengths for both Fast and Slow MAs to suit your trading style.
Interpret table cells: clear labels and color indicate Golden Cross (trend shift), Bullish (uptrend), Bearish (downtrend) states for each symbol/timeframe.
React to signal alignments—deploy or rebalance positions, increase alert sensitivity, or backtest sequence confluences.
Customization
The indicator’s inputs panel gives full control:
Select which symbols to screen, making it perfect for any asset watchlist.
Pick the desired timeframes—mix daily, hourly, or minute-based intervals.
Adjust Fast and Slow MA settings: switch source type, change period length, and fine-tune detection logic as needed.
Style your screener table via TradingView settings (colors, font sizes, alignment).
Every element is customizable—adapt the Golden Cross Screener Pineify for your specific portfolio, trading timeframe, and strategy focus.
Conclusion
The Golden Cross Screener Pineify elevates multi-symbol trend detection to a new level on TradingView. By combining configurable Golden Cross logic with a powerful screener engine, it serves both precision and broad market insight—crucial for agile traders and strategic portfolio managers. Whether you’re tracking crypto pairs, stocks, forex, or a mix, this tool transforms static trend analysis into an active, multi-dimensional trading edge.

MTF Oscillator Stack [BigBeluga]🔵 OVERVIEW
The MTF Oscillator Stack brings powerful multi-timeframe momentum analysis directly into your price chart. You can select one oscillator— RSI , MFI , or Stochastic RSI —and display it across up to 4 different timeframes. Each panel is neatly stacked horizontally above price , offering quick insight into cross-timeframe conditions like trend direction, exhaustion zones, and momentum shifts.
🔵 CONCEPTS
Single Oscillator Mode: Select one oscillator type (RSI, MFI, or Stoch RSI) to analyze across all selected timeframes.
Top-Chart Horizontal Panels: Oscillator plots are aligned horizontally at the top of the chart for seamless top-down reading.
Signal Comparison Arrows: Arrows (🢁 / 🢃) indicate oscillator position relative to its signal line.
Overbought/Oversold Zones: Transparent 30–70 fill zones highlight key reversal areas.
Dynamic Display Logic: Only enabled panels are shown; spacing adjusts based on active timeframes.
Timeframe Tagging: Each oscillator panel is labeled with its corresponding timeframe (e.g., 1H, 2H, 4H).
🔵 FEATURES
Choose one oscillator (RSI, MFI, or Stoch RSI) and apply it across up to 4 timeframes.
Each oscillator panel includes: price-synced plot, signal line, and zone shading.
Scale alignment allows users to place charts at the bottom or top.
Clear arrow signals show whether oscillator is bullish or bearish.
Individual length and signal settings per timeframe.
Toggle for alignment mode: evenly spaced or floating layout.
All panels use a consistent layout for faster decision-making.
🔵 HOW TO USE
Select your preferred oscillator and activate 2–4 key timeframes (e.g., 1H, 4H, D1, W1).
Use signal crossovers as a bullish (🢁) or bearish (🢃) trend cue.
Look for aligned extremes (e.g., all timeframes overbought) to spot momentum exhaustion.
Ideal for momentum confluence strategies and top-down confirmation.
Use horizontal layout to stay focused on price while assessing broader structure.
🔵 CONCLUSION
MTF Oscillator Stack simplifies complex multi-timeframe momentum analysis into one clean, actionable visual. Whether you're tracking RSI, MFI, or Stoch RSI, this tool helps you stay aligned with the broader trend—without ever leaving your main chart.

Multi-Timeframe Continuity Custom Candle ConfirmationMulti-Timeframe Continuity Custom Candle Confirmation
Overview
The Timeframe Continuity Indicator is a versatile tool designed to help traders identify alignment between their current chart’s candlestick direction and higher timeframes of their choice. By coloring bars on the current chart (e.g., 1-minute) based on the directional alignment with selected higher timeframes (e.g., 10-minute, daily), this indicator provides a visual cue for confirming trends across multiple timeframes—a concept known as Timeframe Continuity. This approach is particularly useful for day traders, swing traders, and scalpers looking to ensure their trades align with broader market trends, reducing the risk of trading against the prevailing momentum.
Originality and Usefulness
This indicator is an original creation, built from scratch to address a common challenge in trading: ensuring that price action on a lower timeframe aligns with the trend on higher timeframes. Unlike many trend-following indicators that rely on moving averages, oscillators, or other lagging metrics, this script directly compares the bullish or bearish direction of candlesticks across timeframes. It introduces the following unique features:
Customizable Timeframes: Users can select from a range of higher timeframes (5m, 10m, 15m, 30m, 1h, 2h, 4h, 1d, 1w, 1M) to check for alignment, making it adaptable to various trading styles.
Neutral Candle Handling: The script accounts for neutral candles (where close == open) on the current timeframe by allowing them to inherit the direction of the higher timeframe, ensuring continuity in trend visualization.
Table: A table displays the direction of each selected timeframe and the current timeframe, helping identify direction in the event you don't want to color bars.
Toggles for Flexibility: Options to disable bar coloring and the debug table allow users to customize the indicator’s visual output for cleaner charts or focused analysis.
This indicator is not a mashup of existing scripts but a purpose-built tool to visualize timeframe alignment directly through candlestick direction, offering traders a straightforward way to confirm trend consistency.
What It Does
The Timeframe Continuity Indicator colors bars on your chart when the direction of the current timeframe’s candlestick (bullish, bearish, or neutral) aligns with the direction of the selected higher timeframes:
Lime: The current bar (e.g., 1m) is bullish or neutral, and all selected higher timeframes (e.g., 10m) are bullish.
Pink: The current bar is bearish or neutral, and all selected higher timeframes are bearish.
Default Color: If the directions don’t align (e.g., 1m bar is bearish but 10m is bullish), the bar remains the default chart color.
The indicator also includes a debug table (toggleable) that shows the direction of each selected timeframe and the current timeframe, helping traders diagnose alignment issues.
How It Works
The script uses the following methodology:
1. Direction Calculation: For each timeframe (current and selected higher timeframes), the script determines the candlestick’s direction:
Bullish (1): close > open / Bearish (-1): close < open / Neutral (0): close == open
Higher timeframe directions are fetched using Pine Script’s request.security function, ensuring accurate data retrieval.
2. Alignment Check: The script checks if all selected higher timeframes are uniformly bullish (full_bullish) or bearish (full_bearish).
o A higher timeframe must have a clear direction (bullish or bearish) to trigger coloring. If any selected timeframe is neutral, alignment fails, and no coloring occurs.
3. Coloring Logic: The current bar is colored only if its direction aligns with the higher timeframes:
Lime if the higher timeframes are bullish and the current bar is bullish or neutral.
Maroon if the higher timeframes are bearish and the current bar is bearish or neutral.
If the current bar’s direction opposes the higher timeframe (e.g., 1m bearish, 10m bullish), the bar remains uncolored.
Users can disable bar coloring entirely via the settings, leaving bars in their default chart color.
4. Direction Table:
A table in the top-right corner (toggleable) displays the direction of each selected timeframe and the current timeframe, using color-coded labels (green for bullish, red for bearish, gray for neutral).
This feature helps traders understand why a bar is or isn’t colored, making the indicator accessible to users unfamiliar with Pine Script.
How to Use
1. Add the Indicator: Add the "Timeframe Continuity Indicator" to your chart in TradingView (e.g., a 1m chart of SPY).
2. Configure Settings:
Timeframe Selection: Check the boxes for the higher timeframes you want to compare against (default: 10m). Options include 5m, 10m, 15m, 30m, 1h, 2h, 4h, 1D, 1W, and 1M. Select multiple timeframes if you want to ensure alignment across all of them (e.g., 10m and 1d).
Enable Bar Coloring: Default: true (bars are colored lime or maroon when aligned). Set to false to disable coloring and keep the default chart colors.
Show Table: Default: true (table is displayed in the top-right corner). Set to false to hide the table for a cleaner chart.
3. Interpret the Output:
Colored Bars: Lime bars indicate the current bar (e.g., 1m) is bullish or neutral, and all selected higher timeframes are bullish. Maroon bars indicate the current bar is bearish or neutral, and all selected higher timeframes are bearish. Uncolored bars (default chart color) indicate a mismatch (e.g., 1m bar is bearish while 10m is bullish) or no coloring if disabled.
Direction Table: Check the table to see the direction of each selected timeframe and the current timeframe.
4. Example Use Case:
On a 1m chart of SPY, select the 10m timeframe.
If the 10m timeframe is bearish, 1m bars that are bearish or neutral will color maroon, confirming you’re trading with the higher timeframe’s trend.
If a 1m bar is bullish while the 10m is bearish, it remains uncolored, signaling a potential misalignment to avoid trading.
Underlying Concepts
The indicator is based on the concept of Timeframe Continuity, a strategy used by traders to ensure that price action on a lower timeframe aligns with the trend on higher timeframes. This reduces the risk of entering trades against the broader market direction. The script directly compares candlestick directions (bullish, bearish, or neutral) rather than relying on lagging indicators like moving averages or RSI, providing a real-time, price-action-based confirmation of trend alignment. The handling of neutral candles ensures that minor indecision on the lower timeframe doesn’t interrupt the visualization of the higher timeframe’s trend.
Why This Indicator?
Simplicity: Directly compares candlestick directions, avoiding complex calculations or lagging indicators.
Flexibility: Customizable timeframes and toggles cater to various trading strategies.
Transparency: The debug table makes the indicator’s logic accessible to all users, not just those who can read Pine Script.
Practicality: Helps traders confirm trend alignment, a key factor in successful trading across timeframes.

Daily Moving Averages on Intraday ChartsThis moving average script displays the chosen 5 daily moving averages on intraday (minute) charts. It automatically adjusts the intervals to show the proper moving averages.
In a day there are 375 trading minutes from 9:15 AM to 3:30PM in Indian market. In 5 days there are 1875 minutes. For other markets adjust this data accordingly.
If 5DMA is chosen on a five minute chart the moving average will use 375 interval values (1875/5 = 375) of 5minute chart to calculate moving average. Same 5DMA on 25minute chart will use 75 interval values (1875/25 = 75).
On a 1minute chart the 5DMA plot will use 1875 interval values to arrive at the moving average.
Since tradingview only allows 5000 intervals to lookback, if a particular daily moving average on intraday chart needs more than 5000 candle data it won't be shown. E.g 200DMA on 5minute chart needs 15000 candles data to plot a correct 200DMA line. Anything less than that would give incorrect moving average and hence it won't be shown on the chart.
MA crossover for the first two MAs is provided. If you want to use that option, make sure you give the moving averages in the correct order.
You can enhance this script and use it in any way you please as long as you make it opensource on TradingView. Feedback and improvement suggestions are welcome.
Special thanks to @JohnMuchow for his moving averages script for all timeframes.

Stoch RSI and RSI Buy/Sell Signals with MACD Trend FilterDescription of the Indicator
This Pine Script is designed to provide traders with buy and sell signals based on the combination of Stochastic RSI, RSI, and MACD indicators, enhanced by the confirmation of candle colors. The primary goal is to facilitate informed trading decisions in various market conditions by utilizing different indicators and their interactions. The script allows customization of various parameters, providing flexibility for traders to adapt it to their specific trading styles.
Usefulness
This indicator is not just a mashup of existing indicators; it integrates the functionality of multiple momentum and trend-detection methods into a cohesive trading tool. The combination of Stochastic RSI, RSI, and MACD offers a well-rounded approach to analyzing market conditions, allowing traders to identify entry and exit points effectively. The inclusion of color-coded signals (strong vs. weak) further enhances its utility by providing visual cues about the strength of the signals.
How to Use This Indicator
Input Settings: Adjust the parameters for the Stochastic RSI, RSI, and MACD to fit your trading style. Set the overbought/oversold levels according to your risk tolerance.
Signal Colors:
Strong Buy Signal: Indicated by a green label and confirmed by a green candle (close > open).
Weak Buy Signal: Indicated by a blue label and confirmed by a green candle (close > open).
Strong Sell Signal: Indicated by a red label and confirmed by a red candle (close < open).
Weak Sell Signal: Indicated by an orange label and confirmed by a red candle (close < open).
Example Trading Strategy Using This Indicator
To effectively use this indicator as part of your trading strategy, follow these detailed steps:
Setup:
Timeframe : Select a timeframe that aligns with your trading style (e.g., 15-minute for intraday, 1-hour for swing trading, or daily for longer-term positions).
Indicator Settings : Customize the Stochastic RSI, RSI, and MACD parameters to suit your trading approach. Adjust overbought/oversold levels to match your risk tolerance.
Strategy:
1. Strong Buy Entry Criteria :
Wait for a strong buy signal (green label) when the RSI is at or below the oversold level (e.g., ≤ 35), indicating a deeply oversold market. Confirm that the MACD shows a decreasing trend (bearish momentum weakening) to validate a potential reversal. Ensure the current candle is green (close > open) if candle color confirmation is enabled.
Example Use : On a 1-hour chart, if the RSI drops below 35, MACD shows three consecutive bars of decreasing negative momentum, and a green candle forms, enter a buy position. This setup signals a robust entry with strong momentum backing it.
2. Weak Buy Entry Criteria :
Monitor for weak buy signals (blue label) when RSI is above the oversold level but still below the neutral (e.g., between 36 and 50). This indicates a market recovering from an oversold state but not fully reversing yet. These signals can be used for early entries with additional confirmations, such as support levels or higher timeframe trends.
Example Use : On the same 1-hour chart, if RSI is at 45, the MACD shows momentum stabilizing (not necessarily negative), and a green candle appears, consider a partial or cautious entry. Use this as an early warning for a potential bullish move, especially when higher timeframe indicators align.
3. Strong Sell Entry Criteria :
Look for a strong sell signal (red label) when RSI is at or above the overbought level (e.g., ≥ 65), signaling a strong overbought condition. The MACD should show three consecutive bars of increasing positive momentum to indicate that the bullish trend is weakening. Ensure the current candle is red (close < open) if candle color confirmation is enabled.
Example Use : If RSI reaches 70, MACD shows increasing momentum that starts to level off, and a red candle forms on a 1-hour chart, initiate a short position with a stop loss set above recent resistance. This is a high-confidence signal for potential price reversal or pullback.
4. Weak Sell Entry Criteria :
Use weak sell signals (orange label) when RSI is between the neutral and overbought levels (e.g., between 50 and 64). These can indicate potential short opportunities that might not yet be fully mature but are worth monitoring. Look for other confirmations like resistance levels or trendline touches to strengthen the signal.
Example Use : If RSI reads 60 on a 1-hour chart, and the MACD shows slight positive momentum with signs of slowing down, place a cautious sell position or scale out of existing long positions. This setup allows you to prepare for a possible downtrend.
Trade Management:
Stop Loss : For buy trades, place stop losses below recent swing lows. For sell trades, set stops above recent swing highs to manage risk effectively.
Take Profit : Target nearby resistance or support levels, apply risk-to-reward ratios (e.g., 1:2), or use trailing stops to lock in profits as price moves in your favor.
Confirmation : Align these signals with broader trends on higher timeframes. For example, if you receive a weak buy signal on a 15-minute chart, check the 1-hour or daily chart to ensure the overall trend is not bearish.
Real-World Example: Imagine trading on a 15-minute chart :
For a buy:
A strong buy signal (green) appears when the RSI dips to 32, MACD shows declining bearish momentum, and a green candle forms. Enter a buy position with a stop loss below the most recent support level.
Alternatively, a weak buy signal (blue) appears when RSI is at 47. Use this as a signal to start monitoring the market closely or enter a smaller position if other indicators (like support and volume analysis) align.
For a sell:
A strong sell signal (red) with RSI at 72 and a red candle signals to short with conviction. Place your stop loss just above the last peak.
A weak sell signal (orange) with RSI at 62 might prompt caution but can still be acted on if confirmed by declining volume or touching a resistance level.
These strategies show how to blend both strong and weak signals into your trading for more nuanced decision-making.
Technical Analysis of the Code
1. Stochastic RSI Calculation:
The script calculates the Stochastic RSI (stochRsiK) using the RSI as input and smooths it with a moving average (stochRsiD).
Code Explanation : ta.stoch(rsi, rsi, rsi, stochLength) computes the Stochastic RSI, and ta.sma(stochRsiK, stochSmoothing) applies smoothing.
2. RSI Calculation :
The RSI is computed over a user-defined period and checks for overbought or oversold conditions.
Code Explanation : rsi = ta.rsi(close, rsiLength) calculates RSI values.
3. MACD Trend Filter :
MACD is calculated with fast, slow, and signal lengths, identifying trends via three consecutive bars moving in the same direction.
Code Explanation : = ta.macd(close, macdLengthFast, macdLengthSlow, macdSignalLength) sets MACD values. Conditions like macdLine < macdLine confirm trends.
4. Buy and Sell Conditions :
The script checks Stochastic RSI, RSI, and MACD values to set buy/sell flags. Candle color filters further confirm valid entries.
Code Explanation : buyConditionMet and sellConditionMet logically check all conditions and toggles (enableStochCondition, enableRSICondition, etc.).
5. Signal Flags and Confirmation :
Flags track when conditions are met and ensure signals only appear on appropriate candle colors.
Code Explanation : Conditional blocks (if statements) update buyFlag and sellFlag.
6. Labels and Alerts :
The indicator plots "BUY" or "SELL" labels with the RSI value when signals trigger and sets alerts through alertcondition().
Code Explanation : label.new() displays the signal, color-coded for strength based on RSI.
NOTE : All strategies can be enabled or disabled in the settings, allowing traders to customize the indicator to their preferences and trading styles.

Smart Momentum Relative StrengthSmart Momentum Relative Strength
Creator Journey
The Smart Momentum Relative Strength indicator is
created by Vishal R. Janjire , inspired by BharatTrader sir, and parameters guided by mentor stockedge founder Vivek Bajaj sir.
Reason? ...Why choose Smart Momentum Relative Strength.
1.Simple to Trade: This indicator simplifies trading decisions. You just need to follow the background color displayed on the chart. When the background is green, it signals a bullish trend, and when it turns red, it signals a bearish trend. For an even cleaner experience, you can untick the Relative Strength (RS) toggle in the indicator settings and focus purely on trading based on these background colors, making the process straightforward and efficient.
2.Unlock the power to compare any stock, share, commodity, forex or cryptocurrency against major indices like Nasdaq Composite, NYSE Composite, Bitcoin, NG, Gold, Silver, Crude oil, Nasdaq-100, Nifty 50, Hang Seng Index, FTSE 100, and many more! With the Comparative Relative Strength (RS) indicator,
You can easily change the default Nifty 50 comparative symbol to any index or asset of your choice, such as Gold, Silver, Crude Oil, or global benchmarks like the Dow Jones Industrial Average, DAX, Euronext 100, and SSE Composite.
This versatile tool allows traders to measure how well a base symbol (e.g., stock or crypto) performs relative to a chosen benchmark over a specified period. Whether you're analyzing the relative strength of Bitcoin against the Nasdaq-100 or comparing stocks to the S&P 500, this indicator provides valuable insights into market trends and outperforming assets.
The Smart Momentum Relative Strength combines several advanced technical analysis tools into one comprehensive Pine Script indicator designed to provide a nuanced view of market strength and trends. This script integrates Relative Strength (RS), Commodity Channel Index (CCI), and additional trend confirmation mechanisms to deliver actionable insights for traders.
Below are key points to understand before using this indicator:
Important Parameters:
1. Green Line: Represents stocks outperforming the comparative index, which is Nifty 50. However, do not apply this result directly to Nifty 50 itself, as it will not work exclusively on the Nifty 50 index.
2. Red Line: Indicates that the stock is underperforming relative to the Nifty 50 index.
3. Green Background: Signifies that both the current time momentum and higher time momentum are aligned, indicating an upward trend.
4. Red Background: Signifies that both the current time momentum and higher time momentum are aligned, indicating a downward trend.
5. Blank Space: This occurs when the two timeframes are not aligned, indicating market uncertainty and signaling a potential change in market direction, it means short time frame or current time frame changed its direction to opposite side.
Multi-Time Frame (MTF) Settings:
This indicator incorporates a default multi-time frame setup, as follows:
1 and 2 Minute chart = 5 Minute higher time frame
3 Minute chart = 15 Minute higher time frame
5 Minute chart = 15 Minute higher time frame
10 Minute chart = 60 Minute higher time frame
15 Minute chart = 60 Minute higher time frame
20 and 30 Minute chart = 120 Minute higher time frame
1 Hour chart = 4 Hour higher time frame
2 Hour chart = 4 Hour higher time frame
4 Hour chart = 1 Day higher time frame
1 Day chart = 1 Week higher time frame
1 Week chart = 1 Month higher time frame
1 Month chart = 12 Month higher time frame
For any other chart time frame = Day time is default time frame
1. Relative Strength (RS) Analysis:
Calculation: Measures the performance of the base symbol relative to a comparative symbol over a specified period.
Visualization: The RS value is plotted with color-coded lines to indicate bullish (green) or bearish (red) conditions based on crossovers. Users can customize the color based on value or trend direction.
Trend Analysis: A simple moving average (SMA) of RS is displayed to visualize trend strength and direction, with color changes to reflect rising or falling trends.
2. Commodity Channel Index (CCI):
- Current Timeframe CCI: Calculates the CCI for the current timeframe to assess price momentum.
- Higher Timeframe CCI: Computes the CCI for a higher timeframe to provide a broader market perspective.
- Background Color: Highlights the chart background in green or red based on whether both current and higher timeframe CCIs are above or below zero, respectively.
-Blank Space: This occurs when the two timeframes are not aligned, indicating market uncertainty and signaling a potential change in market direction, it means short time frame or current time frame changed its direction to opposite side.

Options Series - MTF 1 and 3 Minute
Objective:
The indicator is named "Options Series - MTF 1 and 3 Minute", suggesting it's designed to analyze options series with multiple time frames (MTF), particularly focusing on 1-minute and 3-minute intervals.
OHLC Values Of Candle:
The code fetches the Open, High, Low, and Close (OHLC) values of the current candle for the specified ticker and timeframes (current, 1 minute, and 3 minutes). Additionally, it calculates the 200-period Simple Moving Average (SMA) of the closing prices for each timeframe.
Bull vs. Bear Condition:
It defines conditions for Bullish and Bearish scenarios based on comparing the current close price with the previous 200-period SMA close price for both 1-minute and 3-minute timeframes. If the current close price is higher than the previous 200-period SMA close price, it's considered Bullish, and if it's lower, it's considered Bearish.
Final Color Condition and Plot:
It determines the color of the candlestick based on the Bullish or Bearish condition. If the conditions for a Bullish scenario are met, the candlestick color is set to green (GreenColorCandle). If the conditions for a Bearish scenario are met, the candlestick color is set to red (RedColorCandle). If neither condition is met (i.e., the candle is neither Bullish nor Bearish), the color remains gray.
The code then plots the 200-period SMA values for both 1-minute and 3-minute timeframes and colors them based on the candlestick color. It also colors the bars based on the candlestick color.
Insights:
This indicator focuses on comparing current close prices with the 200-period SMA close prices to determine market sentiment (Bullish or Bearish).
It utilizes multiple time frames (1 minute and 3 minutes) to provide a broader perspective on market movements.
The color-coded candlesticks and bars make it visually easy to identify Bullish and Bearish trends.
This indicator can be used as part trading based on the identified market sentiment.

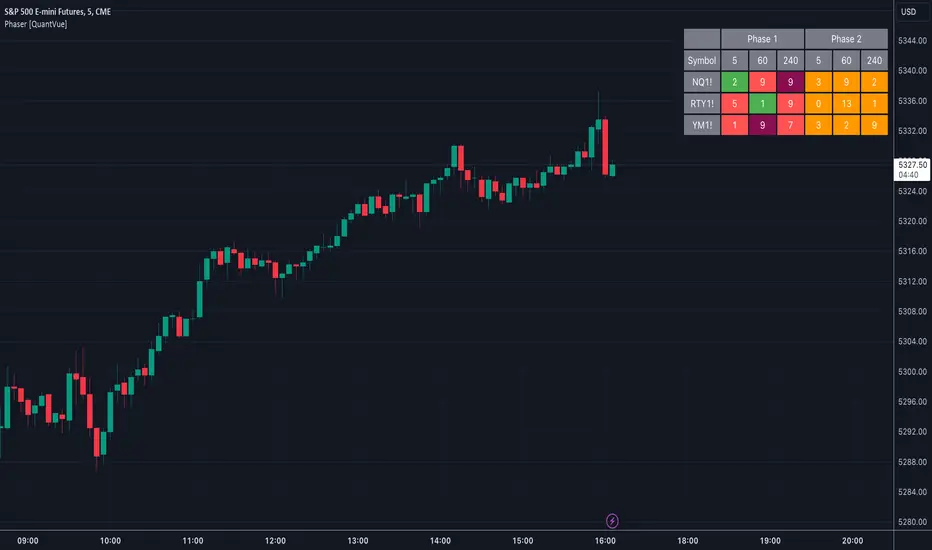
Phaser [QuantVue]The Phaser indicator is a tool to help identify inflection points by looking at price relative to past prices across multiple timeframes and assets.
Phase 1 looks for the price to be higher or lower than the closing price of the bar 4 bars earlier and is complete when 9 consecutive bars meet this criterion.
A completed Phase 1 is considered perfect when the highs (bearish) or lows (bullish) have been exceeded from bars 6 and 7 of the phase.
A bullish setup requires 9 consecutive closes less than the close 4 bars earlier.
A bearish setup requires 9 consecutive closes greater than the close 4 bars earlier.
Phase 2 begins once Phase 1 has been completed. Phase 2 compares the current price to the high or low of two bars earlier.
Unlike Phase 1, Phase 2 does not require the count to be consecutive.
Phase 2 is considered complete when 13 candles have met the criteria.
An important aspect to Phase 2 is the relationship between bar 13 and bar 8.
To ensure the end of Phase 2 is in line with the existing trend, the high or low of bar 13 is compared to the close of bar 8.
A bullish imperfect 13 occurs when the current price is less than the low of 2 bars earlier, but the current low is greater than the close of bar 8 in Phase 2.
A bearish imperfect 13 occurs when the current price is greater than the high of 2 bars earlier, but the current high is less than the close of bar 8 in Phase 2.
Phase 2 does not need to go until it is complete. A Phase 2 can be canceled if the price closes above or below the highest or lowest price from Phase 1.
Settings
3 Tickers
3 Timeframes
Show Phase 1
Show Phase 2
User-selected colors
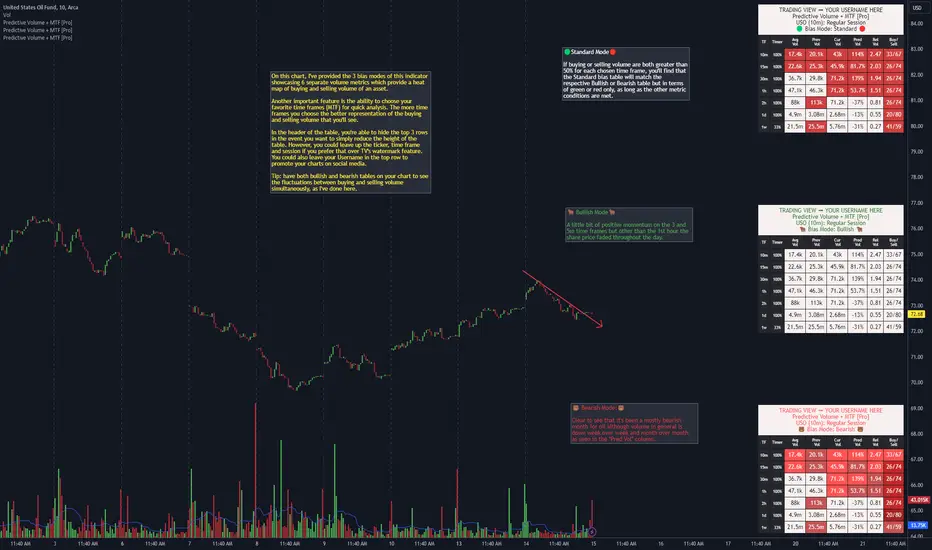
Predictive Volume + MTF [Pro]"Predictive Volume + MTF " is a predictor of near-future volume available on 13 of your favorite time frames. The script calculates the volume's % change (PredVol) between Current Volume vs. Previous Volume by predicting whether PredVol will be higher or lower at the end of the current bar using an "elapsed time" vs "volume so far" concept. This gives the benefit of the most up-to-date information without artificial low/high comparisons when a bar has just formed. For example, it would be common to see -100% in a lot of instances when a new bar is just forming which would be normal because volume at the start of a new candle will generally be lower than where it was when the last bar closed. Where this indicator shines is during this old to new bar formation relative to the volume that's carried over to the new bar. As a result, it will now be common to see PredVol values starting much higher because the calculation is dividing up the bar and analyzing fractions of it instead of the entire bar that would otherwise lead to these incorrect volume % change calculations.
Examples of Predictive Volume % Change:
In addition, this indicator uses many other advanced and robust features:
⚡ Matrices that create the table, allowing you to add and remove rows and columns to customize the table to show only the information that's important to you
⚡ View up to 13 time frames at once - it's generally a good idea to have at least 5 time frames up to get an overall feeling of the direction/sentiment of volume with the 1d being 1 of the 5
⏩ Includes the following popular time frames: 1m, 3m, 5m, 10m, 15m, 30m, 1h, 2h, 4h, 8h, 1d, week, month
⚡ 3 "bias mode" choices that use Relative Volume (RVOL) from calculations between Current, Previous & Average Volume that provide a heat map with varying degrees of color representing buying & selling momentum of your favorite asset. Traders generally have an innate bias when it comes to their trading methodology. The script's
author created separate modes to account for this. One way to utilize the indicator is to use 2 on your chart, 1 Bullish and 1 Bearish, to see if volume sentiment is skewed towards your particular bias
⏩ 🟢 Standard Mode 🔴 - displays green and red to depict volume momentum using same RVOL calculations as Bullish & Bearish modes
⏩ 🐂 Bullish Mode 🐂 - displays 5 colors to represent the levels of intensity of the Buy/Sell/RVOL data (light blue, green, yellow, light orange, dark orange)
⏩ 🐻 Bearish Mode 🐻 - displays 5 colors to represent the levels of intensity of the Buy/Sell/RVOL data (light red to dark red)
Ex. of all 3 bias modes showing very bullish volume sentiment:
Ex. of all 3 bias modes showing very bearish volume sentiment:
⚡ 2 types of alerts: PREDEFINED and CUSTOM
💡 PREDEFINED ALERTS consist of 4 Bullish & Bearish levels with Lvl 1 designed to be less sensitive than Lvl 2 etc
⏩ Configurable for every time frame, "On Close" or "Each Bar". On Close could be a better choice on lower time frames so that you're not getting a bunch of triggers over a short duration & Each Bar could be a better option for higher time frames so that you don't miss a move mid bar for instance
⏩ Creating a PREDEFINED BULLISH/BEARISH ALERT saves a snapshot of the alert's settings. You can then change the settings and create another alert
⏩ For example, you could create one alert for any alert type (bull and/or bear), for every time frame all at once, or you can create multiple & separate alerts, giving each one a unique name with the time frame that it's for: ex. BTC - Bullish Vol Lvl1 (1m) (keep in mind that TV provides you the ticker, time frame & alert
type automatically (the script's author hard-coded the label names within the script and as a result when they do fire you're provided the type of alert, such as "Bearish Vol (Lvl 1). Technically, you don't even need to name the alert again)
In this example, you're provided information on how to create PREDEFINED ALERTS, what conditions cause the alerts to trigger and how they'll look when they do fire
💡 CUSTOM ALERTS consists of 6 metrics giving you the ability to create your own custom compound alerts
⏩ Configurable for every time frame, "On Close" or "Each Bar". On Close could be a better choice on lower time frames so that you're not getting a bunch of triggers over a short duration & Each Bar could be a better option for higher time frames so that you don't miss a move mid bar for instance
⏩ Creating a CUSTOM ALERT works the same way as PREDEFINED ALERTS (see chart below)
⏩ Check your conditions in real-time for accuracy via a debug feature aka "SHOW HELP FOR TIME FRAME"
In this example, you're provided information on how to create CUSTOM ALERTS
⚡ Header function that provides the ticker, time frame and session that you're on (can use in lieu of TV's watermark feature, or use together)
⏩ There's 2 customizable header inputs - you could include your TradingView username in one of them for the times when promoting your charts across your favorite social media sites
⚡ Timer that shows you when a bar will begin/end plus other features that allow you to change the size and positioning of the table within your charts
⚡ An input that allows you to change the "significant figures" for rounding purposes - can be especially useful when volume is low or when you're trading OTC stocks
⚡ 4 volume moving average lengths - Intraday, Daily, Weekly, Monthly - for those times when 1 moving average to cover the entire gamut of just won't suffice
////////////////////////////////
There's quite a bit more information provided in the attached charts as well as the tooltips within the inputs section of the indicator. Should you have any questions, feedback etc, please do not hesitate to contact the script's author. My hope is that this indicator becomes an invaluable resource to you and you're able to integrate it in to your everyday trading tool bag to make more informed decisions.
Macd 6 timeframes ( include chart time with histogram) AboSary 15min, 1h, 4h, D, W, (chart time) + Histogram
All can be show or hide by you and change colors :)
ماكد يشمل 6 فواصل زمنية 15د، 1ساعة، 4ساعات, يوم، اسبوع بالاضافة الى مكاد للفاصل المستخدم بالشارت ايضاً هيستوغرام لنفس الفاصل المعروض في الشارت
مثال لو وضعت نصف ساعة تجد مكاد نص ساعة والهستوغرام كذلك نصف ساعة
جميع الخيارات يمكنك اغلاق اي منها وتغيير الوانها
@tk · fractal emas█ OVERVIEW
This script is an indicator that plots short, medium and long moving averages for multiple fractals. This script was based on sharks EMAs by rlvs indicator, that plots multiple rays for each fractals into the chart. The main feature of this indicator is the customizability. The calculation itself is simple as moving average.
█ MOTIVATION
The trader can customize all aspects of the plotted data. The text size, extended line length, the moving average type — exponential, simple, etc... — the length of fractal rays, line style, line width and visibility. To keep minimalist, this indicator simplifies the logic of line colors based on the purpose of each moving averages. To prevent overnoise the chart with multiple lines with multiple colors for each fractal timefraes, the trader needs to keep in mind that the all lines with the "short" moving average color for example, will represents the short moving averages lines for all fractals. This logic is applied for medium and long moving averages either.
█ CONCEPT
The trading concept to use this indicator is to make entries on uptrend or downtrend pullbacks when the asset price reaches the short, medium or long moving averages price levels. But this strategy don't works alone. It needs to be aligned together with others indicators like RSI, Chart Patterns, Support and Resistance, and so on... Even more confluences that you have, bigger are your chances to increase the probability for a successful trade. So, don't use this indicator alone. Compose a trading strategy and use it to improve your analysis.
█ CUSTOMIZATION
This indicator allows the trader to customize the following settings:
GENERAL
Text size
Changes the font size of the labels to improve accessibility.
Type: string
Options: `tiny`, `small`, `normal`, `large`.
Default: `small`
SHORT
Type
Select the Short Moving Average calculation type.
Type: string
Options: `EMA`, `SMA`, `HMA`, `VWMA`, `WMA`.
Default: `EMA`
Length
Changes the base length for the Short Moving Average calculation.
Type: int
Default: 12
Source
Changes the base source for the Short Moving Average calculation.
Type: float
Default: close
Color
The base color that will represent the Short Moving Average.
Type: color
Default: color.rgb(255, 235, 59) (yellow)
Fractal Style
The fractal ray line style.
Type: string
Options: `dotted`, `dashed`, `solid`.
Default: `dotted`
Fractal Width
The fractal ray line width.
Type: string
Options: `1px`, `2px`, `3px`, `4px`.
Default: `1px`
Fractal Ray Length
The fractal ray line length.
Type: int
Default: 12
MEDIUM
Type
Select the Medium Moving Average calculation type.
Type: string
Options: `EMA`, `SMA`, `HMA`, `VWMA`, `WMA`.
Default: `EMA`
Length
Changes the base length for the Medium Moving Average calculation.
Type: int
Default: 26
Source
Changes the base source for the Medium Moving Average calculation.
Type: float
Default: close
Color
The base color that will represent the Short Moving Average.
Type: color
Default: color.rgb(0, 230, 118) (lime)
Fractal Style
The fractal ray line style.
Type: string
Options: `dotted`, `dashed`, `solid`.
Default: `dotted`
Fractal Width
The fractal ray line width.
Type: string
Options: `1px`, `2px`, `3px`, `4px`.
Default: `1px`
Fractal Ray Length
The fractal ray line length.
Type: int
Default: 12
LONG
Type
Select the Long Moving Average calculation type.
Type: string
Options: `EMA`, `SMA`, `HMA`, `VWMA`, `WMA`.
Default: `EMA`
Length
Changes the base length for the Long Moving Average calculation.
Type: int
Default: 200
Source
Changes the base source for the Long Moving Average calculation.
Type: float
Default: close
Color
The base color that will represent the Short Moving Average.
Type: color
Default: color.rgb(255, 82, 82) (red)
Fractal Style
The fractal ray line style.
Type: string
Options: `dotted`, `dashed`, `solid`.
Default: `dotted`
Fractal Width
The fractal ray line width.
Type: string
Options: `1px`, `2px`, `3px`, `4px`.
Default: `1px`
Fractal Ray Length
The fractal ray line length.
Type: int
Default: 12
VISIBILITY
Show Fractal Rays · (Short)
Shows short moving average fractal rays.
Type: bool
Default: true
Show Fractal Rays · (Medium)
Shows short moving average fractal rays.
Type: bool
Default: true
Show Fractal Rays · (Long)
Shows short moving average fractal rays.
Type: bool
Default: true
█ FUNCTIONS
The script contains the following functions:
`fn_labelizeTimeFrame`
Labelize timeframe period in minutes and hours.
Parameters:
tf: (string) Timeframe period to be labelized.
Returns: (string) Labelized timeframe string.
`fn_builtInLineStyle`
Converts simple string to built-in line style variable value.
Parameters:
lineStyle: (string) The line style simple string.
Returns: (string) Built-in line style string value.
`fn_builtInLineWidth`
Converts simple pixel string to line width number value.
Parameters:
lineWidth: (string) The line width pixel simple string.
Returns: (string) Built-in line width number value.
`fn_requestFractal`
Requests fractal data based on `period` given an expression.
Parameters:
period: (string) The period timeframe of fractal.
expression: (series float) The expression to retrieve data from fractal.
Returns: (mixed) A result determined by `expression`.
`fn_plotRay`
Plots line after chart bars.
Parameters:
y: (float) Y axis line position.
label: (string) Label to be ploted after line.
color: (color) Line and label color.
length: (int) Line length.
show: (bool) Flag to display the line. (default: `true`)
lineStyle: (string) Line style to be applied. (default: `line.style_dotted`)
lineWidth: (int) Line width. (default: `1`)
Returns: void
`fn_plotEmaRay`
Plots moving average line for a specific period.
Parameters:
period: (simple string) Period of fractal to retrieve
expression: (series float) The expression to retrieve data from fractal.
color: (color) Line and label color.
length: (int) Line length. (default: `12`)
show: (bool) Flag to display the line. (default: `true`)
lineStyle: (string) Line style to be applied. (default: `line.style_dotted`)
lineWidth: (string) Line width. (default: `1px`)
Returns: void
`fn_plotExtendedEmaRay`
Draws extended line for current timeframe moving average.
Parameters:
coordY: (float) Extended line Y axis position.
textValue: (simple string) Extended line label text.
textColor: (color) Extended line text color.
length: (int) Extended length. (default: `5`)
Returns: void

@tk · fractal rsi levels█ OVERVIEW
This script is an indicator that helps traders to identify the RSI Levels for multiple fractals wherever the current timeframe is. This script was based on RSI Levels, 20-30 & 70-80 by abdomi indicator, that calculates the Relative Strenght Index levels based on the asset's price and plots it into the chart, creating a "wave" style indicator. The core feature of this indicator is the fractal rays, so trader can visualize each of the oversold and overbought levels of multiple timeframe on the current timeframe that he is on. The indicator will plots multiple rays after the chart bars. indicating where is the oversold and overbought levels for others fractals.
█ MOTIVATION
Since the RSI Levels, 20-30 & 70-80 by abdomi indicator helps a lot to identify the possible price levels when the asset is oversold or overbought, I saw myself drawing multiple horizontal lines on these levels in lower timeframes so, in an uptrend or downtrend, I can try to get a pullback of these trends when the asset reaches oversold or overboght levels. So, I get the idea to make those lines visible in multiple timeframes so I don't need to draw it myself manually anymore.
█ CONCEPT
The trading concept to use this indicator is the concept to make entries on uptrend or downtrend pullbacks when the asset price reaches oversold or overbought levels. But this strategy don't works alone. It needs to be aligned together with others indicators like Exponential Moving Averages, Chart Patterns, Support and Resistance, and so on... Even more confluences that you have, bigger are your chances to increase the probability for a successful trade. So, don't use this indicator alone. Compose a trading strategy and use it to improve your analysis.
█ CUSTOMIZATION
This indicator allows the trader to customize the following settings:
GENERAL
Text size
Changes the font size of the labels to improve accessibility.
Type: string
Options: `tiny`, `small`, `normal`, `large`.
Default: `small`
RSI LEVELS · SETTINGS
Pre-oversold Level
Changes the RSI Level to calculate the "pre-oversold" price level on the chart.
Type: int
Min: 1
Max: 49
Default: 33
Pre-overbought Level
Changes the RSI Level to calculate the "pre-overbought" price level on the chart.
Type: int
Min: 51
Max: 100
Default: 67
Show "Pre-over" Levels
Enables / Disables the pre-oversold and pre-overbought levels on the chart.
Type: bool
Default: true
FRACTAL RAYS · SETTINGS
Length
Changes the base length for the RSI calculation.
Type: int
Min: 1
Default: 14
Source
Changes the base source for the RSI calculation.
Type: float
Default: close
FRACTAL RAYS · STYLE
Ray Color
Changes the color of all fractal rays and its label.
Type: color
Default: color.rgb(187, 74, 207)
Ray Style
Changes the style of all fractal rays.
Type: string
Options: `line.style_solid`, `line.style_dashed`, `line.style_dotted`
Default: line.style_dotted
Ray Length
Changes the length of all fractal rays.
Type: int
Default: 15
FRACTAL RAYS · OVERSOLD
Oversold Level
Changes the base RSI Level for fractal rays calculation.
Type: int
Min: 1
Default: 30
Oversold Prefix
Customizes the fractal ray label with a prefix text.
Type: string
Default: 🚀
Oversold Suffix
Customizes the fractal ray label with a suffix text.
Type: string
Default: (empty)
FRACTAL RAYS · OVERBOUGHT
Overbought Level
Changes the base RSI Level for fractal rays calculation.
Type: int
Min: 1
Default: 70
Overbought Prefix
Customizes the fractal ray label with a prefix text.
Type: string
Default: 🐻
Overbought Suffix
Customizes the fractal ray label with a suffix text.
Type: string
Default: (empty)
FRACTAL RAYS · VISIBILITY RULES
These rules are applied for each of fractal rays so, the traders can choose what timeframes they wants to show the fractal rays for each of it. The rule will be applied as the following condition: `if timeframe != CURRENT_TIMEFRAME and timeframe <= CHOSEN_OPTION`. Actually, the fractal rays are on the chart but, isn't visible because it was applied a transparent color, so it is visually not on the chart to prevent chart's over polution.
LABELS
Show Labels on Price Scale
Shows labels on price scale.
Type: bool
Default: false
Show Price on Fractal Rays
Shows the RSI Level price on each of fractal rays respectively.
Type: bool
Default: false
█ EXTERNAL LIBRARIES
This script uses the `tk` library to calculate RSI Levels. It is a library that contains various functions that helps pine script developers to calculate RSI Levels.
█ FUNCTIONS
The library contains the following functions:
fn_fractalVisibilityRule(string visibilityRule)
Converts the fractal rays timeframe visibility rule label to timestamp int.
Parameters:
visibilityRule: (string) Fractal ray visibility rule label.
Returns: (int) Fractal ray visibility rule timestamp.
fn_requestFractal(string period, expression)
Converts the fractal rays timeframe visibility rule label to timestamp int.
Parameters:
period: (string) Timeframe period for the desired fractal.
expression: (mixed) Security expression that will be applied for calculation.
Returns: (mixed) A result determined by expression.
fn_plotRay(float y, string label, color color, int length)
Plots ray after chart bars for the current time.
Parameters:
period: (string) Timeframe period for the desired fractal.
expression: (mixed) Security expression that will be applied for calculation.
Returns: (void) This function only plots the elements into the chart
fn_plotRsiLevelRay(simple string period, simple int level, color color)
Plots RSI Levels ray after chart bars for the current time.
Parameters:
period: (simple string) Timeframe period.
level: (simple int) Relative Strength Index level.
color: (color) The color of both, ray and label text.
Returns: (void) This function only plots the elements into the chart

RSI MTF DashboardThis is an RSI dashboard, which allows you to see the current RSI value for five timeframes across up to 8 tickers of your choice. This is a useful tool to gauge momentum across multiple timeframes, where you would look to enter a buy with high RSI values across the timeframes (and vice versa for sell positions).
Conversely, some traders use RSI to identify potential areas for reversals, so you would look to buy with low RSI values (and vice versa for sell positions).
In the settings, please select which 5 timeframes you require. Then select which tickers you wish to see, and you will find a dashboard on your chart to show the RSI values. The dashboard can be highlighted when the RSI value shows bearish momentum (a value under 50, of your choice) and bullish momentum (a value over 50, again of your choice). These colours and values are fully customisable.
In the settings you can also select the location of the dashboard, as well as some colour and transparency settings to enable the best possible view on screen.

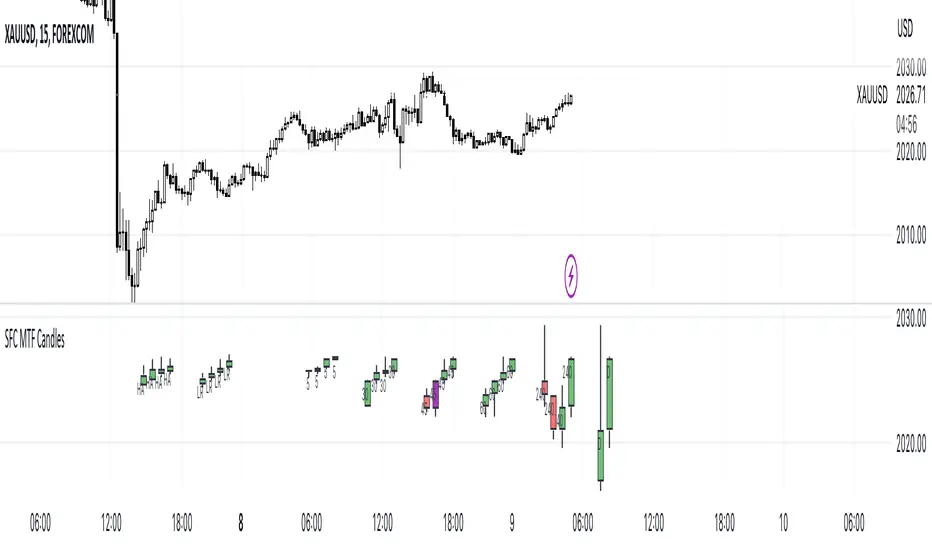
SFC MTF CandlesMost technical traders in the foreign exchange market, whether they are novices or seasoned pros, have come across the concept of multiple time frame analysis in their market educations.
Multiple time-frame analysis involves monitoring the same currency pair across different frequencies (or time compressions). While there is no real limit as to how many frequencies can be monitored or which specific ones to choose, there are general guidelines that most practitioners will follow.
Typically, using three different periods gives a broad enough reading on the market, while using fewer than this can result in a considerable loss of data, and using more typically provides redundant analysis.
This indicator helps traders to visualise the last few candles on many time frames.
For manipulation traders I have added the ability to see the current manipulation on different time frames. When such a candle is created, its colour changes to purple.
The Heikin-Ashi technique averages price data to create a Japanese candlestick chart that filters out market noise.
Heikin-Ashi charts, developed by Munehisa Homma in the 1700s, share some characteristics with standard candlestick charts but differ based on the values used to create each candle. Instead of using the open, high, low, and close like standard candlestick charts, the Heikin-Ashi technique uses a modified formula based on two-period averages. This gives the chart a smoother appearance, making it easier to spots trends and reversals, but also obscures gaps and some price data.
Linear regression attempts to model the relationship between two variables, with a given collection of data values.
Linear regression is a very common and useful technique for following the trend. This technique is applied to candles in order to filter out false movements.
Heikin Ashi and Linear Regression candles are helpful for more conservative traders. If they are not sure about the direction, they can wait for these candles to change colour (direction) as an extra confirmation.
Features:
- Up to 6 time frames
- Up to 4 MTF bars
- Heikin Ashi candles (current time frame) - x4
- Linear Regression candles (current time frame) - x4
Settings
- Time frames on/off
- Selection how many bars to display from each time frame (max 4)
- Adjustment of distance between candles
- Adjusting the position of the candles
- Heikin Ashi candles on/off
- TLinear regression candles on/off
- Linear regression candle length adjustment
How to use the indicator:
Traders can visualise different candles in order to observe the chart better and faster.
All they have to do is activate the group of candles they want and set it up according to their preferences.
Due to the complexity of the code, there is a 1s delay when all features are enabled. To eliminate the lag, deactivate some of the features
It is recommended to have a maximum of 3 time frames activated during the high impact news, as the price changes very quickly.
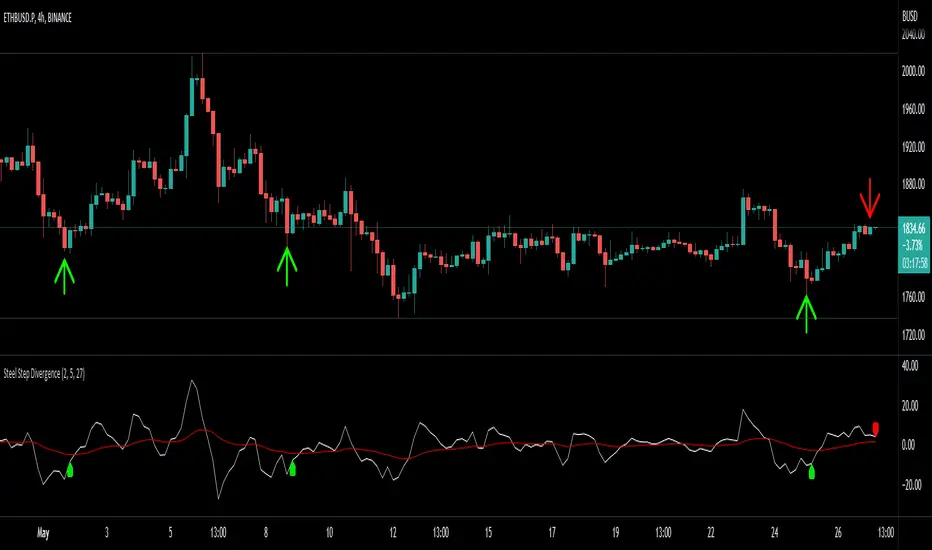
Steel Step Assistant: Divergence IndicatorDisclaimer: Nobody should use this indicator as a confirmation signal for entry/exit for your trades. Please message me on how to use this indicator correctly. This indicator was designed to be used in conjunction with my Steel Step strategy, hence the name.
This indicator simply gives you a signal of a trend reversal.
The default settings produce directions that are very similar to what I use for my strategy. You can change the settings as desired.
The user inputs (settings) should be very straightforward. Length is the distance you want to compare the price.
This indicator can be used on all charts and markets; crypto, commodities, forex, stock, indices, etc.
It is suitable for intra-day traders, as well as HTF traders.
The default settings are configured to show you the trend reversal or market direction of "one layer" above "the current time frame layer". You can find educational materials about the layer logic from my Steel Step strategy.
One way of using this is to enhance your information gathering on trends in order to understand the market structure or direction better.
This indicator educates users on the market structure. Users can quickly break down the market into layers, analyze the layers and connect them all to understand the market as a whole. After users understand the market, users need to decide and choose a specific trend they want to trade. The basic idea is to flow with the market.
This indicator can be combined with EW theory to understand the market structure easily.
When I understand the whole market structure, it boosts my trading performance to the maximum.
Please comment below or message me if you have any questions. Enjoy!
Black RSI (Pro Suite)Black RSI (Pro Suite) is combination of RSI (Relative Strength Index), Volume RSI, Heikin Ashi RSI & other multi Oscillators with multi features into one indicator, features like (Quad Divergences, Multi Time Frame RSI, MTF RSI Panel, Oscillator Support/Resistance/Wedges/Trendlines, Oscillator Moving Average/BBs, Smooth RSI, RSI Price Estimator, Oscillator Over bought/sold Bars, Osc OB/OS Zones, Osc OB/OS Highlights, additionally Black RSI indicator is flexible & completely customizable).
Indicator goal: I have tried my best to organized RSI & other suitable oscillators and oscillator useful tools into one simple and free indicator for Tradingview users (specifically for Tradingview 'basic' subscription users). suggestions are always welcome. please give feedback & appreciate if you like my work.
Black RSI Indicator Features Summary:
Black RSI indicator includes many features mainly relevant to RSI and other Oscillators, these are briefly highlighted below:
Black RSI Dashboard
Multi Oscillators: Choose between multiple oscillators. All oscillators settings are customizable.
Multi Symbol: Multi Symbol Support, applicable on all oscillators
RSI (Relative Strength Index)
VRSI (Volume Relative Strength Index)
HA RSI (Heikin Ashi Relative Strength Index)
OBV (On Balance Volume)
CVD (Comulative Volume Delta)
MFI (Money Flow Index)
UO (Ultimate Oscillator)
MOM (Momentum Oscillator)
ATR (Average True Range)
Stoch (Stochastic Oscillator)
Stoch RSI (Stochastic RSI)
Oscillator Primary Tools ◢
Oscillator Moving Average/Bollinger Bands
Smooth RSI
Multi Timeframe RSI
Multi Timeframe RSI Panel
RSI Price Estimator
Oscillator Support/Resistance/Wedges/Trendlines
Oscillator Moving Average/BBs: Shows Moving Average for selected oscillator.
Smooth Smooth: Smooths out RSI
Multi Timeframe RSI: Displays Multiple Time Frame/Multiple Symbol RSI and converts it and shows it as it is in current time frame without effecting Primary RSI
Multi Timeframe RSI Panel: Displays Multiple Time Frame/Multiple Symbol RSI values of user input specific timeframes in compact panel (max 8 Time frames)
RSI Price Estimator: Calculates RSI estimate price values of 3 different user specific RSI input levels, RSI x MA cross price and RSI future value of user specific price input level.
Oscillator Support/Resistance/Wedges/Trendlines: Draws Trendlines, Wedges and Support & Resistance lines on selected oscillator
Oscillator Quad Divergence ◢
1st Oscillator Divergence: Traditional divergence indicator with enhancements & customization
2nd Oscillator Divergence: Traditional divergence indicator with enhancements & customization
3rd Oscillator Divergence: Advanced Divergence indicator with source selection, RSI/Price threshold, potential divergences & customization
4th Oscillator Divergence: Pivots divergence indicator with flexible pivots selection & customization
Regular bullish divergences are indicated when price is forming lower lows while an oscillator shows higher lows.
Regular bearish divergences are indicated when price is forming higher highs while an oscillator shows lower highs.
While regular divergences indicate trend reversals, hidden divergences indicate a trend continuation.
When the price is making higher lows and the oscillator is showing lower lows, we speak of a bullish hidden divergence.
When the price is making lower highs and the oscillator shows higher highs, it's a bearish hidden divergence.
Oscillator Secondary Tools ◢
Oscillator HH/LL pivots
Osc OB/OS Color Bars
Osc OB/OS Zones
Osc OB/OS Highlights
Background
Oscillator HH/LL pivots: Shows HH/LL pivot points on selected oscillator
Osc OB/OS Color Bars: Plots color chart bars based on RSI, MFI, Stochastic, Stochastic RSI or combine overbought/oversold conditions
Osc OB/OS Zones: Plots Osc OB/OS Zones with user input levels
Osc OB/OS Highlights: Highlight oscillator OB/OS background area
Background: background color customization
+ Primary RSI Settings ▾
- Primary RSI Length: User input RSI Length value
- Primary RSI Source: User RSI Source selection
- RSI Overbought Threshold: Allows the user to set the RSI overbought threshold value. This Overbought Threshold value will also be applied on "RSI Divergence overbought condition", "RSI OB Color Bars" and "Primary RSI Color Schemes
- RSI Oversold Threshold: Allows the user to set the RSI oversold threshold value. The lower band (oversold line) of RSI. This Oversold Threshold value will also be applied on "RSI Divergence oversold condition", "RSI OS Color Bars" and "Primary RSI Color Schemes
- RSI Middle Band: Allows the user to set the RSI middle band value. This value will also applied to "Center Line" color scheme from "Primary RSI Color Schemes" drop menu
- Primary RSI Colors:
Range color specifies a gradient of colors from the overbought to the oversold threshold user inputs from "Primary RSI" section. Color interpolation also a gradient but smoother than Range color. Center Line is similar but is not a gradient, linked to Middle Band ("Primary RSI" section) and changes color with RSI Middle Band. Traditional is simple with Overbought and Oversold colors change.
- RSI Bullish Band: Allows the user to plot extra/optional RSI band on RSI Oscillator (Note: it will not be plotted if "OB/OS Zone only" enabled from "OB/OS Zone Settings" section)
- RSI Bearish Band: Allows the user to plot extra/optional RSI band on RSI Oscillator (Note: it will not be plotted if "OB/OS Zone only" enabled from "OB/OS Zone Settings" section)
+ Primary RSI Smooth Settings ▾
- Smooth Moving Average Type: User selected Smooth MA type. With RSI Smooth enabled, will also effect all RSI Divergences detection (all divergences will be plot according to "Smoothed RSI line")
- Smooth Moving Average Length: User input Smooth MA length value
+ Oscillator Moving Average Settings ▾
- Osc Moving Average Colors: Allows user to select Bullish/Bearish colors of Oscillator Moving Average
- Osc Moving Average Type: Allows user to select Oscillator MA Type
- Osc Moving Average Length: User input Oscillator MA length value
- Osc Moving Average Thickness: User input Oscillator MA thickness
- BB StdDev: user input Bollinger Bands standard deviation value
+ Stochastic Oscillator Settings ▾
- Same as Traditional/Default indicator
+ Stochastic RSI Oscillator Settings ▾
- Same as Traditional/Default indicator
+ Money Index Flow Settings ▾
- Same as Traditional/Default indicator
+ Ultimate Oscillator Settings ▾
- Same as Traditional/Default indicator
+ Momentum Oscillator Settings ▾
- Same as Traditional/Default indicator
+ Average True Range Settings ▾
- Same as Traditional/Default indicator
+ Multi Timeframe RSI Settings ▾
- MTF RSI Time Frame: Allows user to select MTF RSI Time Frame
- MTF RSI Symbol: Allows user to select MTF RSI Time Symbol
- MTF RSI Length: User input MTF RSI length value
- MTF RSI Source: User selected MTF RSI source
- MTF RSI Line Width: User input MTF RSI line thickness value
- Number of Bars for MTF RSI plot
- MTF RSI Color > OB color > OS color : Allows user to select MTF RSI color with additionally Overbought/Oversold colors
+ MTF RSI Panel Settings ▾
- Select MTF RSI Type: If "Primary RSI" or "Volume RSI" selected MTF RSI Panel will show output values based on "Primary RSI" or "Volume RSI" parameters e.g. source, length, but without smooth.
- MTF RSI Panel Symbol: Allows user to select MTF RSI Panel symbol, leave symbol blank or uncheck "checkbox" for current chart symbol
- Show Symbol in Panel: Shows symbol ticker(current or user selected) in MTF RSI Panel
- Panel Background: Allows user to select MTF RSI Panel Background (enable/disable) and Background color selection
- TF1: MTF RSI Timeframe 1 user selection
- TF2: MTF RSI Timeframe 2 user selection
- TF3: MTF RSI Timeframe 3 user selection
- TF4: MTF RSI Timeframe 4 user selection
- TF5: MTF RSI Timeframe 5 user selection
- TF6: MTF RSI Timeframe 6 user selection
- TF7: MTF RSI Timeframe 7 user selection
- TF8: MTF RSI Timeframe 8 user selection
- Panel Top Offset: MTF RSI Panel offset input value
- Position: MTF RSI Panel position selection
- Text Size: MTF RSI Panel text size selection
- Bullish Colors: MTF RSI Panel bullish color selection. (Bullish colors range RSI >75, <75 to >65, <65 to >55)
- Bearish Colors: MTF RSI Panel bearish color selection. (Bearish colors range RSI <45 to >35, <35 to >25, <25)
+ RSI Price Estimator Settings ▾
- Price 1: User input value for RSI future price
- Price 2: User input value for RSI future price
- Price 3: User input value for RSI future price
- Panel Position Offset: User input value for panel position offset
- Price Decimals: User input value for output price decimals in panel
- Show RSI/OscMA cross Price: Enable/Disable RSIxOscillator MA cross future price
- Show RSI Level for Input Price: User input price for future RSI level
- Invisible Background: Enable/Disable Background
Auto Text Color > Auto color change of Panel text according to Dark/Light chart theme
+ Oscillator Support/Resistance Settings ▾
- Show Support line: Allows user to Enable/Disable Oscillator support line
Color > Auto Color: Auto color change of support line according to Dark/Light chart theme
- Show Resistance line: Allows user to Enable/Disable Oscillator resistance line
Color > Auto Color: Auto color display of resistance line according to Dark/Light chart theme
- Lookback lows/highs: User input of Lookback lows/highs value
- Distance threshold: Distance from the line to the low
- Line touch points: Number of points that have to be around the line
- Low/High left bars: User input of Low/High left bars value
- Low/High right bars: User input of Low/High right bars value
- Line style: User selection of line style
- Line thickness: User input of line thickness value
+ Oscillator 1st Divergence Settings ▾
- Divergence Source: User selection of divergence source. "High/Low" (high/low of oscillator/price divergence detection), "Close" (close of oscillator/price divergence detection) and "Both" (Both Close + High/Low of oscillator/price divergence detection). (Note: Traditional Divergence indicator default source is "High/Low")
- Pivot Lookback Right: How many candle to compare on the right side of a candle when deciding whether it is a pivot. The lower the number is, the earlier pivots (and therefore divergences) will be signaled, but the quality of those detections could be lower.
- Pivot Lookback Left: How many candle to compare on the left side of a candle when deciding whether it is a pivot. The lower the number is, the earlier pivots (and therefore divergences) will be signaled, but the quality of those detections could be lower.
- Divergence Max Length (Bars): The maximum length of a divergence (number of bars). If a detected divergence is longer than this, it will be discarded
- Divergence Min Length (Bars): The minimum length of a divergence (number of bars). If a detected divergence is shorter than this, it will be discarded
- Show Divergence as:
- Line Thickness: User input divergence line thickness value
- Label Transparency: it could reduce labels mess on oscillator line, input "100" for label text only without label background
- Labels Text Color: User label text color selection
Auto Text Color > Auto color change of label text according to Dark/Light chart theme
- Bull Divergences: Enable/Disable of Bull divergences
> Color: User selection of Bull divergence color
> Oversold only: It will show Regular Bullish RSI divergences in oversold zone only, RSI oversold threshold can be configure in "Primary RSI Settings" section.
- Bear Divergences: Enable/Disable of Bear divergences
> Color: User selection of Bear divergence color
> Overbought only: It will show Regular Bearish RSI divergences in overbought zone only, RSI overbought threshold can be configure in "Primary RSI Settings" section.
- Hidden Bull Div: Enable/Disable of Hidden Bull divergences
> Color: User selection of Hidden Bull divergence color
- Hidden Bear Div: Enable/Disable of Hidden Bear divergences
> Color: User selection of Hidden Bear divergence color
+ Oscillator 2nd Divergence Settings ▾
- Same as Oscillator 1st Divergence Settings
+ Oscillator 3rd Divergence Settings ▾
- Divergence source: User selection of divergence source . "oscillator" (divergence detection with high/low or close of selected oscillator), "price" (divergence detection with high/low or close of price)
- Bull price source: User selection of Bull price source. Bull price source: "Low" (low of price divergence detection), "Close" (close of price divergence detection) (linked to "price" in "Divergence source")
- Bear price source: User selection of Bear price source. Bear price source: "High" (high of price divergence detection), "Close" (close of price divergence detection) (linked to "price" in "Divergence source")
- Low/High left bars: How many candle to compare on the left side of a candle when deciding whether it is a pivot. The lower the number is, the earlier pivots (and therefore divergences) will be signaled, but the quality of those detections could be lower.
- Low/High right bars: How many candle to compare on the right side of a candle when deciding whether it is a pivot. The lower the number is, the earlier pivots (and therefore divergences) will be signaled, but the quality of those detections could be lower.
- Maximum lookback bars: The maximum length of a divergence (number of bars). If a detected divergence is longer than this, it will be discarded.
- Price threshold: User selection of Price threshold, higher values more lines
- RSI threshold: User selection of RSI threshold, higher values more lines
- Show Lows: Displays lows of RSI
- Show Highs: Displays highs of RSI
- Show Divergence as:
- Line Style:
- Line thickness: User input divergence line thickness value
- Label Transparency: it could reduce labels mess on oscillator line, input "100" for label text only without label background
- Labels Text Color: User label text color selection
Auto Text Color > Auto color change of label text according to Dark/Light chart theme
- Bull Divergences: Enable/Disable of Bull divergences
> Color: User selection of Bull divergence color
> Potential Bull: It will plot potential regular bull divergence with dotted line.
- Bear Divergences: Enable/Disable of Bear divergences
> Color: User selection of Bear divergence color
> Potential Bear: It will plot potential regular bear divergence with dotted line.
- Hidden Bull Div: Enable/Disable of Hidden Bull divergences
> Color: User selection of Hidden Bull divergence color
> Potential H.Bull: It will plot potential hidden bull divergence with dotted line.
- Hidden Bear Div: Enable/Disable of Hidden Bear divergences
> Color: User selection of Hidden Bear divergence color
> Hidden Bear divergence: It will plot potential hidden bear divergence with dotted line.
> Regular Bull oversold only: It will show Regular Bullish RSI divergences in oversold zone only, RSI oversold threshold can be configure in "Primary RSI Settings" section.
> Regular Bear overbought only: It will show Regular Bearish RSI divergences in overbought zone only, RSI overbought threshold can be configure in "Primary RSI Settings" section.
+ Oscillator 4th Divergences Settings ▾
- Upper Length: User pivot input value of draw upper divergence line From
- To Pivot:
- Lower Length: User pivot input value of draw lower divergence line From
- To Pivot:
- Show Divergence as:
- Line Style:
- Line thickness: User input divergence line thickness value
- Label Transparency: it could reduce labels mess on oscillator line, input "100" for label text only without label background
- Labels Text Color: User label text color selection
Auto Text Color > Auto color change of label text according to Dark/Light chart theme
- Bull Divergences: Enable/Disable of Bull divergences
> Color: User selection of Bull divergence color
- Bear Divergences: Enable/Disable of Bear divergences
> Color: User selection of Bear divergence color
- Regular Bull oversold only: It will show Regular Bullish RSI divergences in oversold zone only, RSI oversold threshold can be configure in "Primary RSI Settings" section.
- Regular Bear overbought only: It will show Regular Bearish RSI divergences in overbought zone only, RSI overbought threshold can be configure in "Primary RSI Settings" section.
+ Oscillator HHLL Pivots Settings ▾
- Pivot Length: User input value of HH/LL pivot length
> L.Text Color: User label text color selection
- HH color: User HH Label color selection
- HL color: User HL Label color selection
- LH color: User LH Label color selection
- LL color: User LL Label color selection
+ Oscillator OB/OS Colored Bars Settings▾
- Overbought/Oversold Bars Oscillator: Plots Overbought/Oversold color bars based on RSI, MFI, Stoch, Stoch RSI overbought/oversold threshold conditions separately or combined(when every oscillator reach its OB or OS threshold condition at same time).
- Overbought Bar Color: User RSI OB Bars color selection
- Oversold Bar Color: User RSI OS Bars color selection
+ Primary RSI Range Color ▾
- OB: Overbought Color
- OS: Oversold Color
- Bullish: Bullish Color
- Bearish: Bearish Color
+ Primary RSI Color interpolation ▾
- RSI Color: RSI Color
- OB: Overbought Color
- OS: Oversold Color
+ Primary RSI Center Line Color ▾
- OB: Overbought Color
- Bullish: Bullish Color
- Bearish: Bearish Color
- OS: Oversold Color
+ Primary RSI Traditional Color ▾
- RSI Color: RSI Color
- OB: Overbought Color
- OS: Oversold Color
Osc Overbought/Oversold Zones Settings ▾
- OB/OS Zone Band Lines: Enable/Disable OB/OS Zone Band Lines
- OB/OS Zones only: Only shows OB/OS Zones and disable all RSI band lines except Middle Band. Background will not be effected by this setting.
- Overbought Zone: User input value of Overbought Zone from
> To:
- Oversold Zone: User input value of Oversold Zone from
> To:
Osc Overbought/Oversold Highlights ▾
- Overbought Highlights : Enable/Disable Overbought Highlights
- Oversold Highlights : Enable/Disable Oversold Highlights
- Transparency: Gradient transparency of highlighted area
+ 'Oscillators Color Settings ▾
- Show Osc Symbol label : Enable/Disable of oscillator symbol label. Displays current oscillator symbol, but with "Override Oscillator Symbol" enabled from "Black RSI Dashboard" it will Auto/forcefully displays Override Oscillator Symbol on Oscillator
- Fade out Oscillator line: Fade out the oscillator line color, focusing only the most recent periods prominent for a clearer chart
- Fill Stoch/StochRSI lines: Fills Stoch/Stoch RSI lines
- Oscillator line thickness: user input value of oscillator line thickness
- Oscillator line offset: Shifts the oscillator to the left or to the right on the given number of bars, Default is 0
- OBV Color
- MFI Color
- ATR Color
- UO Color
- MOM Color
- CVD Bullish Color
- CVD Bearish Color
+ Background Setting ▾
- Custom Background Color: User selection of Background color
Authors & Credits: I'd like to THANK to Nabeel Black(myself), LonesomeTheBlue, iFuSiiOnzZ, jmosullivan, zdmre, creengrack, and TradingView for the locally sourced ingredients.
Disclaimer: DYOR. Not financial advice. Not a trading system. I am not affiliated with TradingView or any authors mentioned here; You alone have the sole responsibility of evaluating the script output and risks associated with the use of the script. Trading success is all about following your trading strategy and the indicators should fit within your trading strategy, and not to be traded upon solely. Always trade with confluence and Risk Management.
Feedback & Bug report
if you found any bug in this indicator or any suggestion, please let me know. Please give feedback & appreciate if you like to see more future updates and indicators. Thank you

HARSI + Divergences// All credit to © //@author=JayRogers & VuManChu Cipher B for their original Scripts (Open Source)
/ ====== ABOUT THIS INDICATOR
// I've combined some part of the code of the following indicators to get some alerts based on the Idea and Use section below :
// - RSI based Heikin Ashi candle oscillator
// - Divergence based on the VuManChu Cipher B
//
// ====== ARTICLES and FURTHER READING
//
// - www.investopedia.com
//
// "Heikin-Ashi is a candlestick pattern technique that aims to reduce
// some of the market noise, creating a chart that highlights trend
// direction better than typical candlestick charts"
//
// ====== IDEA AND USE
// - The use of the HA RSI indicator when in the OverSold and OverBought
// area combined to a Divergence & a OB/OS buy/sell
// on the Cipher B by VuManChu.
// Can be useful as a confluence at S/R levels.
// *** Tip = 1 minute timeframe seems to work the best on FOREX
//
// *** Alerts :
// - The Divergence alert needs 2 bar to calculate,
// so alerts and dots as well, it will be placed on the right spot on
// the chart as per the offset added.
// - Use "Once Per Bar" for the alert, not per bar close, or you would
// have 1 extra bar delay
//
// ** Contributions : Remodel some part of the original script in order to get :
// --> Total conditions for an alert and a dot to display, resumed :
// - Buy/Sell in OB/OS
// - Divergence Buy/Sell
// - RSI Overlay is in OB/OS on current bar (or was the bar before)
// when both Buy/Sell dots from VMC appears.
//
// ====== DISCLAIMER
// For Tradingview & Pinescript moderators =
// This follow a strategy where RSI Overlay from @JayRogers script shall be
// in OB/OS zone, while combining it with the VuManChu Cipher B Divergences
// Buy&Sell + Buy/sell alerts In OB/OS areas.
// Any trade decisions you make are entirely your own responsibility.
//
// Thanks to dynausmaux for the code
// Thanks to falconCoin for inspired me to start this.
// Thanks to LazyBear for WaveTrend Oscillator
// Thanks to RicardoSantos for

OHLC MTFThe script allows you to plot the opening, highest, lowest and closing (ohlc) values of a previous candle.
Settings :
- "Time Frame" : allows you to choose the reference time frame;
- "Offset" : sets which candle to select the data from.
Ex : If you select "1 day" as the time frame and "1" as the offset, the OHLC values of yesterday's daily candle will be displayed (regardless of your current time frame).

Regression Channel Alternative MTF█ OVERVIEW
This indicator displays 3 timeframes of parallel channel using linear regression calculation to assist manual drawing of chart patterns.
This indicator is not true Multi Timeframe (MTF) but considered as Alternative MTF which calculate 100 bars for Primary MTF, can be refer from provided line helper.
The timeframe scenarios are defined based on Position, Swing and Intraday Trader.
█ INSPIRATIONS
These timeframe scenarios are defined based on Harmonic Trading : Volume Three written by Scott M Carney.
By applying channel on each timeframe, MW or ABCD patterns can be easily identified manually.
This can also be applied on other chart patterns.
█ CREDITS
Scott M Carney, Harmonic Trading : Volume Three (Reaction vs. Reversal)
█ TIMEFRAME EXPLAINED
Higher / Distal : The (next) longer or larger comparative timeframe after primary pattern has been identified.
Primary / Clear : Timeframe that possess the clearest pattern structure.
Lower / Proximate : The (next) shorter timeframe after primary pattern has been identified.
Lowest : Check primary timeframe as main reference.
█ EXAMPLE OF USAGE / EXPLAINATION
