BTC HASHRATE DROP: OnchainWhy is the drop of hashrate important?
Drop of hashrate usually occurs because some miners in the mining network stop for working. There are several possible reasons for this. Such as new anti-mining regulations in some countries or a sharp drop in the price of bitcoin, which makes mining no longer affordable for some miners. So they turn off their devices
This reduces the supply of bitcoin in the market and according to the law of supply and demand can eventually lead to an increase in the price of bitcoin.
This oscillator is designed to detect hashrate drop. for this, we use the data of glassnode . Maroon color indicates decrease in hashrate and Red color indicates excessive hash rate drop. As can be seen on the chart, usually after this drop, we see an increase in the price of bitcoin
Onchain

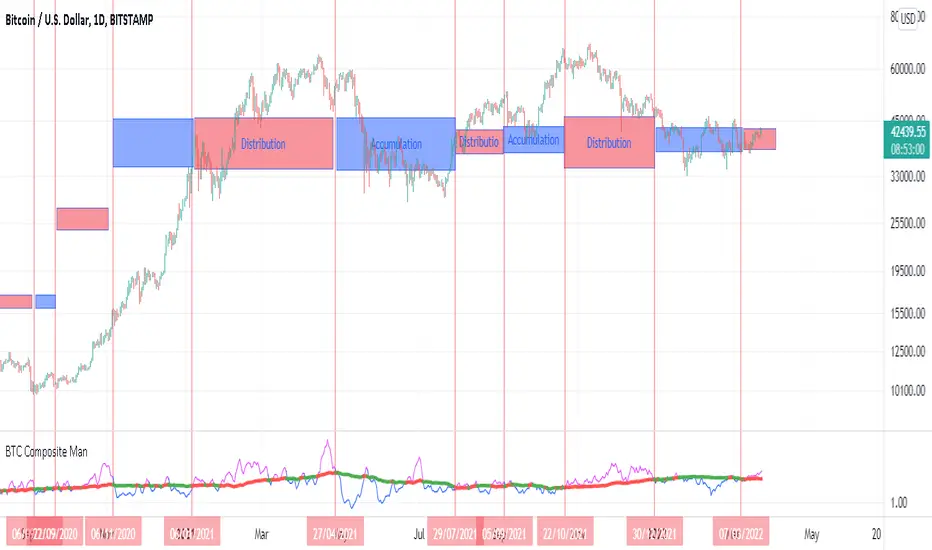
BTC Composite Man V.1Wyckoff's theory t is one of the most influential theories of market expression, and the most important components of which are lateral movement areas and trends. This theory turns the graph into something like Dots and lines (stations and paths).
After getting acquainted with Wyckoff's theory, I read several books on the subject, hoping that they could help me identify this area of lateral movement, the area of accumulation, or distribution. But there was a fundamental drawback. It is challenging to diagnose this issue. The rules discussed in these books are highly interpretive and subjective, and two different individual traders may come to exactly opposite conclusions based on their interpretation.
But as I became more familiar with the onchain analysis, an idea came to my mind that might be useful for more objectively recognizing charts based on Wyckoff's theory.
Composite Man: Wyckoff proposed a theory to help understand stock price movements. this is the “Composite Man” theory. (The same concept of whales or strong hands.)
he said: “…all the fluctuations in the market and all the various stocks should be studied as if they were the result of one man’s operations. Let us call him the Composite Man, who, in theory, sits behind the scenes and manipulates the stocks to your disadvantage if you do not understand the game as he plays it; and to your great profit if you do understand it.” (The Richard D. Wyckoff Course in Stock Market Science and Technique, section 9, p. 1-2)
Composite Man is a hypothetical man who has so much money and stocks that when he wants he can gradually increase the price by buying stocks and creating demand, and when the price goes high enough he sells his stock and lower the price. The composite man is the main player in the market. Wyckoff says that if you want to make a good profit from the market, figure out what a composite man game is.
Having a way of showing us where the Composite Man is in the market, can help us understand future trends
Who are the strong hands in the cryptocurrency market? (I use the strong hand word here instead of the composite man)
Some buy or sell more per capita than other market participants (retailers).
To understand this in the bitcoin market, I have used 3 charts and concepts:
1- Sending Addresses: The number of coins addresses making inflow transactions to the exchange.
Indicates the number of sellers' wallets (number of sellers)
2- buyers Addresses: The number of coins addresses making outflow transactions from the exchange.
Indicates the number of buyers' wallets (number of buyers)
3- Pay attention to this issue: the volume of transactions shows both the volume of sales and the buy ( Volume of buy and sale is equal in the market)
The Composite Man indicator is created by dividing the Receiving Addresses of bitcoin by the Sending Addresses. After dividing these addresses, the moving average of Alma was calculated for them and compared with the moving average of 100 days.
Considering the above 3 issues, it can be concluded:
- If the number of Receiving Addresses is higher than the Sending Addresses (the number of people who bought compared to the number of those who sold), it indicates that more people bought and fewer people sold (given that the volume of sales and buys are the same) So the sellers were stronger hands. In such a situation, the composite man is on the sales side.
- If the number of Sending Addresses is higher than the Receiving Addresses (number of people who have sold more than the number of people who have bought), it indicates that more people have been sellers and fewer people have been buyers (given that the volume of sales and buys are the same) so the buyers were stronger hands. In such a situation, the Composite man is on the buying side.
Accordingly, if the swing line is above the 100-day moving average line, it indicates that stronger addresses are being sold and retailers are buying, and vice versa.
BTC Transaction/On-Chain Volume (Basic)Description:
Whale: Whale utilizing discounted prices (increasing on-chain volume & decreasing price)
Recovering: Positive momentum in price after potential whale activity
Cycle Volume Support: The transaction volume support during a cycle
What’s the best time to invest?
After institutions make up their mind at low price levels.
How’s on-chain volume related to whales or institutional money?
On-chain volume is contributed not only by using BTC as payment methods, but more importantly by large custodians using the BTC chain to settle internal whale trades. When OTC volume is estimated 2-3 times of exchange volume, and when total on-chain volume is only a small fraction of the exchange volume, the OTC settlement plays a big factor in moving the on-chain volume around.
Why does the price drop further after spotting whale money?
Does new money equal higher true value? Yes.
Does new money equal higher price? No.
Whales could not only ladder in when they see the price on discount, but also push the price further down to accumulate at better price levels. However, either route chosen, it’s most likely for the price to rise to a higher level compared to the level when the whales enter. Whales are here to make money after all.

Bitcoin Difficulty Model [aamonkey]This is a model to calculate Bitcoin price based on Difficulty.
How to calculate it:
BDM = (difficulty^0.51) * 0.002
For the difficulty, the daily average is used.
