Outsidebar

Inside Bar/Outside Bar/Mother Bar Box By SmartTrader888This Indicator shows:
1. Inside Bar
2. Outside Bar
3. Mother Bar box (Box the mother bar and all subsequent inside bars)
This indicator handles correctly the edge conditions such as:
1. bar close = bar open
2. current bar low equals to mother bar low or current bar high equals mother bar high
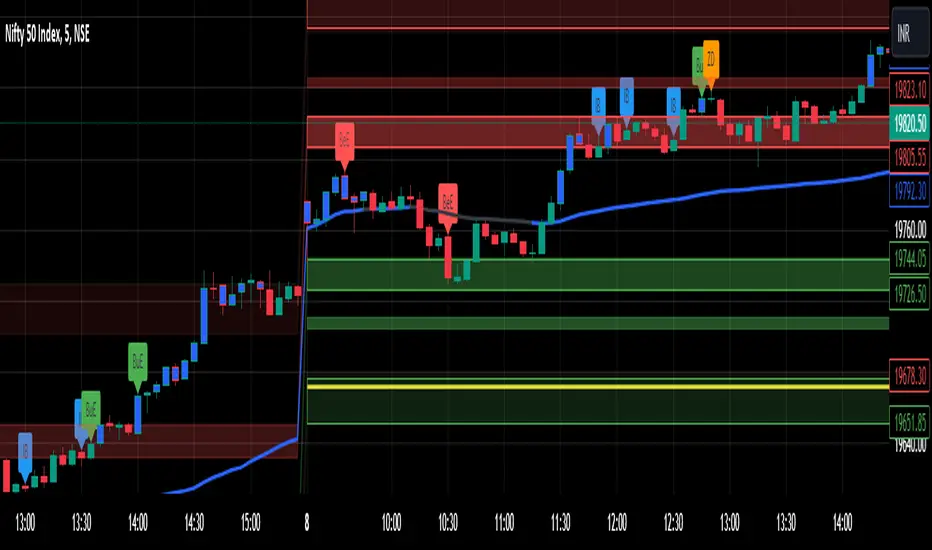
Salman Indicator: Multi-Purpose Price ActionSalman Indicator: Multi-Purpose Price Action Tool for Pin Bars, Breakouts, and VWAP Anchoring
This indicator provides a comprehensive suite of price action insights, designed for active traders looking to identify key market structures and potential reversals. The script incorporates a Quarterly VWAP for trend bias, marks pin bars for possible reversal points, highlights outside bars for volatility signals, and indicates simple breakouts and pivot-level breaks. Customizable settings allow for flexibility in various trading styles, with default settings optimized for daily charts.
Outside Bars : Represented by an ⤬ symbol on the chart, these indicate bars where the current high is greater than the previous bar’s high, and the low is lower than the previous bar’s low, signaling high volatility and potential market reversals.
Pin Bars : Denoted by a small dot at the top or bottom of a candle’s wick, these are crucial signals of potential reversal areas. Pin bars are identified based on the percentage length of their shadows, with adjustable strictness in settings.
Quarterly VWAP : The light blue line on the chart represents the VWAP (Volume-Weighted Average Price), which is anchored to the Quarterly period by default. The VWAP acts as a directional bias filter, helping you to determine underlying market trends. This period, source, and offset are fully adjustable in the script’s settings.
Simple Breaks : Hollow candles on the chart indicate "simple breaks," defined when the current bar closes above the previous high or below the previous low. This is an effective way to highlight directional momentum in the market.
Bonus Pivot Breaks : The tilde symbol ~ appears when the price closes above or below prior pivot high/low levels, helping traders spot significant breakout or breakdown points relative to recent pivots.
Alerts
Simple Breaks : Alerts you when a breakout occurs beyond the previous bar’s high or low. Pin Bars : Notifies you of potential reversal points as indicated by bullish or bearish pin bars. Outside Bars : Triggers an alert whenever an outside bar is detected, indicating possible volatility changes.
How to Use
VWAP for Trend Bias : Use the Quarterly VWAP line to gauge overall market trend, with settings that allow adjustment to daily, weekly, monthly, or even larger time frames.
Pin Bars for Reversal Potential : Look for the dot markers on candle wicks, where the strictness of the pin bar detection can be adjusted via settings to match your trading preference.
Simple and Pivot Breaks for Momentum : Watch for hollow candles and the tilde symbol ~ as indicators of potential breakout momentum and pivot break levels, respectively.
This script can serve traders on multiple timeframes, from daily to weekly and beyond. The flexible configuration allows for adjustments in VWAP anchoring and pin bar criteria, providing a tailored fit for individual trading strategies.

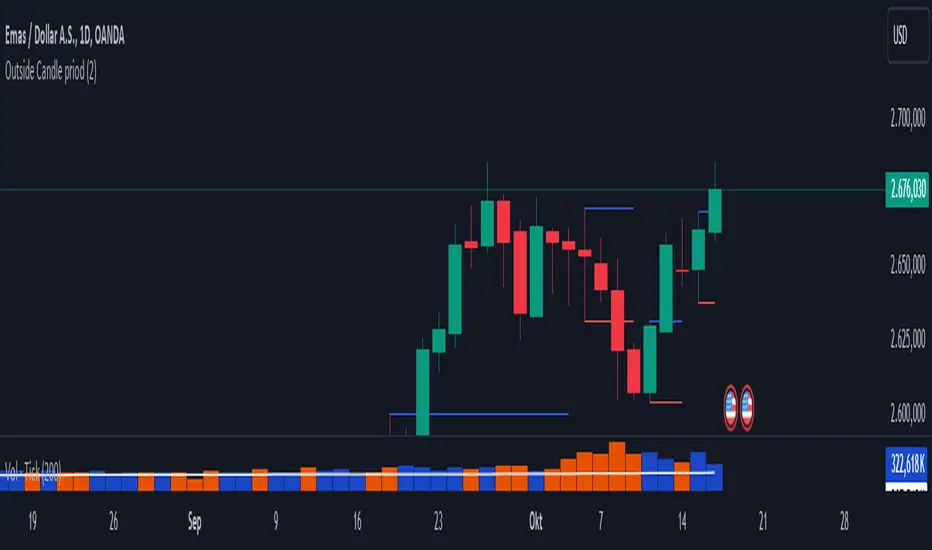
Outside CandleThis script aims to detect the Outside Candle pattern, which is a candle that has a higher high and a lower low compared to the previous candle.
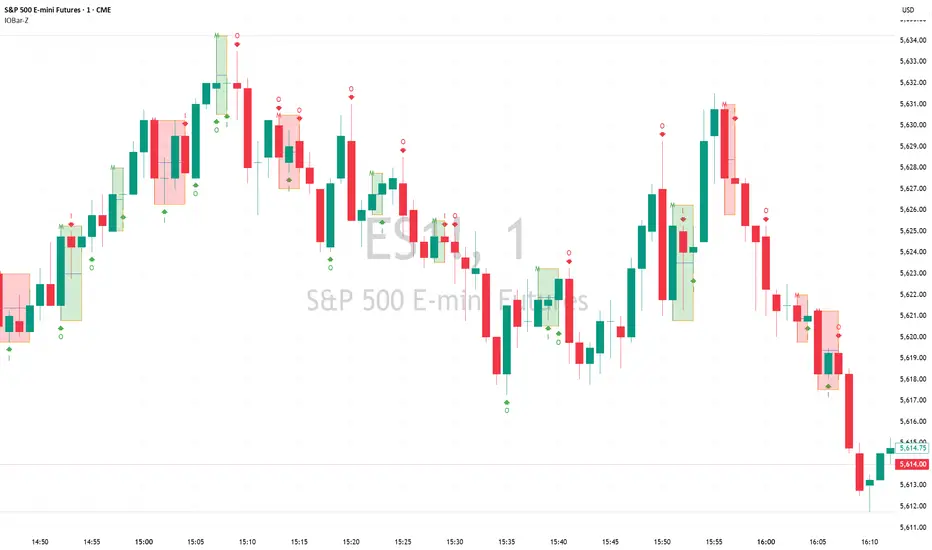
Previous Candle + Inside/OutsideThe script uses the previous candle of the current timeframe to assess the state of the current candle.
1. Previous candle high/low and midpoint are displayed
2. Highlights current bar if INSIDE previous candle
3. Highlights current bar if POTENTIAL OUTSIDE bar. This condition uses the logic that if the previous high/low has been swept and price then reaches previous bar 50%, then an OUTSIDE bar is possible.
4. If current candle breaks previous high/low, a label is added to identify.
5. If above condition is true and current candle color is opposite of previous, then label is highlighted to show possible bull/bear condition.
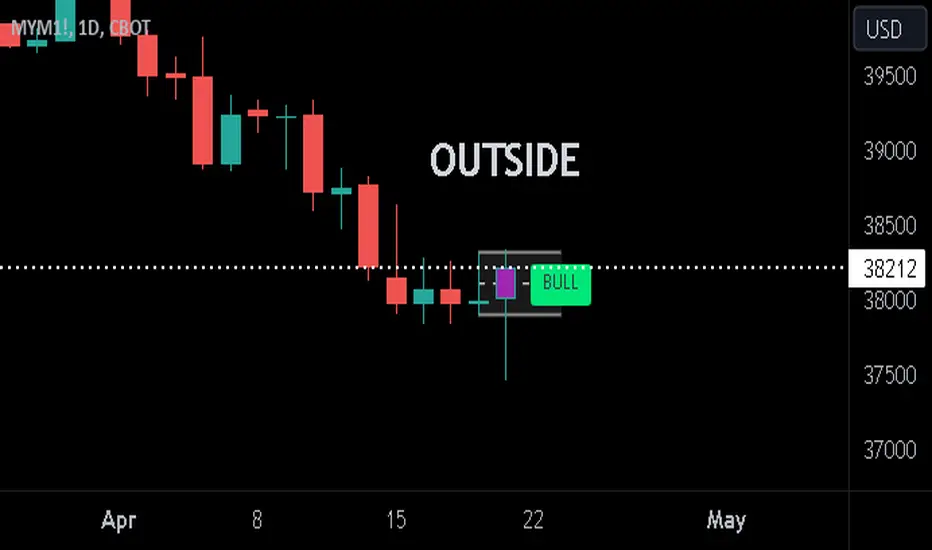
6. If current candle live price is below previous midpoint, a BEAR label is shown
7. If current candle live price is above previous midpoint, a BULL label is shown
I personally use the indicator on Daily/Weekly/Monthly charts to help with my overall market assessment. However users may find their own use for the indicator...or modify it to their own preferences.
As ever, the indicator should only be used with live trading accounts after thorough backtesting using a large data range.
PERFECT ENGULFING Candlestick Patterns by AnmolWill add some more patterns and conditions in it in future, for now its for detecting PERFECT Engulfings only.
Use these Engulfing to take a trade when it get detected on support/resistance
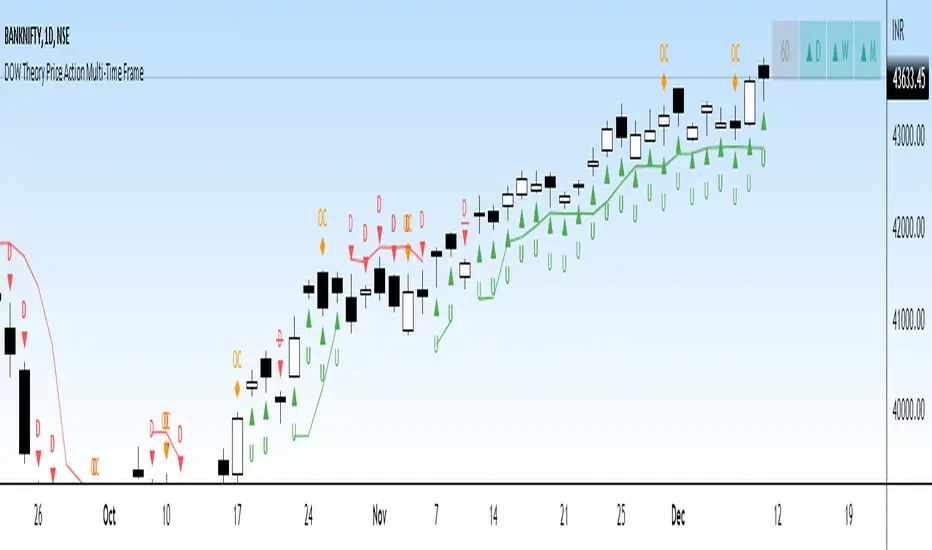
DOW Theory Price Action Multi-Time FrameThis indicator gives a visual representation of Dow Theory Price action based trend analysis and provides trader a table with 4 different timeframe to align with the trend.
It will help traders identify if it is an ongoing Impulse Wave or a Corrective Wave.
3 rules for Bullish Price Action setup (Uptrend or continuation of existing UpTrend): Denoted by 'U' below the candlestic
HH - Higher High
HL - Higher Low
CAH - Close above prior High
3 rules for Bearish Price Action setup (Downtrend or continuation of existing DownTrend): Denoted by 'D' below the candlestic
LH - Lower High
HL - LowerLow
CAH - Close below prior Low
Exception - Outside Candle: Denoted by 'OC' above the candlestic
Outside reversal is a two-day price pattern that shows when a candle or bar on a candlestick or bar chart falls “outside” of the previous day's candle or bar.
The table posistion can be set be user from the input settings as per his screen setting / resolution.
The trailing line can is also customizable from inputs, recomended value is 3-4.
Ideation Credits: Mr. Vineet Jain
The $trat | by Octopu$1️⃣2️⃣3️⃣ The $trat | by Octopu$
The $trat: The Strat by Octopu$
Absolute Solution for The Strat Traders!
The Strat is a Strategy created by Rob Smith's and is well known by being an innovative trading system.
Continues to grow in popularity as more traders discover this method.
It is a simplified way to understand Price Action. It is based on three principles: Types of candles, 1, 2, and 3.
Other things to be known about The Strat are Actionable Signals and Time Frame Continuity.
The $trat has it all.
This Indicator includes Bar Types (1, 2 and 3) also known as Inside Bars, Twos (Up or Down) and Outside Bars.
It is also well crafted with a built-in Time Frame Continuity (TFC) which shows Price Movement at a glimpse.
On top of that, in the best of both worlds, also comes with information about the Bars Status for other TFs as well.
It means that you can know how another TF of you preference is performing. Right there.
Works in Any Time Frame.
On Any Ticker.
(Using SPY 5m just as an example:)
www.tradingview.com
SPY
Features:
• Candle Types (1, 2 and 3) IB, 2U & 2D and OB.
• Time Frame Continuity (TFC) for Price Movement/Trend Check
• Bar Status shortcut. So you can know Price Action/Direction fast.
• Reversal indicators for Action-taking and Situational Awareness
• Combos Labels. So nothing ever goes unnoticed.
Options:
• Absolutely fully Customizable: Colors, Sizes, Numbers. Everything.
• On/Off Switches for most of the Information and Optionable Selections
• Hammer/Shooter Indicator automatically inserted to Chart
• Candle/Bars Coloring for ease of reading.
• Highlight options for specific setups
Notes:
v1.0
$trat Indicator release
Changes and updates can come in the future for additional functionalities or per requests.
Did you like it? Boost it. Shoot a message! I'd appreciate if you dropped by to say thanks.
- Octopu$
🐙

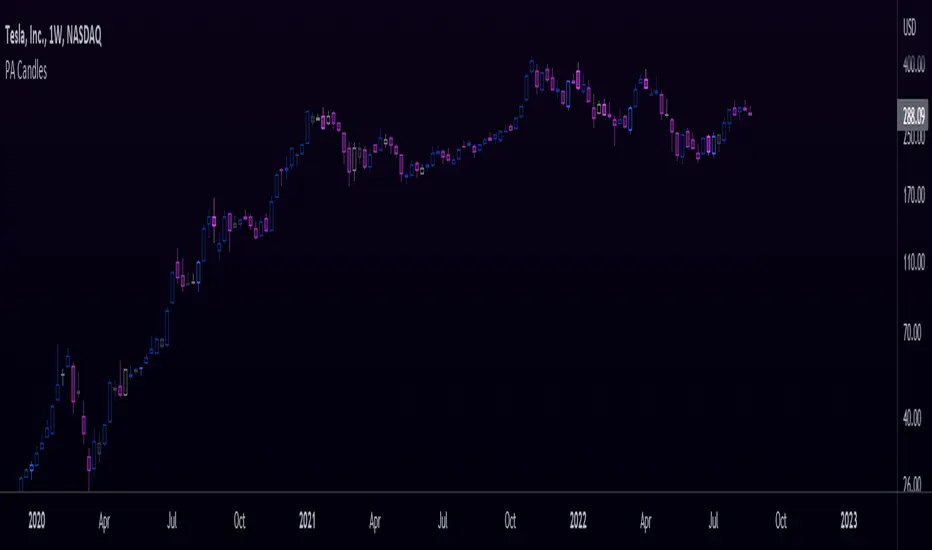
Price Action CandlesThis simple script provides a visual aid for price action traders by coloring outside & inside candles, which in effect leaves the trader with 6 possible candle colors:
-Regular bullish candle
-Outside bullish candle
-Inside bullish candle
-Regular bearish candle
-Outside bearish candle
-Inside bearish candle
These candlesticks may provide powerful signals when used in conjunction with key levels, market structure and chart patterns.
Make sure to disable the regular candlesticks (body, borders and wicks) in the symbol tab inside the configuration menu!
Hope it can help someone!
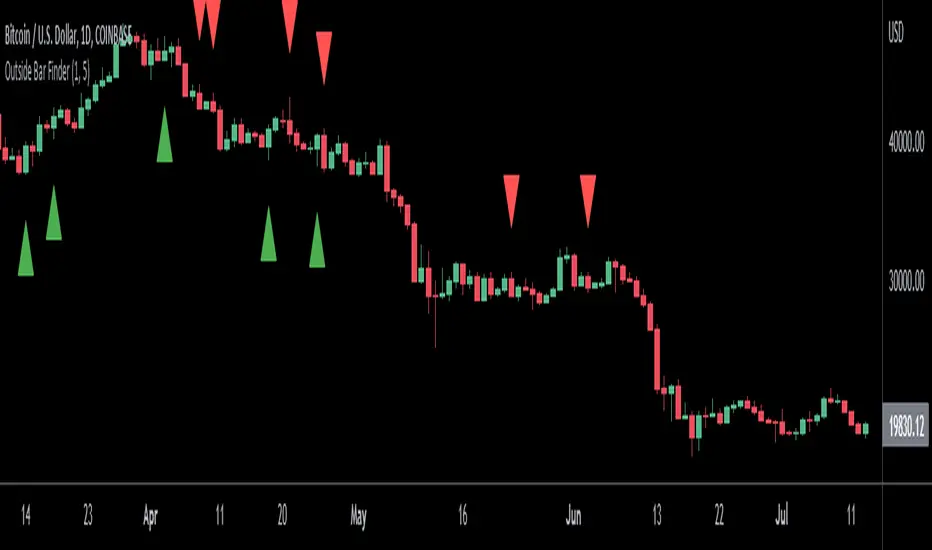
Outside Bar FinderOutside bars occur when the range of a candlestick falls entirely outside of the previous candlestick's range. This indicates indecision and volatility expansion which often leads to changes in trend direction.
This indicator includes options such as:
- The number of consecutive outside bars required to trigger the indicator
- An arrow indicating whether the outside bar is bullish or bearish
- Signal lines to indicate the high and low of the outside bar
Try out this indicator with different options on different timeframes to see if outside bars increase the probability of identifying changes in trend. Breaks or closes outside the signal lines can be used to trigger trade signals.
PopGun Trading, PG Pattern DetectorPopGun Bar Pattern Strategy
PG Trading
The indicator does the following:
It detects the Outside Bar, the smaller inside Bar and the 3rd Pop Gun that is bigger, than the inside Bar.
When the Pop Gun was detected, the indicator will calculate 3 targets for long and short trades.
In our understanding, a Pop Gun is neutral. The next candles after the Pop Gun will decide if the PG breakout is bullish or bearish.
So if one of the next candles after the PG is breaking the high or low of the PG Candle, this is a breakout confirmation and can traded long or short.
We are using the PG Indicator for Stock, Futures and Index Trading.
The Script uses 3 targets per default, but you can extend the target dots up to 6.
If you want to see the targets in plain text, you can activate the PG Box.
The targets are calculated really easy: Just the height of the candle multiplied with 1, 2 and 3 (4,5 and 6 additionally). In some communities there is an ATR calculation for more extended targets but it seems, that the ATR Calculation will sometimes lead to unreachable targets if the ATR is really high intraday...
We trade PopGuns starting at M15 chart. I think PGs smaler than M15 are not worth a trade...
Maybe i will add the ATR Function in the future just to compare the 2 ways to calculate PG targets. We are really doing well with 1,2,3 targets based on the PG Candle size. (Low to High).
Please leave a comment if you have some feature requests or input to make this the best Pop Gun Indicator in Trading View ;-)

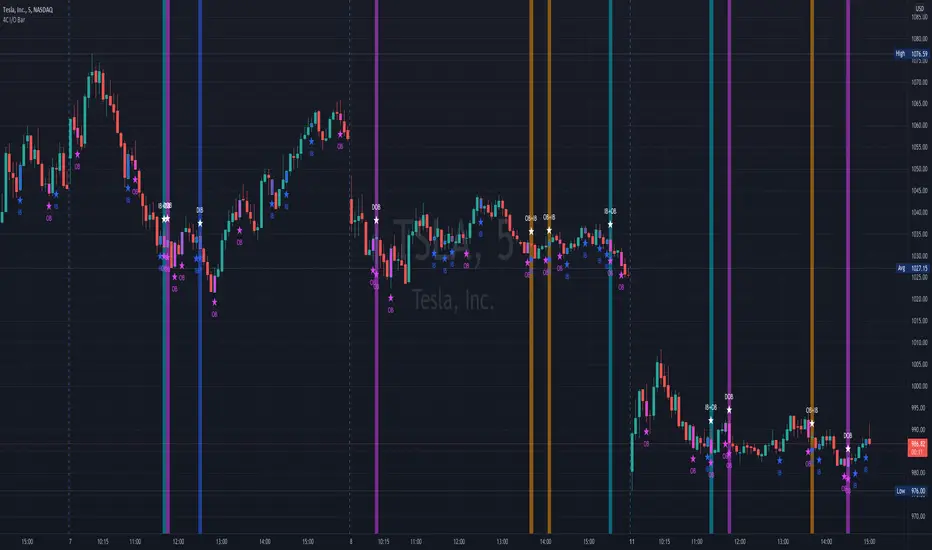
4C Inside/Outside BarThis indicator colors the candle body based on whether it closed as an Inside Bar (IB) or an Outside Bar (OB).
Inside and outside bars can be powerful triggers to enter or exit trades from, when price breaks above or below the candle.
The coloring of only the body and not the border of the candle makes it possible to still know whether the candle was bullish/bearish.
This indicator has the unique ability to add/hide labels for each IB and OB.
Small labels are printed on the chart directly below the candle. (See below)
It also has the unique ability to paint the chart background when an IB forms directly after an OB.
This is a special combination of the two, and can also be a powerful signal.
This feature can be turned on/off. (See below)
Thanks to Craig Stine, as some parts of this indicator were adapted from Custom Candle color Inside/Outside candles, Highwave, Star Patt. by Craig_Stine
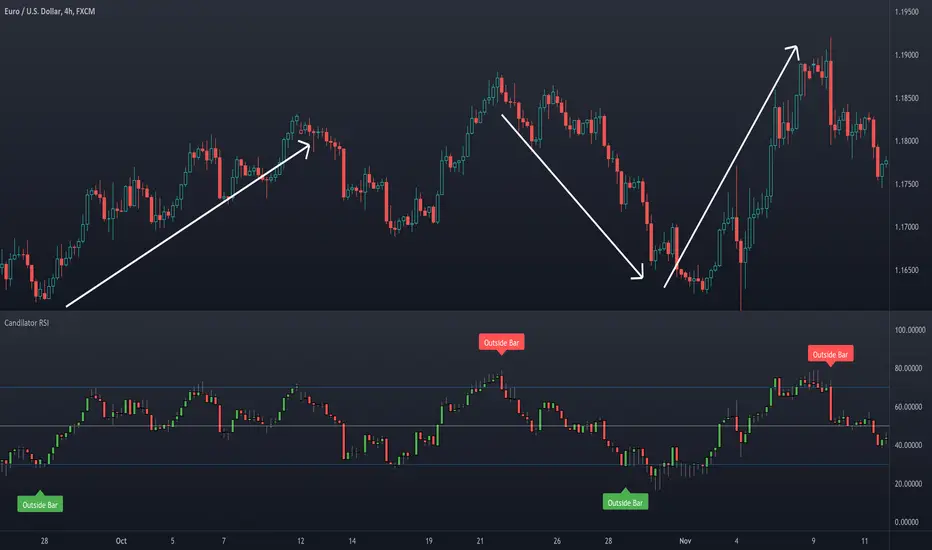
Candilator RSI [AstrideUnicorn]OVERVIEW
The name Candilator comes from blending the words "candlestick" and "oscillator". And as the name suggests, this indicator is a good old RSI plotted as a candlestick chart. To produce a candlestick chart, Candilator RSI calculates four RSI's based on the open, high, low, and close time series. It also has a candlestick patterns detection feature.
HOW TO USE
You can use Candilator RSI as a normal RSI to analyze momentum, detect overbought and oversold markets, and find the oscillator's divergences with the price. You can also get creative and apply all sorts of technical analysis to the RSI candlestick chart, including candlestick patterns analysis.
Candilator RSI can automatically scan the price for some candlestick patterns in the overbought and oversold zones. This feature can help detect price reversals early.
SETTINGS
The indicator settings are divided into two groups: Main Settings and Pattern Detection. In the Main Settings, you can find standard RSI settings. In the Pattern Detection part, you can turn on and off the automatic search for a particular candlestick pattern.
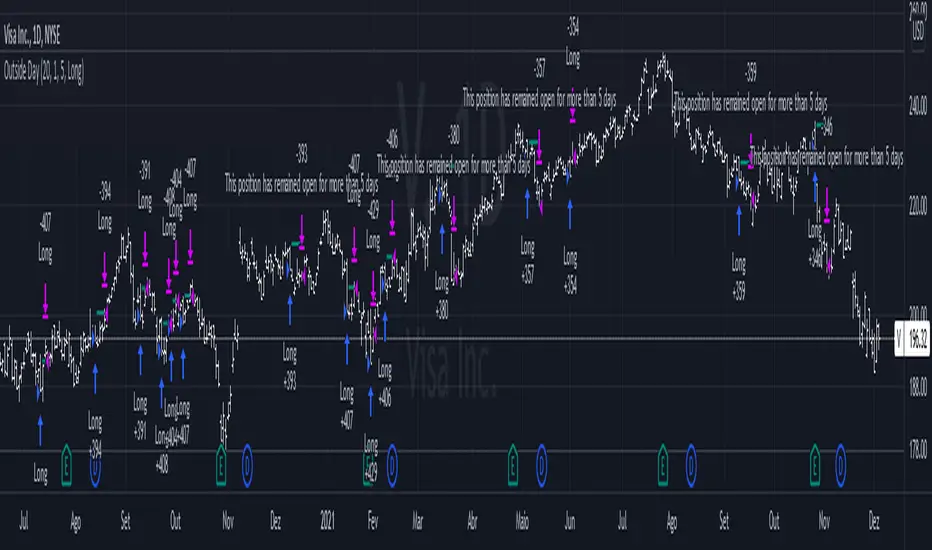
Outside DayThis strategy is taken from Perry Kaufman's book "Trading System and Methods".
You can enter on the direction of the candle, or opposite to it. I find that the opposite tends to yield better results in volatile assets, allowing a better reward to risk ratio. There is no stop loss in this strategy, only a fixed take profit and a time limitation.
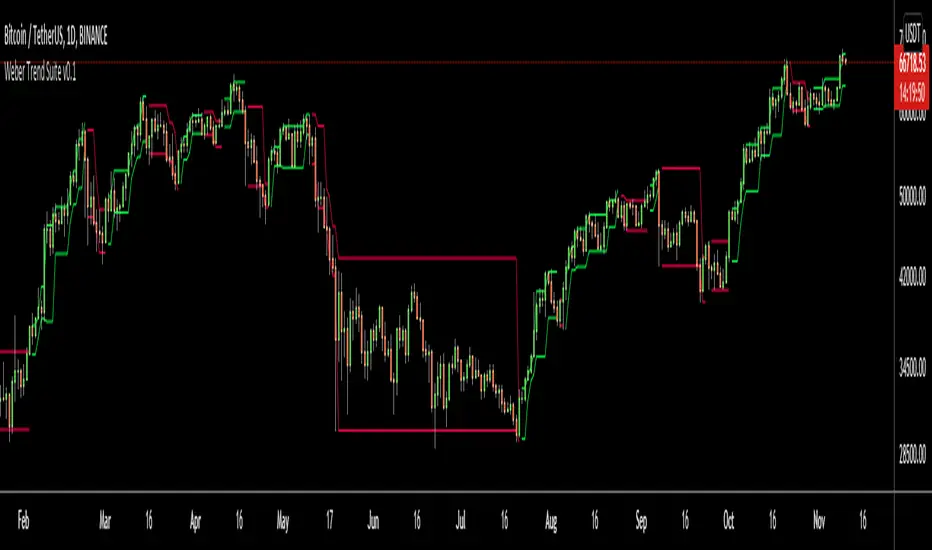
Weber Trend SuiteThe Weber Trend Suite (WTS) supports trend trading over longer timeframes.
Identification of the trend direction
Automatic identification of support and resistance level
Multi-Timeframe
Designed as a decision making framework for trading trending growth assets such as tech stocks and cryptocurrencies
The support and resistance lines are derived from the high, low and direction (bearish/bullish) from the latest outside bar at a time. The timeframe on which outside bars are detected can be chosen freely by the user. The importance of an outside bars tends to increase with the timeframe. Outside bars can play an important role in price action trading by providing support and resistance levels as well as the currently predominant trend direction. So this indicator enables a trader to automatically display the high, low and direction of the current outside bar from two different (usually higher) timeframes and therefore gives rationally and automatically derived support and resistance levels as well as the predominant trend direction from the chosen timeframes. The adjustable crossing EMA with its volatility noise filter gives further guidance on the current trend direction and strength.
The WTS can help traders and investors following a rule based system by providing a measure of trend strength and consistency as well as specific support and resistance levels.
Advanced OutSide with HMA and Klinger Forex Swing strategyThis is a swing forex strategy, adapted for big timeframes, such as 4h+.
For this example I adapted the strategy to EUR USD main forex pair.
Its components are:
Outside condition
Klinger Oscillator
Hull moving average
Rules for entry
For long: if current high is bigger than previous high and current is smaller than previous low and klinger is positive, close of the candle is above lsma and we have a bull candle.
For short: if current high is smaller than previous high and current is bigger than previous low and klinger is negative, close of the candle is below lsma and we have a bear candle.
Rules for exit
We exit when we have a reverse condition
We exit in case we hit the tp/sl based on % movement of the price.
If you have any questions, let me know !

Engulfing/Outside BarThis indicator provides a statistical report on the Engulfing/ Outside Bar candlestick pattern. Based on the chart's bars, it can improve your edge on any markets and timeframes.
Knowing there are many definitions about the Engulfing/ Outside Bar pattern, here we're strictly referring to one bar's body engulfing one other AND making a higher high and lower low.
The report is broken down into the different following sections: retracement , invalidation , continuation and breakout .
Each of them provides hindsights about the pattern price behavior and brings answers to questions such as: How often does price retrace? Does the pattern often invalidate? If it doesn't then does it break in the pattern's direction? How far does price go? What are the odds of a false breakout?
While there are many ways to make use of the metrics, my favorite use case is for developing directional and daily/weekly biases while refining my stop/entry/target positioning.
Miscellaneous
Highlights patterns on the chart;
Supports bar to bar analysis and replay functionalities;
Provides counts on the `Data Window` panel for debugging or computing your own metrics;
Settings
Option for filtering patterns that close outside previous bar;
Show/hide for toggling different sections;
Report coloring and offset on the x axis;
Gaining Access
This is a private indicator and is available only for my Patrons. You can reach my Patreon page below from the link in my signature.

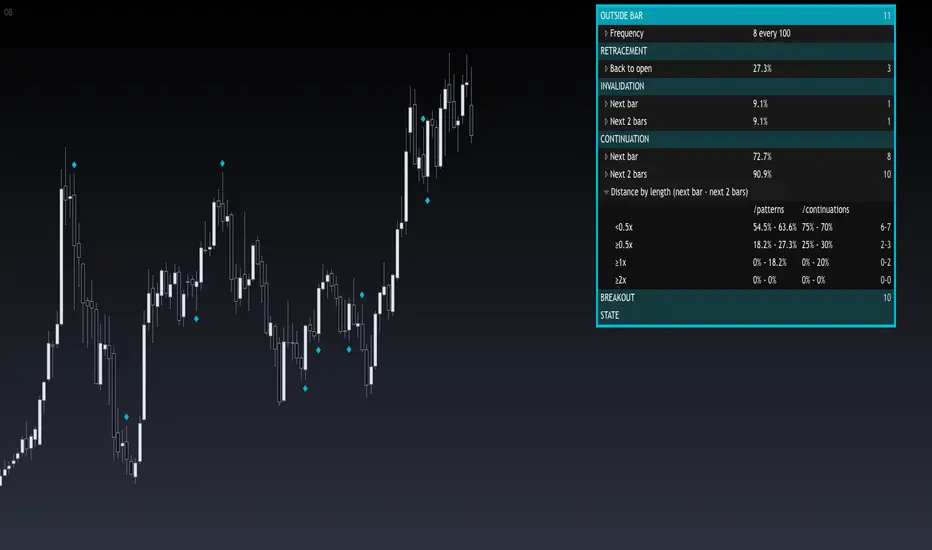
Outside BarThis indicator provides a statistical report on the Outside Bar candlestick pattern. Based on the chart's bars, it can improve your edge on any markets and timeframes.
Knowing there are many definitions about the Outside Bar pattern, here we're strictly referring to one bar's extremes beyond one other.
The report is broken down into the different following sections: retracement , invalidation , continuation and breakout .
Each of them provides hindsights about the pattern price behavior and brings answers to questions such as: How often does price retrace? Does the pattern often invalidate? If it doesn't then does it break in the pattern's direction? How far does price go? What are the odds of a false breakout?
While there are many ways to make use of the metrics, my favorite use case is for developing directional and daily/weekly biases while refining my stop/entry/target positioning.
Miscellaneous
Highlights patterns on the chart;
Supports bar to bar analysis and replay functionalities;
Provides counts on the `Data Window` panel for debugging or computing your own metrics;
Settings
Option for filtering patterns that close outside previous bar;
Show/hide for toggling different sections;
Report coloring and offset on the x axis;
Gaining Access
This is a private indicator and is available only for my Patrons. You can reach my Patreon page below from the link in my signature.
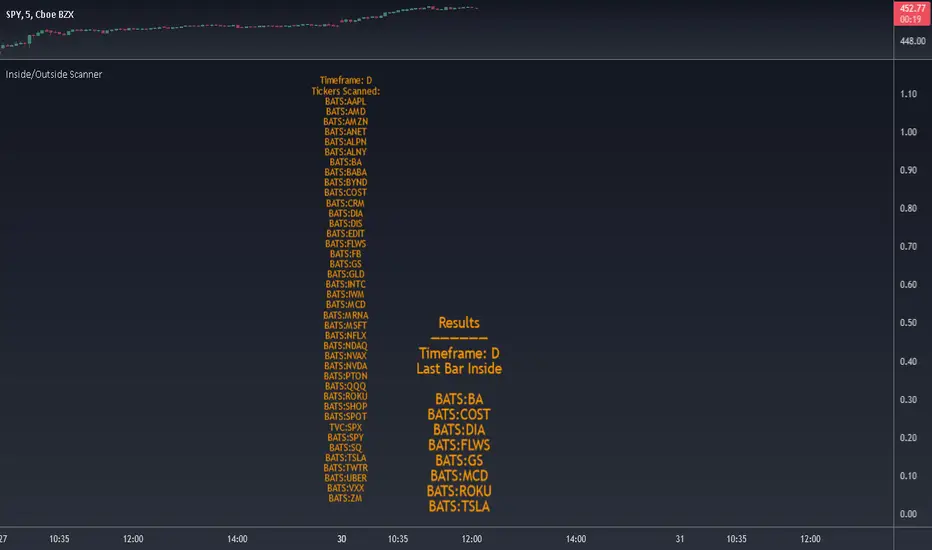
Inside/Outside Scanner40 tickers max. Can change the tickers in the settings.
Choose to scan for Inside or Outside bars for current bar or previous bar.
Also scans for 2 inside consecutive bars and 3 inside bars starting from the current candle.
Change timeframe in the settings. Default is set to 1D.
Please DM me to get access.
TheStratHelper Scanner
1= Inside Candle
2= Goes past the previous candle's price up or down
3= Goes past the previous candle's price on both sides
Ability to change the timeframe and the symbols this indicator is scanning through in the input tab under settings of this indicator. Maximum symbols 40. By default some symbols are entered in the indicator already. They cannot be left empty. If left empty, an error comes up and the script doesn't load.
Can look through many timeframes like monthly, weekly, daily by changing the timeframe in the input tab under settings. Default timeframe is set to 1 Day.
First label is for all of the symbols the indicator is scanning.
Second label is the result of the scan.
Scanning for
2 Up, 2 Down, 3-1, 2-1, 1-2, 2-2, Failed 2 going 3, Inside and Outside bars
Please DM me to get access to this indicator.

Screener Outside BarsBased on the teachings of Rob Smith
1= Inside Candle
2= Goes past the previous candle's price up or down
3= Goes past the previous candle's price on both sides
Outside Bar (3) is a bar that has broken the price of both sides of the previous bar.
Ability to change the timeframe and the symbols this indicator is scanning through in the input tab under settings of this indicator. Maximum symbols 40.
Looking for outside bars within 40 symbols. By default some symbols are entered in the indicator already. They cannot be left empty. If left empty, the script might not work properly.
By changing the timeframe, outside bars can be looked under many timeframes like Monthly, Weekly, Dialy, Intraday, etc.
First label is for all of the symbols the indicator is scanning.
Second label is the result of the scan. Text is bigger than in this label than the first label to differentiate from the first label and for ease of use.
Please DM me on how to access this indicator.

Two Fractals TrendlinesThis study draws a trend line for the last two Bill Williams up-fractals and down-fractals.
Trend line break signals and alerts can optionally be added.

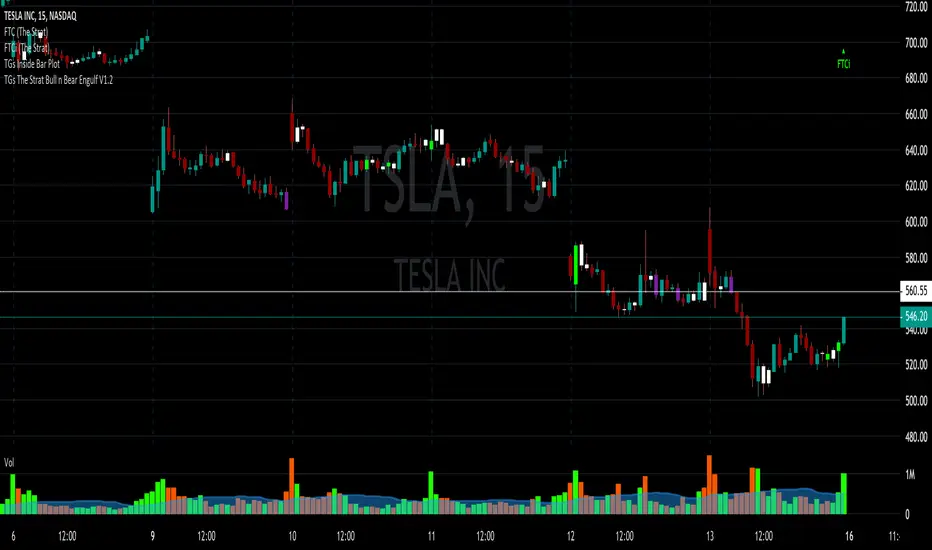
TGs The Strat Bull n Bear Engulf V1.2After accidentally violating house rules. I am republishing the script.
The script is based upon #TheStrat, which is Rob Smith's way of looking at price action.
It takes into account a candles ENTIRE range, wicks included.
So a Bullish candle (colored however you would like) when it closes will engulf the complete
range of the prior bar and indicate by painting the bar your color choice.
A Bearish will do the same.
In the Style menu, the first color will be the Bear color the second the Bull.
Any issues please let me know. Spread THE STRAT for all of mankind.