cd_indiCATor_CxGeneral:
This indicator is the redesigned, simplified, and feature-enhanced version of the previously shared indicators:
cd_cisd_market_Cx, cd_HTF_Bias_Cx, cd_sweep&cisd_Cx, cd_SMT_Sweep_CISD_Cx, and cd_RSI_divergence_Cx.
Within the holistic setup, the indicator tracks:
• HTF bias
• Market structure (trend) in the current timeframe
• Divergence between selected pairs (SMT)
• Divergence between price and RSI values
• Whether the price is in an important area (FVG, iFVG, and Volume Imbalance)
• Whether the price is at a key level
• Whether the price is within a user-defined special timeframe
The main condition and trigger of the setup is an HTF sweep with CISD confirmation on the aligned timeframe.
When the main condition occurs, the indicator provides the user with a real-time market status summary, enriched with other data.
________________________________________
What’s new?
-In the SMT module:
• Triad SMT analysis (e.g.: NQ1!, ES1!, and YM1!)
• Dyad SMT analysis (e.g.: EURUSD, GBPUSD)
• Alternative pair definition and divergence analysis for non-correlated assets
o For crypto assets (xxxUSDT <--> xxxUSDT.P) (e.g.: SOLUSDT.P, SOLUSDT)
o For stocks, divergence analysis by comparing the asset with its value in another currency
(BIST:xxx <--> BIST:xxx / EURTRY), (BAT:xxx <--> BAT:xxx / EURUSD)
-Special timeframe definition
-Configurable multi-option alarm center
-Alternative summary presentation (check list / status table / stickers)
________________________________________
Details and usage:
The user needs to configure four main sections:
• Pair and correlated pairs
• Timeframes (Auto / Manual)
• Alarm center
• Visual arrangement and selections
Pair Selections:
The user should adjust trading pairs according to their trade preferences.
Examples:
• Triad: NQ1!-ES1!-YM1!, BTC-ETH-Total3
• Dyad: NAS100-US500, XAUUSD-XAGUSD, XRPUSDT-XLMUSDT
Single pairs:
-Crypto Assets:
If crypto assets are not in the triad or dyad list, they are automatically matched as:
Perpetual <--> Spot (e.g.: DOGEUSDT.P <--> DOGEUSDT)
If the asset is already defined in a dyad list (e.g., DOGE – SHIB), the dyad definition takes priority.
________________________________________
-Stocks:
If stocks are defined in the dyad list (e.g.: BIST:THYAO <--> BIST:PGSUS), the dyad definition takes priority.
If not defined, the stock is compared with its value in the selected currency.
For example, in the Turkish Stock Exchange:
BIST:FENER stock, if EUR is chosen from the menu, is compared as BIST:FENER / OANDA:EURTRY.
Here, “OANDA” and the stock market currency (TRY) are automatically applied for the exchange rate.
For NYSE:XOM, its pair will be NYSE:XOM / EURUSD.
________________________________________
Timeframes:
By default, the menu is set to “Auto.” In this mode, aligned timeframes are automatically selected.
Aligned timeframes (LTF-HTF):
1m-15m, 3m-30m, 5m-1h, 15m-4h, 1h-D, 4h-W, D-M
Example: if monitoring the chart on 5m:
• 1h sweep + 5m CISD confirmation
• D sweep + 1h CISD confirmation (bias)
• 5m market structure
• 1h SMT and 1h RSI divergence analysis
For manual selections, the user must define the timeframes for Sweep and HTF bias.
FVG, iFVG, and Volume Imbalance timeframes must be manually set in both modes.
________________________________________
Alarm Center:
The user can choose according to preferred criteria.
Each row has options.
“Yes” → included in alarm condition.
“No” → not included in alarm condition.
If special timeframe criteria are added to the alarm, the hour range must also be entered in the same row, and the “Special Zone” tab (default: -4) should be checked.
Key level timeframes and plot options must be set manually.
Example alarm setup:
Alongside the main Sweep + CISD condition, if we also want HTF bias + Trend alignment + key level (W, D) and special timeframe (09:00–11:00), we should set up the menu as follows:
________________________________________
Visual Arrangement and Selections:
Users can control visibility with checkboxes according to their preferences.
In the Table & Sticker tab, table options and labels can be controlled.
• Summary Table has two options: Check list and Status Table
• From the HTF bias section, real-time bias and HTF sweep zone (optional) are displayed
• The RSI divergence section only shows divergence analysis results
• The SMT 2 sub-section only functions when triad is selected
Labels are shown on the bar where the sweep + CISD condition occurs, displaying the current situation.
With the Check box option, all criteria’s real-time status is shown (True/False).
Status Table provides a real-time summary table.
Although the menu may look crowded, most settings only need to be adjusted once during initial use.
________________________________________
What’s next?
• Suggestions from users
• Standard deviation projection
• Mitigation/order blocks (cd special mtg)
• PSP /TPD
________________________________________
Final note:
Every additional criterion in the alarm settings will affect alarm frequency.
Multiple conditions occurring at the same time is not, by itself, sufficient to enter a trade—you should always apply your own judgment.
Looking forward to your feedback and suggestions.
Happy trading! 🎉
インジケーターとストラテジー

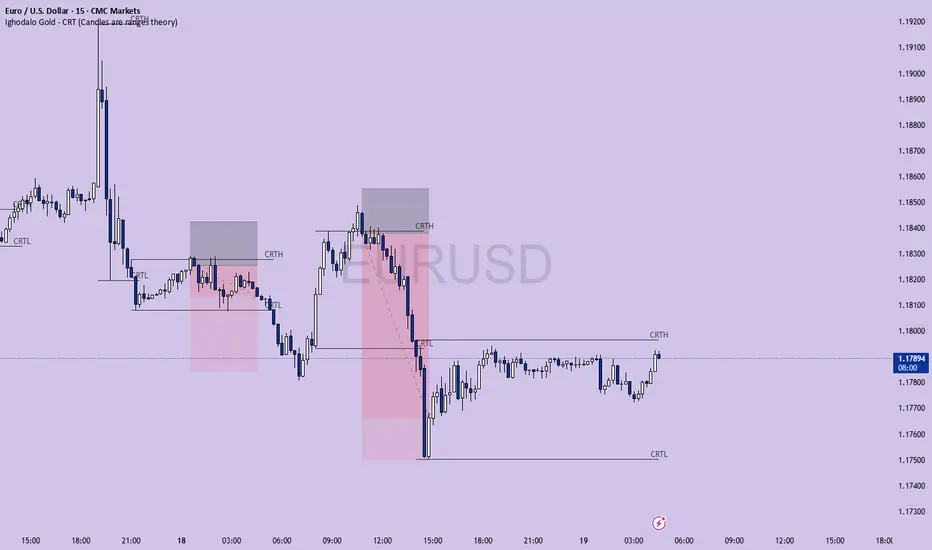
Ighodalo Gold - CRT (Candles are ranges theory)This indicator is designed to automatically identify and display CRT (Candles are Ranges Theory) Candles on your chart. It draws the high and low of the identified range and extends them until price breaks out, providing clear levels of support and resistance.
The Candles are Ranges Theory (CRT) concept was originally developed and shared by a trader named Romeotpt (Raid). All credit for the trading methodology goes to him. This indicator simply makes spotting these specific candles easier.
What is a CRT Candle & How Is It Used?
A CRT candle is a single candle that has both the highest high AND the lowest low over a user-defined period. It is identified by analysing a block of recent candles and finding the one candle that contains the entire price range of that block.
Once a CRT candle is formed, its high and low act as an accumulation range.
A break above or below this range is the manipulation phase.
A reclaim of the range (price closing back inside) signifies a potential distribution phase.
On higher timeframes, this sequence can be interpreted as:
Candle 1: Accumulation
Candle 2: Manipulation
Candle 3: Distribution
Reversal (Turtle Soup):
A sweep of the high or low, followed by a quick reclaim (price closing back inside the range), can signify a reversal. According to the theory’s originator, Romeo, this reversal pattern is called “turtle soup.”
After a bearish reversal at the high, the target becomes the CRT low.
After a bullish reversal at the low, the target becomes the CRT high.
How to Use This Indicator
The indicator is flexible and can be adapted to your trading style. The most important settings are:
Max Lookback Period: Number of past candles ("n") the indicator checks within to find a CRT.
CRT Timeframe:
Select a timeframe (e.g., 1H): The indicator will look at the higher timeframe you selected and plot the most recent CRT range from that timeframe onto your current chart. This is useful for multi-timeframe analysis.
Enable Overlapping CRTs:
False (unchecked): Shows only one active CRT range at a time. The indicator won’t look for a new one until the current range is broken.
True (checked): Constantly searches for and displays all CRT ranges it finds, allowing multiple ranges to appear on the chart simultaneously.
Disclaimer & Notes
-This is a visualisation tool and not a standalone trading signal. Always use it alongside your own analysis and risk management strategy.
-All credit for the "Candles are Ranges Theory" (CRT) concept goes to its creator, Romeotpt (Raid).
"On the journey to the opposite side of the range, price often provides multiple turtle soup entry opportunities. Follow their footprints." — Raid, 2025
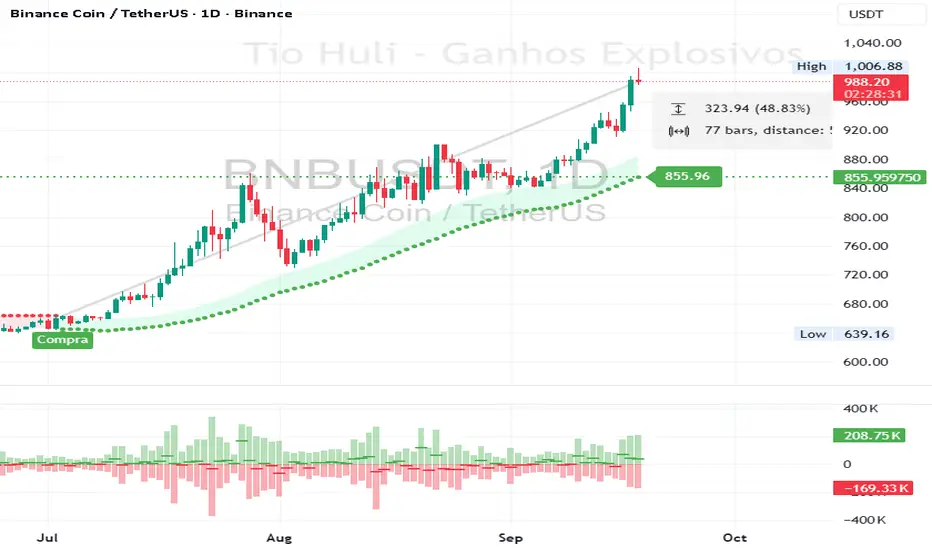
CHiLo — Custom HiLo (SMA/EMA, Activator, Shading, Auto-Decimals)CHiLo is a clean Hi/Lo trend read with SMA/EMA options, a HiLo vs. HiLo Activator mode, optional band shading , and a right-side HiLo marker with automatic decimals based on the symbol. Optional Buy/Sell labels mark state flips. Inspired by the broader trend-following literature and practitioners; in Brazil, educator Hulisses “Tio Huli” Dias is a notable voice popularizing trend following.
What it does
CHiLo plots a Hi/Lo state with two modes:
HiLo (classic high/low bands)
HiLo Activator (activator-style behavior)
It includes:
SMA/EMA selection
Optional shading between Hi/Lo bands
Optional Buy/Sell labels on state flips
HiLo marker (auto-decimals from the symbol’s tick size)
Goal: deliver a fast, visual trend context that you can pair with your own risk rules and confirmations.
How to use
Add the indicator and choose Mode (HiLo / Activator) and MA type (SMA/EMA).
Tune Period (and Offset if needed). Higher = smoother (fewer flips); lower = more responsive.
Toggle Shading to emphasize the envelope.
Toggle Buy/Sell labels if you want flip markers.
Use the HiLo marker on the right to read the current level (auto-formatted).
Inputs (quick reference)
Period / Offset — sensitivity vs. delay.
Type — HiLo or HiLo Activator.
MA Type — SMA (steadier) or EMA (snappier).
HiLo Style — Points or Line.
Shading & Transparency — highlight the band area.
Buy/Sell Labels — on/off.
HiLo Marker — size and horizontal offset (decimals automatic).
Notes & credits
Educational use only; not financial advice.
For best results, combine with position sizing, stops, and regime filters.
Salim ALHammadi-Telegram @salimalhammadiA trading indicator that works on all time frames shows signals for selling, buying, target, and stop loss.
By Salim ALHammadi

DrFX Reversal Algo - MACD-RSI System with Dynamic Zone Filtering**DrFX Reversal Algo** is a sophisticated reversal detection system that combines MACD momentum analysis with RSI confirmation and dynamic support/resistance zone filtering. This indicator employs advanced mathematical filtering techniques to identify high-probability reversal points while minimizing false signals through intelligent zone-based filtering.
**Core Innovation & Originality**
This system uniquely integrates four key analytical components:
1. **Enhanced MACD Engine** - Customizable fast (20), slow (50), and signal (12) lengths with crossover/crossunder detection optimized for reversal identification
2. **RSI Power Classification** - 14-period RSI used to classify signal strength and trend bias, distinguishing between "Strong" and regular signals
3. **Kalman-Filtered Dynamic Zones** - Advanced mathematical smoothing of support/resistance levels using Kalman filter algorithms for noise reduction
4. **Gradient-Based Visual System** - Power-weighted bar coloring that visualizes trend strength using MACD histogram and RSI signal intensity
**System Architecture & Functionality**
**Signal Generation Methodology:**
The core algorithm detects MACD line crossovers above and below the signal line, then applies RSI-based classification. When RSI signal (RSI-50) is positive during bullish MACD crossovers, the system generates "Strong Buy" signals. When RSI signal is negative or neutral, it produces regular "Buy" signals. The inverse logic applies for sell signals.
**Dynamic Zone Calculation:**
Support and resistance zones are calculated using a multi-step process:
1. **Volatility Bands**: ATR-based upper/lower bands using (high+low)/2 ± ATR * multiplier
2. **Precise Zone Definition**: Integration of 20-period highest/lowest calculations with volatility bands
3. **Kalman Filter Smoothing**: Advanced noise reduction using configurable Q (0.01) and R (0.1) parameters
4. **Zone Validation**: Real-time adjustment based on price action and volatility changes
**Kalman Filter Implementation:**
The system employs a custom Kalman filter function for zone smoothing:
```
kf_k = kf_p / (kf_p + kf_r)
kf_x = kf_k * input + (1 - kf_k) * previous_estimate
kf_p = (1 - kf_k) * kf_p + kf_q
```
This mathematical approach reduces zone boundary noise while maintaining responsiveness to genuine support/resistance level changes.
**Unique Visual Features**
**Power-Based Gradient System:**
Bar coloring utilizes a sophisticated gradient calculation based on MACD histogram power (absolute value) and RSI signal strength. The system creates dynamic color transitions:
- **Bullish Gradient**: Green spectrum (0-255 intensity) based on histogram power
- **Bearish Gradient**: Red spectrum (0-255 intensity) based on histogram power
- **Consolidation**: Mixed gradient indicating uncertain market conditions
**Dynamic Zone Visualization:**
- **Support Zones**: Blue-filled areas between smoothed support boundaries
- **Resistance Zones**: Red-filled areas between smoothed resistance boundaries
- **Zone Adaptation**: Real-time boundary adjustment based on volatility and price action
**Signal Classification System**
**Signal Strength Hierarchy:**
1. **Strong Buy**: MACD bullish crossover + RSI signal > 0 (above 50-line)
2. **Regular Buy**: MACD bullish crossover + RSI signal ≤ 0 (below 50-line)
3. **Strong Sell**: MACD bearish crossover + RSI signal < 0 (below 50-line)
4. **Regular Sell**: MACD bearish crossover + RSI signal ≥ 0 (above 50-line)
**Optional Zone Filtering:**
When enabled, the system only displays signals when:
- Buy signals: Price above smoothed support zone end
- Sell signals: Price below smoothed resistance zone start
**Usage Instructions**
**Primary Signal Interpretation:**
- **Large Green Triangles**: Strong buy signals with RSI confirmation above 50
- **Small Green Triangles**: Regular buy signals with RSI below 50
- **Large Red Triangles**: Strong sell signals with RSI confirmation below 50
- **Small Red Triangles**: Regular sell signals with RSI above 50
**Zone Analysis:**
- **Blue Zones**: Dynamic support areas where buying interest may emerge
- **Red Zones**: Dynamic resistance areas where selling pressure may increase
- **Zone Breaks**: Price movement outside zones indicates potential trend continuation
**Bar Color Interpretation:**
- **Bright Green**: Strong bullish momentum (high MACD histogram power + positive RSI)
- **Dark Green**: Moderate bullish momentum
- **Bright Red**: Strong bearish momentum (high MACD histogram power + negative RSI)
- **Dark Red**: Moderate bearish momentum
- **Mixed Colors**: Consolidation or uncertain trend direction
**Optimal Usage Strategies:**
1. **Reversal Trading**: Focus on signals occurring near zone boundaries
2. **Confirmation Trading**: Use zone filter to reduce false signals in trending markets
3. **Momentum Trading**: Prioritize "Strong" signals with bright gradient bar coloring
4. **Multi-Timeframe**: Combine with higher timeframe trend analysis for context
**Parameter Customization**
**MACD Settings:**
- **Fast Length (20)**: Shorter periods increase sensitivity
- **Slow Length (50)**: Longer periods reduce noise
- **Signal Smoothing (12)**: Affects crossover signal timing
**Support/Resistance Settings:**
- **Volatility Period (10)**: ATR calculation period for zone width
- **Multiplier (5.0)**: Zone expansion factor based on volatility
**Visual Settings:**
- **Gradient Range (2000)**: Controls color intensity scaling
- **Zone Filtering**: Enables/disables signal filtering based on zone position
**Advanced Features**
**Alert System:**
Comprehensive alert functionality with detailed messages including symbol, timeframe, current price, and signal type. Separate enable/disable options for long and short alerts.
**Mathematical Precision:**
The Kalman filter implementation provides superior noise reduction compared to simple moving averages while maintaining responsiveness to genuine market structure changes.
**Important Considerations**
This system works optimally in markets with clear support/resistance levels and moderate volatility. The Kalman filter smoothing may introduce slight lag during rapid market movements. Strong signals generally provide higher probability setups but may be less frequent than regular signals.
The algorithm combines established techniques (MACD, RSI) with advanced filtering and zone detection methodologies. The integration of multiple confirmation methods helps reduce false signals while maintaining sensitivity to genuine reversal opportunities.
**Disclaimer**: This indicator is designed for educational and analytical purposes. Past performance does not guarantee future results. The system's effectiveness varies across different market conditions and timeframes. Always implement proper risk management and consider multiple confirmation methods before making trading decisions.

Gann Trading Strategy📈 Simple & Powerful Gann-Based Trading System
This indicator automatically calculates key Gann support and resistance levels based on W.D. Gann's mathematical principles. Simply input either the highest price (for bearish setups) or lowest price (for bullish setups), and the indicator automatically generates all trading levels.
🎯 Key Features:
Automatic Level Calculation - Just select High/Low price projection basis
Complete Trading Framework - Entry zone, 3 Take Profit levels, and Exit level
Visual Trading Zones - Color-coded zones around each level for better entry/exit timing
Smart Alerts - Get notified when price reaches key levels
Bullish & Bearish Setups - Works for both long and short trading strategies
Customizable Display - Show/hide levels, adjust colors, line styles, and zone widths
🚀 How to Use:
Select "Lowest Price" for bullish setup or "Highest Price" for bearish setup
Input the relevant high or low price from your analysis
The indicator automatically calculates and displays all trading levels
Use the green entry zone for entries, blue levels for take profits, red level for exits
📊 Perfect for:
Swing trading
Position sizing and risk management
Support/resistance analysis
Multi-timeframe analysis
Uses time-tested Gann principles to automatically find key price levels for trading.

FSVZO [Alpha Extract]A sophisticated volume-weighted momentum oscillator that combines Fourier smoothing with Volume Zone Oscillator methodology to deliver institutional-grade flow analysis and divergence detection. Utilizing advanced statistical filtering including ADF trend analysis and multi-dimensional volume dynamics, this indicator provides comprehensive market sentiment assessment through volume-price relationships with extreme zone detection and intelligent divergence recognition for high-probability reversal and continuation signals.
🔶 Advanced VZO Calculation Engine
Implements enhanced Volume Zone Oscillator methodology using relative volume analysis combined with smoothed price changes to create momentum-weighted oscillator values. The system applies exponential smoothing to both volume and price components before calculating positive and negative momentum ratios with trend factor integration for market regime awareness.
🔶 Fourier-Based Smoothing Architecture
Features advanced Fourier approximation smoothing using cosine-weighted calculations to reduce noise while preserving signal integrity. The system applies configurable Fourier length parameters with weighted sum normalization for optimal signal clarity across varying market conditions with enhanced responsiveness to genuine trend changes.
// Fourier Smoothing Algorithm
fourier_smooth(src, length) =>
sum = 0
weightSum = 0
for i = 0 to length - 1
weight = cos(2 * π * i / length)
sum += src * weight
weightSum += weight
sum / weightSum
🔶 Intelligent Divergence Detection System
Implements comprehensive divergence analysis using pivot point methodology with configurable lookback periods for both standard and hidden divergence patterns. The system validates divergence conditions through range analysis and provides visual confirmation through plot lines, labels, and color-coded identification for precise timing analysis.
15MIN
4H
12H
🔶 Flow Momentum Analysis Framework
Calculates flow momentum by measuring oscillator deviation from its exponential moving average, providing secondary confirmation of volume flow dynamics. The system creates momentum-based fills and visual indicators that complement the primary oscillator analysis for comprehensive market flow assessment.
🔶 Extreme Zone Detection Engine
Features sophisticated extreme zone identification at ±98 levels with specialized marker system including white X markers for signals occurring in extreme territory and directional triangles for potential reversal points. The system provides clear visual feedback for overbought/oversold conditions with institutional-level threshold accuracy.
🔶 Dynamic Visual Architecture
Provides advanced visualization engine with bullish/bearish color transitions, dynamic fill regions between oscillator and signal lines, and flow momentum overlay with configurable transparency levels. The system includes flip markers aligned to color junction points for precise signal timing with optional bar close confirmation to prevent repainting.
🔶 ADF Trend Filtering Integration
Incorporates Augmented Dickey-Fuller inspired trend filtering using normalized price statistics to enhance signal quality during trending versus ranging market conditions. The system calculates trend factors based on mean deviation and standard deviation analysis for improved oscillator accuracy across market regimes.
🔶 Comprehensive Alert System
Features intelligent multi-tier alert framework covering bullish/bearish flow detection, extreme zone reversals, and divergence confirmations with customizable message templates. The system provides real-time notifications for critical volume flow changes and structural market shifts with exchange and ticker integration.
🔶 Performance Optimization Framework
Utilizes efficient calculation methods with optimized variable management and configurable smoothing parameters to balance signal quality with computational efficiency. The system includes automatic pivot validation and range checking for consistent performance across extended analysis periods with minimal resource usage.
This indicator delivers sophisticated volume-weighted momentum analysis through advanced Fourier smoothing and comprehensive divergence detection capabilities. Unlike traditional volume oscillators that focus solely on volume patterns, the FSVZO integrates volume dynamics with price momentum and statistical trend filtering to provide institutional-grade flow analysis. The system's combination of extreme zone detection, intelligent divergence recognition, and multi-dimensional visual feedback makes it essential for traders seeking systematic approaches to volume-based market analysis across cryptocurrency, forex, and equity markets with clearly defined reversal and continuation signals.

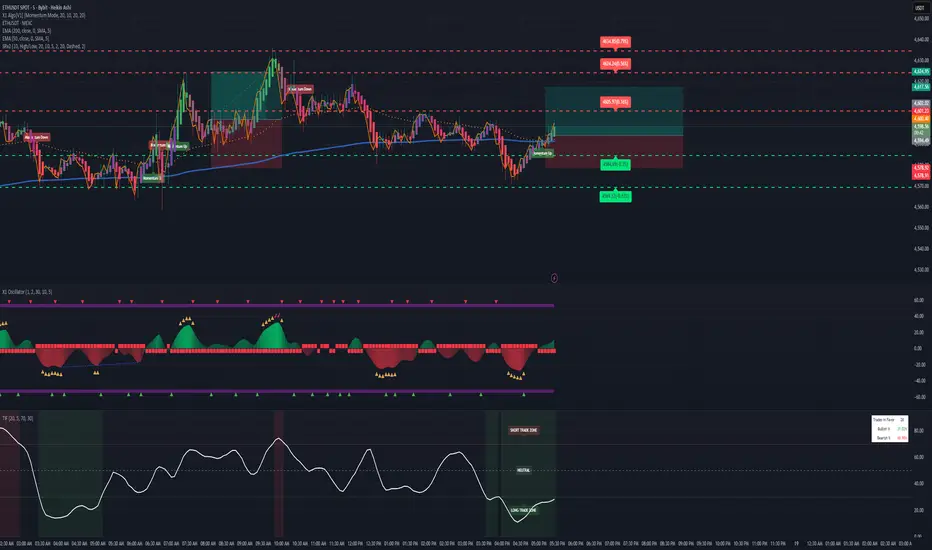
Trades in FavorTrades in Favor Indicator
Overview
The Trades in Favor indicator is a volume-weighted momentum oscillator that helps traders identify market conditions favoring long or short positions. It analyzes the relationship between price movements and volume to determine whether buying or selling pressure is dominating the market.
How It Works
The indicator calculates the percentage of volume-weighted price movements that are bullish versus bearish over a specified lookback period. It outputs values between 0-100:
Values above 70: Short Trade Zone (bearish conditions)
Values below 30: Long Trade Zone (bullish conditions)
Values around 50: Neutral Zone (balanced conditions)
Key Features
Volume-Weighted Analysis: Incorporates volume data for more accurate momentum readings
Clear Trading Zones: Visual zones with labels for immediate context
Customizable Parameters: Adjustable calculation length and smoothing periods
Built-in Alerts: Notifications when entering different trading zones
Information Table: Real-time display of current readings and percentages
Parameters
Calculation Length (20): Number of bars for momentum calculation
Smoothing Period (5): Moving average smoothing for cleaner signals
Short Trade Zone (70): Upper threshold for short trade conditions
Long Trade Zone (30): Lower threshold for long trade conditions
Trading Applications
Trend Confirmation: Validate trend direction with volume-backed momentum
Entry Timing: Identify optimal entry points in respective trade zones
Market Sentiment: Gauge overall buying vs selling pressure
Risk Management: Avoid trades against dominant market flow
Visual Elements
White oscillator line with clear zone boundaries
Background coloring in extreme zones
On-chart labels for immediate context
Information table showing current percentages
Customizable alert conditions
Best Practices
Use in conjunction with other technical analysis tools
Consider multiple timeframes for confirmation
Pay attention to volume spikes in extreme zones
Watch for divergences between price and the indicator
Perfect for swing traders, day traders, and anyone looking to align their trades with volume-backed market momentum.
Rolling VWAP with Standard Deviation Bands and AlertsA Rolling Volume Weighted Average Price (RVWAP) indicator featuring dynamic standard deviation bands and customizable alerts.
This indicator automatically adapts its calculation period to the chart timeframe while providing precise entry and exit signals through statistical deviation levels.
Automatic time period adjustment based on chart timeframe
Manual time period override option (days, hours, minutes)
Volume-weighted price calculations with variance safeguards
Five Standard Deviation Levels
Individual toggles for 1σ, 1.5σ, 2σ, 2.5σ, and 3σ bands
Color-coded visualization with gradient transparency
Red bands above RVWAP (resistance levels)
Green bands below RVWAP (support levels)
Orange RVWAP centerline
Smart Alert System
Separate BUY and SELL alert conditions
Individual band selection for alerts
Visual Triangle Alerts
Optional triangle markers on band crossings
Size and transparency graded by significance level
Tiny triangles for 1σ/1.5σ (frequent signals)
Normal triangles for 3σ (extreme moves)
Momentum and mean reversion trading
Support and resistance identification
Volatility-based position sizing
Multi-timeframe analysis

[delta2win] Liquidity Zone Map🔥 Liquidity Zone Map — Volume‑normalized pivot zones with adaptive ATR scaling
📊 What it does:
• Detects potential liquidity/liquidation zones above confirmed highs and below confirmed lows
• Draws dynamic zones whose height scales with ATR and whose color intensity scales with volume
• Zones extend right and terminate on rule‑based events (midline cross)
🔬 How it works (core formulas):
• Pivot detection: ta.pivothigh/ta.pivotlow with length L
• Zone height: H = max(ATR(T) × M, MinTicks)
• Intensity (volume‑normalized):
– Z‑Score mode: I = clamp((V − μ) / (σ + ε), 0..1)
– Piecewise mode: I = clamp(V ≤ μ ? V/μ : (V − μ) / (Vmax − μ + ε), 0..1)
• Gradient color: col = Gradient(I) (start → mid → end)
• Zone life‑cycle:
– Creation on new pivot (top/bottom)
– Right edge follows bar_index
– Termination when with Mid = (Top+Bottom)/2, or optional TTL timeout
• Analysis range: global or constrained (Bars Back or ±% price window). Color scaling can be global or range‑scoped.
🆕 What’s new/different:
• Selectable volume normalization (Z‑Score or Piecewise)
• Timeframe‑adaptive ATR multiplier
• Range‑scoped vs. global color scaling
• Optional midlines, borders, info legend, scale legend
• Optional TTL termination for zones (lifetime in bars)
• Object management (cleanup/pooling) for performance
🧭 How to use (suggested presets):
• 1–5m: L=2, T=200, M=0.25, Range=Bars Back 1000, Intensity=Piecewise
• 15–60m: L=3, T=200, M=0.20, Range=Bars Back 1500, Intensity=Piecewise
• 4h+: L=4, T=200, M=0.20, Range=Off, Intensity=Z‑Score
⚙️ Settings:
• Pivot length L, ATR length T, multiplier M, MinTicks
• Opacity: base/auto (min/max)
• Range: Bars Back | Price Range ±% | Off
• Scaling: global vs. range‑scoped
• Midlines/borders/legends on/off
💡 Usage notes:
• Smaller L → more reactive, less robust
• Larger M → longer‑lasting zones
• On higher TFs, constrain "Bars Back" for performance
⚠️ Limitations:
• Non‑predictive; regime/volatility dependent
• Data quality impacts intensity computation

Buy and Sell Signals (Altius Consulting)Generates Buy and Sell signals based on MACD and RSI.
- Plots MACD, Signal & Histogram (optional pane).
- Buy Label (toggle): Bullish MACD crossover + RSI < threshold (no convergence requirement).
- Sell Label: Bearish MACD crossover (MACD crosses below Signal) prints a SELL tag.
- Alert: Provided for convergence-based buy condition (add your own for simple crossover if desired).

Cycle Low (RSI + StochRSI) – v5 John.KCycle Low (RSI + StochRSI) – v5 John.K
This tool is designed to detect potential cycle lows by combining RSI and Stochastic RSI oversold signals.
RSI Oversold + Cross → confirms momentum exhaustion
StochRSI Cross from Oversold → confirms short-term cycle turn
Score System (0–4) → evaluates confluence strength
Strict Mode → requires both RSI and StochRSI to be oversold for A+ signals
One-Bar Tolerance → allows RSI & StochRSI to cross within 1 bar
Anchor Option → optional reference level for cycle projection
Signals are plotted directly on the candles as green triangles (CL) when conditions are met.
Adjust thresholds (RSI, Stoch, Score) to control signal frequency.

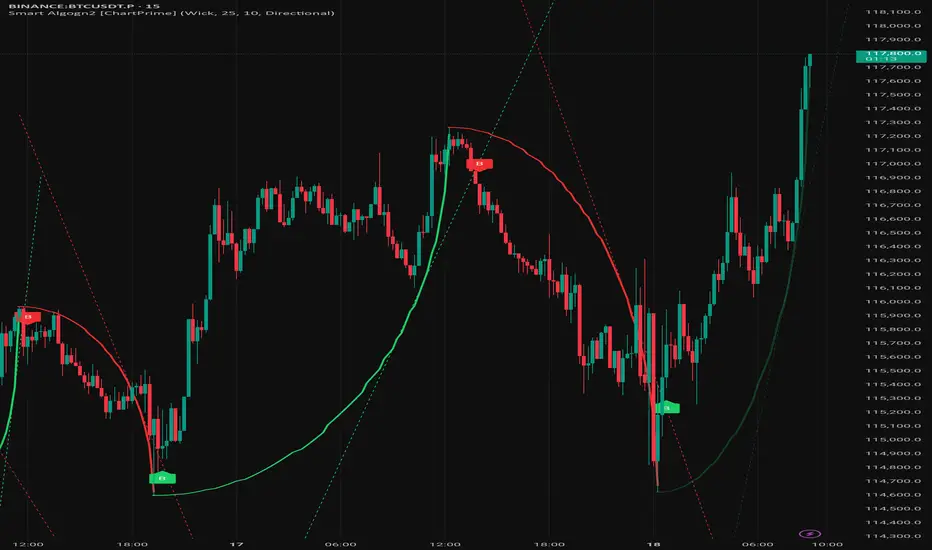
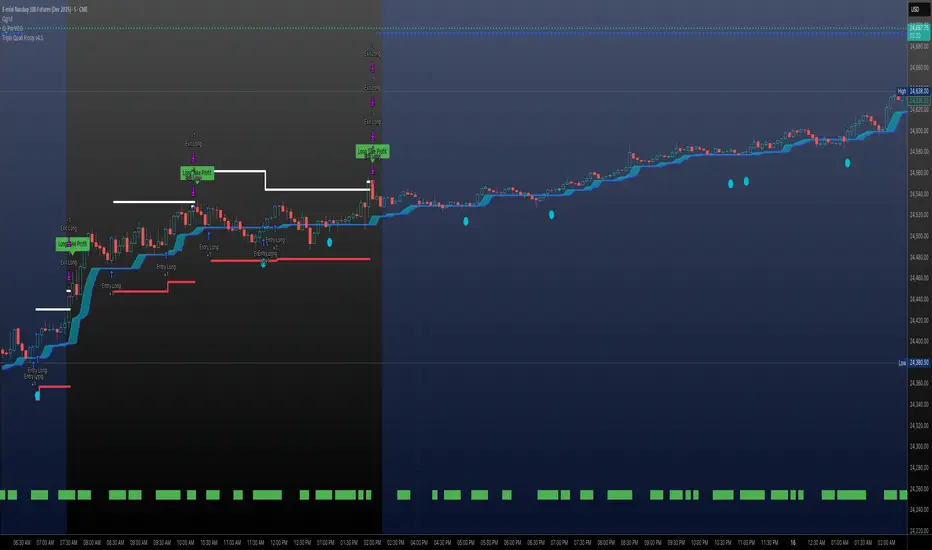
Smart Algogn2 [ChartPrime]Smart Algo indicator with buy/sell signals, optimized for crypto intraday trading.
Triple Quad Frosty v4.5Triple Quad Frosty v4.5 is a Renko-friendly strategy that lets you trade from up to four signal sources per side. Orders are only placed when your chosen conditional filters (A/B/C) agree, giving you full control over when entries are valid. You decide how signals must line up — from simple single-source triggers to majority or full agreement across all four.
Renko-based, with customizable static stops, take profits, and trailing stops. Time/day filters, daily trade limits, and forced closures let you restrict trading to specific windows.
The HTF filters in Triple Quad Frosty v4.5 use a higher-timeframe Hull Moving Average (HMA) to confirm trend direction, while slope and distance settings on the local HMA help filter out weak or choppy setups. Longs only trigger when price is above the HTF HMA and meets slope/distance requirements, and shorts only when the opposite is true.
Color-coded labels mark each exit as a win or loss, with reversal trades labeled separately for clarity. Conditional bars plotted above and below the chart show when the A/B/C filters align on a long or short bias, giving clear visual confirmation of entry conditions. Stop loss and take profit levels are plotted directly on the chart with guide lines, so you can easily track active trade management in real time.
Sean Trades Style IndicatorThe Sean Trades Style Indicator is a powerful, user-friendly trading tool designed for swing traders who want to trade like Sean from the Options Cartel. It identifies high-probability buy and sell signals based on pivot points, trend confirmations, and price action patterns, helping traders enter and exit trades with precision. Compatible with multiple timeframes, it allows you to set up on daily and weekly charts while executing entries on lower timeframes like 15-minute and 5-minute charts, aligning perfectly with Sean’s strategy. Whether you’re looking to simplify decision-making or follow a proven swing trading approach, this indicator gives you clear visual cues to trade with confidence and consistency.

My Crossover AlertCross over of EMA - Krish
This is the big crossover of two Long EMAs . When it comes to Day indicator. Most probably the price might shoot up.
Linear Regression Oscillator [ChartPrime]Ive added alerts for the hollow diamond reversions up or down.

MACD Scaled Overlay█ OVERVIEW
The "MACD Scaled Overlay" indicator is an advanced version of the classic MACD (Moving Average Convergence Divergence) oscillator that displays signals directly on the price chart. Instead of a traditional separate panel, the MACD line, signal line, and histogram are scaled and overlaid on the price chart, making it easier to identify key price levels and potential reversal points. The indicator also supports the detection of divergences (regular and hidden) and offers extensive customization options, such as adjusting colors, line thickness, and enabling/disabling visual elements.
█ CONCEPTS
The "MACD Scaled Overlay" indicator is designed to simplify trend and reversal analysis by integrating MACD signals with the price chart. The MACD Scaled Overlay is scaled relative to the average candle range, allowing the lines and histogram to dynamically adjust to market volatility. Additionally, the indicator enables the detection of divergences (bullish and bearish, both regular and hidden) based on the traditional MACD histogram (before scaling), ensuring consistency with classic divergence analysis. The indicator is most effective when combined with other technical analysis tools, such as Fibonacci levels, pivot points, or trend lines.
█ MACD Calculations and Scaling
The indicator is based on the classic MACD formula, which includes:
-MACD Line: The difference between the fast EMA (default: 12) and the slow EMA (default: 26).
-Signal Line: The EMA of the MACD line (default: 9).
-Histogram: The difference between the MACD line and the signal line.
Scaling is achieved by normalizing the MACD values relative to the standard deviation and the average candle range. This makes the lines and histogram dynamically adjust to market volatility, improving their readability and utility on the price chart. The scaling formulas are:
-MACD Scaled: macdNorm * avgRangeLines * scaleFactor
-Signal Scaled: signalNorm * avgRangeLines * scaleFactor
-Histogram Scaled: histNorm * avgRangeHist * scaleFactor
Where:
-macdNorm and signalNorm are the normalized MACD and signal line values.
-avgRangeLines and avgRangeHist are the average candle ranges.
-scaleFactor is the scaling multiplier (default: 2).
The positioning of the lines and histogram is relative to the candle midpoint (candleMid = (high + low) / 2), ensuring proper display on the price chart. Divergences are calculated based on the traditional MACD histogram (before scaling), maintaining consistency with standard divergence detection methodology.
█INDICATOR FEATURES
-Dynamic MACD and Signal Lines: Scaled and overlaid on the price chart, facilitating the identification of reversal points.
-Histogram: Displays the difference between the MACD and signal lines, dynamically adjusted to market volatility.
-Divergence Detection: Ability to detect regular and hidden divergences (bullish and bearish) based on the traditional MACD histogram, with options to enable/disable their display.
-Visual Customization: Options to adjust colors, line thickness, transparency, and enable/disable elements such as the zero line, MACD line, signal line, or histogram.
-Smoothing: Smoothing length for lines (default: 1) and histogram (default: 3). Smoothing may delay crossover signals, which should be considered during analysis.
-Alerts: Alert conditions for MACD and signal line crossovers, enabling notifications for potential buy/sell signals.
█ HOW TO SET UP THE INDICATOR
-Add the "MACD Scaled Overlay" indicator to your TradingView chart.
-Configure parameters in the settings, such as EMA lengths, scaling multiplier, or smoothing periods, to match your trading style.
-Enable or disable the display of the zero line, MACD line, signal line, or histogram based on your needs.
-Adjust colors and line thickness in the "Style" section and transparency settings in the input section to optimize visualization.
█ HOW TO USE
Add the indicator to your chart, configure the parameters, and observe the interactions of the price with the MACD line, signal line, and histogram to identify potential entry and exit points. Key signals include:
-MACD and Signal Line Crossovers: A crossover of the MACD line above the signal line may indicate a buy signal (bullish cross), while a crossover below the signal line may indicate a sell signal (bearish cross).
-Crossings Through the Price Line (Zero): The MACD line or histogram crossing the price line (candle midpoint) may indicate a change in momentum. For example, the histogram moving from negative to positive values near the price line may signal increasing bullish trend strength.
-Divergences: Detection of regular and hidden divergences (bullish and bearish) based on the traditional MACD histogram can help predict trend reversals. Divergences are not standalone signals, as they are delayed by the specified pivot length (default: 3). However, they help strengthen the significance of other signals, such as crossovers or support/resistance levels.
The indicator is most effective when combined with other tools, such as Fibonacci levels, pivot points, or support/resistance lines, to confirm signals.

Wickless Heikin Ashi B/S [CHE]Wickless Heikin Ashi B/S \
Purpose.
Wickless Heikin Ashi B/S \ is built to surface only the cleanest momentum turns: it prints a Buy (B) when a bullish Heikin-Ashi candle forms with virtually no lower wick, and a Sell (S) when a bearish Heikin-Ashi candle forms with no upper wick. Optional Lock mode turns these into one-shot signals that hold the regime (bull or bear) until the opposite side appears. The tool can also project dashed horizontal lines from each signal’s price level to help you manage entries, stops, and partial take-profits visually.
How it works.
The indicator computes standard Heikin-Ashi values from your chart’s OHLC. A bar qualifies as bullish if its HA close is at or above its HA open; bearish if below. Then the wick on the relevant side is compared to the bar’s HA range. If that wick is smaller than your selected percentage threshold (plus a tiny tick epsilon to avoid rounding noise), the raw condition is considered “wickless.” Only one side can fire; on the rare occasion both raw conditions would overlap, the bar is ignored to prevent false dual triggers. When Lock is enabled, the first valid signal sets the active regime (background shaded light green for bull, light red for bear) and suppresses further same-side triggers until the opposite side appears, which helps reduce overtrading in chop.
Why wickless?
A missing wick on the “wrong” side of a Heikin-Ashi candle is a strong hint of persistent directional pressure. In practice, this filters out hesitation bars and many mid-bar flips. Traders who prefer entering only when momentum is decisive will find wickless bars useful for timing entries within an established bias.
Visuals you get.
When a valid buy appears, a small triangle “B” is plotted below the bar and a green dashed line can extend to the right from the signal’s HA open price. For sells, a triangle “S” above the bar and a red dashed line do the same. These lines act like immediate, price-anchored references for stop placement and profit scaling; you can shift the anchor left by a chosen number of bars if you prefer the line to start a little earlier for visual alignment.
How to trade it
Establish context first.
Pick a timeframe that matches your style: intraday index or crypto traders often use 5–60 minutes; swing traders might prefer 2–4 hours or daily. The tool is agnostic, but the cleanest results occur when the market is already trending or attempting a fresh breakout.
Entry.
When a B prints, the simplest rule is to enter long at or just after bar close. A conservative variation is to require price to take out the high of the signal bar in the next bar(s). For S, invert the logic: enter short on or after close, or only if price breaks the signal bar’s low.
Stop-loss.
Place the stop beyond the opposite extreme of the signal HA bar (for B: under the HA low; for S: above the HA high). If you prefer a static reference, use the dashed line level (signal HA open) or an ATR buffer (e.g., 1.0–1.5× ATR(14)). The goal is to give the trade enough room that normal noise does not immediately knock you out, while staying small enough to keep the risk contained.
Take-profit and management.
Two pragmatic approaches work well:
R-multiple scaling. Define your initial risk (distance from entry to stop). Scale out at 1R, 2R, and let a runner go toward 3R+ if structure holds.
Trailing logic. Trail behind a short moving average (e.g., EMA 20) or progressive swing points. Many traders also exit on the opposite signal when Lock flips, especially on faster timeframes.
Position sizing.
Keep risk per trade modest and consistent (e.g., 0.25–1% of account). The indicator improves timing; it does not replace risk control.
Settings guidance
Max lower wick for Bull (%) / Max upper wick for Bear (%).
These control how strict “wickless” must be. Tighter values (0.3–1.0%) yield fewer but cleaner signals and are great for strong trends or low-noise instruments. Looser values (1.5–3.0%) catch more setups in volatile markets but admit more noise. If you notice too many borderline bars triggering during high-volatility sessions, increase these thresholds slightly.
Lock (one-shot until opposite).
Keep Lock ON when you want one decisive signal per leg, reducing noise and signal clusters. Turn it OFF only if your plan intentionally scales into trends with multiple entries.
Extended lines & anchor offset.
Leave lines ON to maintain a visual memory of the last trigger levels. These often behave like near-term support/resistance. The offset simply lets you start that line one or more bars earlier if you prefer the look; it does not change the math.
Colors.
Use distinct bull/bear line colors you can read easily on your theme. The default lime/red scheme is chosen for clarity.
Practical examples
Momentum continuation (long).
Price is above your baseline (e.g., EMA 200). A B prints with a tight lower wick filter. Enter on close; stop under the signal HA low. Price pushes up in the next bars; you scale at 1R, trail the rest with EMA 20, and finally exit when a distant S appears or your trail is hit.
Breakout confirmation (short).
Following a range, price breaks down and prints an S with no upper wick. Enter short as the bar closes or on a subsequent break of the signal bar’s low. If the next bar immediately rejects and prints a bullish HA bar, your stop above the signal HA high limits damage. Otherwise, ride the move, harvesting partials as the red dashed line remains unviolated.
Alerts and automation
Set alerts to “Once Per Bar Close” for stability.
Bull ONE-SHOT fires when a valid buy prints (and Lock allows it).
Bear ONE-SHOT fires for sells analogously.
With Lock enabled, you avoid multiple pings in the same direction during a single leg—useful for webhooks or mobile notifications.
Reliability and limitations
The script calculates from completed bars and does not use higher-timeframe look-ahead or repainting tricks. Heikin-Ashi smoothing can lag turns slightly, which is expected and part of the design. In narrow ranges or whipsaw conditions, signals naturally thin out; if you must trade ranges, either tighten the wick filters and keep Lock ON, or add a trend/volatility filter (e.g., trade B only above EMA 200; S only below). Remember: this is an indicator, not a strategy. If you want exact statistics, port the triggers into a strategy and backtest with your chosen entry, stop, and exit rules.
Final notes
Wickless Heikin Ashi B/S \ is a precision timing tool: it waits for decisive, wickless HA bars, provides optional regime locking to reduce noise, and leaves clear price anchors on your chart for disciplined management. Use it with a simple framework—trend bias, fixed risk, and a straightforward exit plan—and it will keep your execution consistent without cluttering the screen or your decision-making.
Disclaimer: This indicator is for educational use and trade assistance only. It is not financial advice. You alone are responsible for your risk and results.
Enhance your trading precision and confidence with Wickless Heikin Ashi B/S ! 🚀
Happy trading
Chervolino

Apex Edge – Wolfe Wave HunterApex Edge – Wolfe Wave Hunter
The modern Wolfe Wave, rebuilt for the algo era
This isn’t just another Wolfe Wave indicator. Classic Wolfe detection is rigid, outdated, and rarely tradable. Apex Edge – Wolfe Wave Hunter re-engineers the pattern into a modern, SMC-driven model that adapts to today’s liquidity-dominated markets. It’s not about drawing pretty shapes – it’s about extracting precision entries with asymmetric risk-to-reward potential.
🔎 What it does
Automatic Wolfe Wave Detection
Identifies bullish and bearish Wolfe Wave structures using pivot-based logic, symmetry filters, and slope tolerances.
Channel Glow Zones
Highlights the Wolfe channel and projects it forward into the future (bars are user-defined). This allows you to see the full potential of the trade before price even begins its move.
Stop Loss (SL) & Entry Arrow
At the completion of Wave 5, the algo prints a Stop Loss line and a tiny entry arrow (green for bullish, red for bearish). but the colours can be changed in user settings. This is the “execution point” — where the Wolfe setup becomes tradable.
Target Projection Lines
TP1 (EPA): Derived from the traditional 1–4 line projection.
TP2 (1.272 Fib): Optional secondary profit target.
TP3 (1.618 Fib): Optional extended target for large runners.
All TP lines extend into the future, so you can track them as price evolves.
Volume Confirmation (optional)
A relative volume filter ensures Wave 5 is formed with meaningful market participation before a setup is confirmed.
Alerts (ready out of the box)
Custom alerts can be fired whenever a bullish or bearish Wolfe Wave is confirmed. No need to babysit the charts — let the script notify you.
⚙️ Customisation & User Control
Every trader’s market and style is different. That’s why Wolfe Wave Hunter is fully customisable:
Arrow Colours & Size
Works on both light and dark charts. Choose your own bullish/bearish entry arrow colours for maximum visibility.
Tolerance Levels
Adjust symmetry and slope tolerance to refine how strict the channel rules are.
Tighter settings = fewer but cleaner zones.
Looser settings = more frequent setups, but with slightly lower structural quality.
Channel Glow Projection
Define how many bars forward the channel is drawn. This controls how far into the future your Wolfe zones are extended.
Stop Loss Line Length
Keep the SL visible without it extending infinitely across your chart.
Take Profit Line Colors
Each TP projection can be styled to your preference, allowing you to clearly separate TP1, TP2, and TP3.
This isn’t a one-size-fits-all tool. You can shape Wolfe detection logic to match the pairs, timeframes, and market conditions you trade most.
🚀 Why it’s different
Classic Wolfe waves are rare — this script adapts the model into something practical and tradeable in modern markets.
Liquidity-aligned — many setups align with structural sweeps of Wave 3 liquidity before driving into profit.
Entry built-in — most Wolfe scripts only draw the structure. Wolfe Wave Hunter gives you a precise entry point, SL, and projected TPs.
Backtest-friendly — you’ll quickly discover which assets respect Wolfe waves and which don’t, creating your own high-probability Wolfe watchlist.
⚠️ Limitations & Disclaimer
Not all markets respect Wolfe Waves. Some FX pairs, metals, and indices respect the structure beautifully; others do not. Backtest and create your own shortlist.
No guaranteed sweeps. Many entries occur after a liquidity sweep of Wave 3, but not all. The algo is designed to detect Wolfe completion, not enforce textbook liquidity rules.
Probabilistic, not predictive. Wolfe setups don’t win every time. Always use risk management.
High-RR focus. This is not a high-frequency tool. It’s designed for precision, asymmetric setups where risk is small and reward potential is large.
✅ The Bottom Line
Apex Edge – Wolfe Wave Hunter is a modern reimagination of the Wolfe Wave. It blends structural geometry, liquidity dynamics, and algo-driven execution into a single tool that:
Detects the pattern automatically
Provides SL, entry, and TP levels
Offers alerts for hands-off trading
Allows deep customisation for different markets
When it hits, it delivers outstanding risk-to-reward. Backtest, refine your tolerances, and build your watchlist of assets where Wolfe structures consistently pay.
This isn’t just Wolfe detection — it’s Wolfe trading, rebuilt for the modern trader.
Developer Notes - As always with the Apex Edge Brand, user feedback and recommendations will always be respected. Simply drop us a message with your comments and we will endeavour to address your needs in future version updates.

ORB Pro w/ Filters + Debug Overlay Update with Reason box fixThis indicator is designed to highlight high-probability reversal setups for intraday traders.
It focuses on the cleanest, most reliable candlestick reversal patterns and combines them with trend, VWAP/EMA confluence, and a time-based filter to reduce noise.
🛠️ How It Works
The script scans each bar for well-known reversal signals:
Doji Reversal – small body, long wicks showing indecision.
Hammer / Shooting Star – long wick ≥ 2× body, showing exhaustion.
Engulfing Reversal – full body engulf of the prior candle.
Additional filters include:
✅ VWAP/EMA Confluence (optional) – confirms reversals near key intraday levels.
✅ Time Window (default 9:30–10:30 NY) – avoids false signals later in the session.
✅ Trend Exhaustion Check – requires a short-term directional push before reversal.
✅ Signal Cooldown – limits to one clean signal per move.
When conditions align, the script plots:
🟢 “Bull Rev” label below the bar for bullish reversals.
🔴 “Bear Rev” label above the bar for bearish reversals.
⚙️ Recommended Settings
For the tightest, most reliable signals:
Doji Body % → 25–30
Hammer Wick Multiple → 2.0
Confluence Tolerance % → 0.2–0.3
Time Filter → ON (9:30–10:30 NY)
VWAP/EMA Filter → ON
Cooldown Bars → 10–15
These settings minimize false positives and focus on the strongest reversals.
📈 Use Case
This tool is best for:
Intraday traders (stocks, ETFs, futures, crypto).
Traders who use Opening Range Breakout (ORB) or similar systems but want a secondary tool for catching reversals.
Anyone looking to filter out weak reversal patterns and focus on textbook setups.
⚠️ Disclaimer
This script is for educational purposes only and should not be considered financial advice. Always test in simulation/paper trading before applying live
🚀 Catch textbook reversals with confidence.
This indicator filters out noise and only plots high-probability reversal signals based on proven candlestick patterns + VWAP/EMA confluence.
🔥 Key Features:
✅ Detects Doji, Hammer/Shooting Star, and Engulfing Reversals
✅ VWAP & EMA confluence filter (optional)
✅ Time window filter (default 9:30–10:30 NY for max edge)
✅ Signal cooldown to avoid clutter
✅ Clean chart labels + alert conditions
🎯 Who’s It For?
Day traders who want precision reversal entries
ORB traders looking for secondary setups
Intraday scalpers who value quality over quantity
👉 Designed for traders who want fewer, cleaner, higher-probability signals.
⚠️ Not financial advice. For educational use only
_____
🎯 ORB SET-UP DESCRIPTIONS:
🔧 Exact settings I’d recommend (to avoid that mess):
requireClose = true
requireRetest = true with retestPct = 0.2%
minRangePct = 0.3%, maxRangePct = 1.5%
volumeFilter = true, volumeLength = 20
trendFilter = true, emaLength = 20
cooldownBars = 6 (on 5m chart → 30 minutes)
🔑 ORB Range Settings
Default sweet spot: 0.2% – 0.3%
→ This usually balances enough signals with reduced false breakouts.
High volatility days (CPI, FOMC, big gaps): 0.3% – 0.5%
→ Prevents fake outs.
Low volatility days (tight overnight range, slow open): 0.15% – 0.2%
→ Keeps you from sitting on hands all day.
📌 Filters you already added help you avoid noise
EMA alignment
Volume confirmation
Optional stop/target logic
This means you don’t have to shrink the box to 0.1% — the filters will keep you in higher-probability trades
✅ Why You Might NOT See a Signal
Check box for reason signal to turn it off, updated coloring so that candles are more visable.
ORB Box Too Wide
If the opening range is large, price has to move much further to trigger a clean breakout.
Wide box = fewer signals (but higher quality).
No Clean Break + Hold
Script waits for a candle to break above/below ORB and close strong enough.
A wick poke doesn’t count.
VWAP / EMA Filter Not Aligned
If price breaks but VWAP/EMA trend filter disagrees → no signal.
Keeps you out of fake moves against the trend.
Confirmation Candle Missing (if enabled)
Even if price breaks, the script may want the next bar to confirm direction before signaling.
Cooldown / One-Signal-Per-Break Rule
Some filters prevent back-to-back spam signals.
Only the first clean setup is alerted.

Salim ALHammadi-Telegram @salimalhammadiAuto Trading its show entry price and tp price and sl i hope every one like it

Michael's EMA - 4h on 5mH4 Michael's EMA on all TF, You can use this indicator on all time frame and be able to see the H4 Bands, that help you with less layout and better view
GM
