Pairs Trading Scanner [BackQuant]Pairs Trading Scanner
What it is
This scanner analyzes the relationship between your chart symbol and a chosen pair symbol in real time. It builds a normalized “spread” between them, tracks how tightly they move together (correlation), converts the spread into a Z-Score (how far from typical it is), and then prints clear LONG / SHORT / EXIT prompts plus an at-a-glance dashboard with the numbers that matter.
Why pairs at all?
Markets co-move. When two assets are statistically related, their relationship (the spread) tends to oscillate around a mean.
Pairs trading doesn’t require calling overall market direction you trade the relative mispricing between two instruments.
This scanner gives you a robust, visual way to find those dislocations, size their significance, and structure the trade.
How it works (plain English)
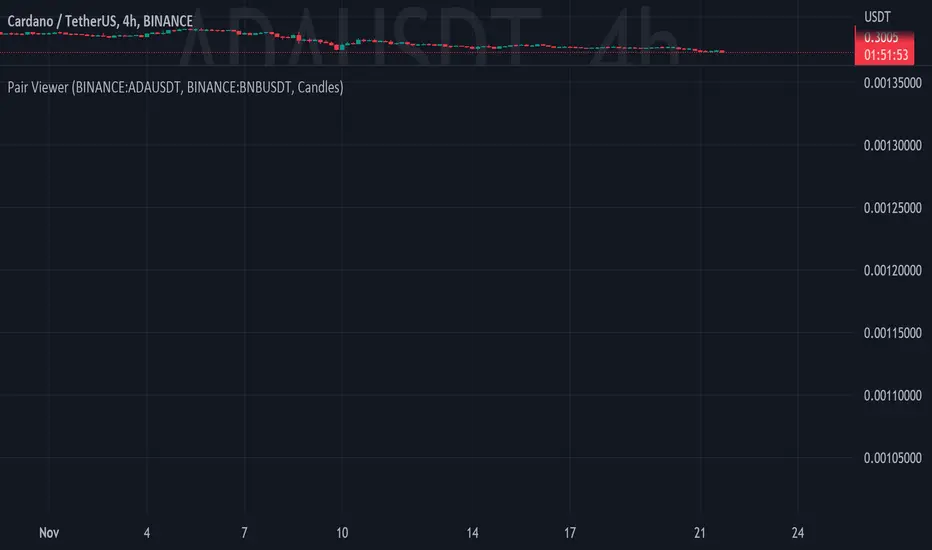
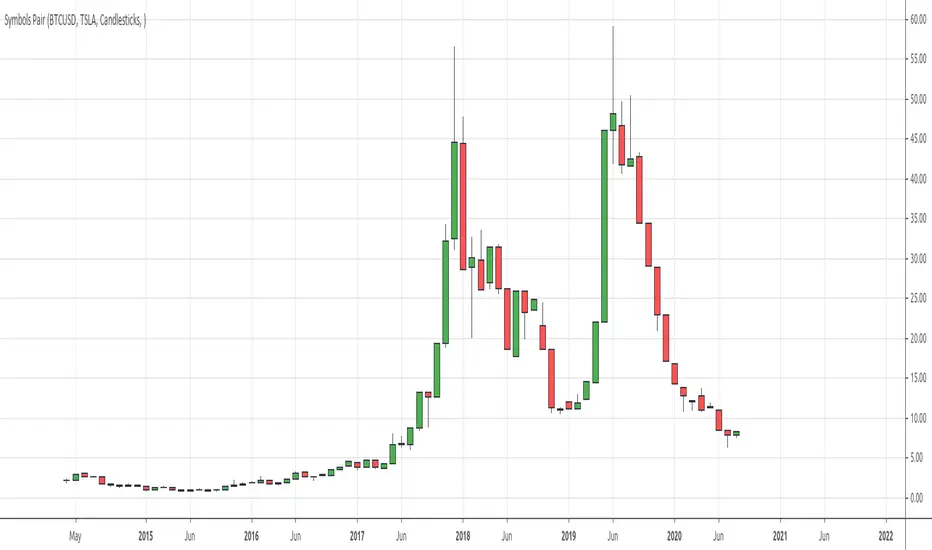
Step 1 Pick a partner: Select the Pair Symbol to compare against your chart symbol. The tool fetches synchronized prices for both.
Step 2 Build a spread: Choose a Spread Method that defines “relative value” (e.g., Log Spread, Price Ratio, Return Difference, Price Difference). Each lens highlights a different flavor of divergence.
Step 3 Validate relationship: A rolling Correlation checks if the pair is moving together enough to be tradable. If correlation is weak, the scanner stands down.
Step 4 Standardize & score: The spread is normalized (mean & variability over a lookback) to form a Z-Score . Large absolute Z means “stretched,” small means “near fair.”
Step 5 Signals: When the Z-Score crosses user-defined thresholds with sufficient correlation , entries print:
LONG = long chart symbol / short pair symbol,
SHORT = short chart symbol / long pair symbol,
EXIT = mean reversion into the exit zone or correlation failure.
Core concepts (the three pillars)
Spread Method Your definition of “distance” between the two series.
Guidance:
Log Spread: Focuses on proportional differences; robust when prices live on different scales.
Price Ratio: Classic relative value; good when you care about “X per Y.”
Return Difference: Emphasizes recent performance gaps; nimble for momentum-to-mean plays.
Price Difference: Straight subtraction; intuitive for similar-scale assets (e.g., two ETFs).
Correlation A rolling score of co-movement. The scanner requires it to be above your Min Correlation before acting, so you’re not trading random divergence.
Z-Score “How abnormal is today’s spread?” Positive = chart richer than pair; negative = cheaper. Thresholds define entries/exits with transparent, statistical context.
What you’ll see on the chart
Correlation plot (blue line) with a dashed Min Correlation guide. Above the line = green zone for signals; below = hands off.
Z-Score plot (white line) with colored, dashed Entry bands and dotted Exit bands. Zero line for mean.
Normalized spread (yellow) for a quick “shape read” of recent divergence swings.
Signal markers :
LONG (green label) when Z < –Entry and corr OK,
SHORT (red label) when Z > +Entry and corr OK,
EXIT (gray label) when Z returns inside the Exit band or correlation drops below the floor.
Background tint for active state (faint green for long-spread stance, faint red for short-spread stance).
The two built-in dashboards
Statistics Table (top-right)
Pair Symbol Your chosen partner.
Correlation Live value vs. your minimum.
Z-Score How stretched the spread is now.
Current / Pair Prices Real-time anchors.
Signal State NEUTRAL / LONG / SHORT.
Price Ratio Context for ratio-style setups.
Analysis Table (bottom-right)
Avg Correlation Typical co-movement level over your window.
Max |Z| The recent extremes of dislocation.
Spread Volatility How “lively” the spread has been.
Trade Signal A human-readable prompt (e.g., “LONG A / SHORT B” or “NO TRADE” / “LOW CORRELATION”).
Risk Level LOW / MEDIUM / HIGH based on current stretch (absolute Z).
Signals logic (plain English)
Entry (LONG): The spread is unusually negative (chart cheaper vs pair) and correlation is healthy. Expect mean reversion upward in the spread: long chart, short pair.
Entry (SHORT): The spread is unusually positive (chart richer vs pair) and correlation is healthy. Expect mean reversion downward in the spread: short chart, long pair.
Exit: The spread relaxes back toward normal (inside your exit band), or correlation deteriorates (relationship no longer trusted).
A quick, repeatable workflow
1) Choose your pair in context (same sector/theme or known macro link). Think: “Do these two plausibly co-move?”
2) Pick a spread lens that matches your narrative (ratio for relative value, returns for short-term performance gaps, etc.).
3) Confirm correlation is above your floor no corr, no trade.
4) Wait for a stretch (Z beyond Entry band) and a printed LONG / SHORT .
5) Manage to the mean (EXIT band) or correlation failure; let the scanners’ state/labels keep you honest.
Settings that matter (and why)
Spread Method Defines the “mispricing” you care about.
Correlation Period Longer = steadier regime read, shorter = snappier to regime change.
Z-Score Period The window that defines “normal” for the spread; it sets the yardstick.
Use Percentage Returns Normalizes series when using return-based logic; keep on for mixed-scale assets.
Entry / Exit Thresholds Set your stretch and your target reversion zone. Wider entries = rarer but stronger signals.
Minimum Correlation The gatekeeper. Raising it favors quality over quantity.
Choosing pairs (practical cheat sheet)
Same family: two index ETFs, two oil-linked names, two gold miners, two L1 tokens.
Hedge & proxy: stock vs. sector ETF, BTC vs. BTC index, WTI vs. energy ETF.
Cross-venue or cross-listing: instruments that are functionally the same exposure but price differently intraday.
Reading the cues like a pro
Divergence shape: The yellow normalized spread helps you see rhythm fast spike and snap-back versus slow grind.
Corr-first discipline: Don’t fight the “Min Correlation” line. Good pairs trading starts with a relationship you can trust.
Exit humility: When Z re-centers, let the EXIT do its job. The edge is the journey to the mean, not overstaying it.
Frequently asked (quick answers)
“Long/Short means what exactly?”
LONG = long the chart symbol and short the pair symbol.
SHORT = short the chart symbol and long the pair symbol.
“Do I need same price scales?” No. The spread methods normalize in different ways; choose the one that fits your use case (log/ratio are great for mixed scales).
“What if correlation falls mid-trade?” The scanner will neutralize the state and print EXIT . Relationship first; trade second.
Field notes & patterns
Snap-back days: After a one-sided session, return-difference spreads often flag cleaner intraday mean reversions.
Macro rotations: Ratio spreads shine during sector re-weights (e.g., value vs. growth ETFs); look for steady corr + elevated |Z|.
Event bleed-through: If one symbol reacts to news and its partner lags, Z often flags a high-quality, short-horizon re-centering.
Display controls at a glance
Show Statistics Table Live state & key numbers, top-right.
Show Analysis Table Context/risk read, bottom-right.
Show Correlation / Spread / Z-Score Toggle the sub-charts you want visible.
Show Entry/Exit Signals Turn markers on/off as needed.
Coloring Adjust Long/Short/Neutral and correlation line colors to match your theme.
Alerts (ready to route to your workflow)
Pairs Long Entry Z falls through the long threshold with correlation above minimum.
Pairs Short Entry Z rises through the short threshold with correlation above minimum.
Pairs Trade Exit Z returns to neutral or the relationship fails your correlation floor.
Correlation Breakdown Rolling correlation crosses your minimum; relationship caution.
Final notes
The scanner is designed to keep you systematic: require relationship (correlation), quantify dislocation (Z-Score), act when stretched, stand down when it normalizes or the relationship degrades. It’s a full, visual loop for relative-value trading that stays out of your way when it should and gets loud only when the numbers line up.
Pine Script® インジケーター