Percent


Gain LossA very simple yet, very useful and lovely oscillator, most of the time, when we have a position in a trend and we want to take a look at percentage of our gain or loss, we need to use the "Price Range" tool time and time again, this, in some trades that you would buy and sell in less than an hour, can become a problem, also, if you have few different things going on in the chart, the price range tool will only add more to it.
Using this little oscillator, you can put the price of your position in the input section and close the settings window and watch your gain or loss percentage in real time.

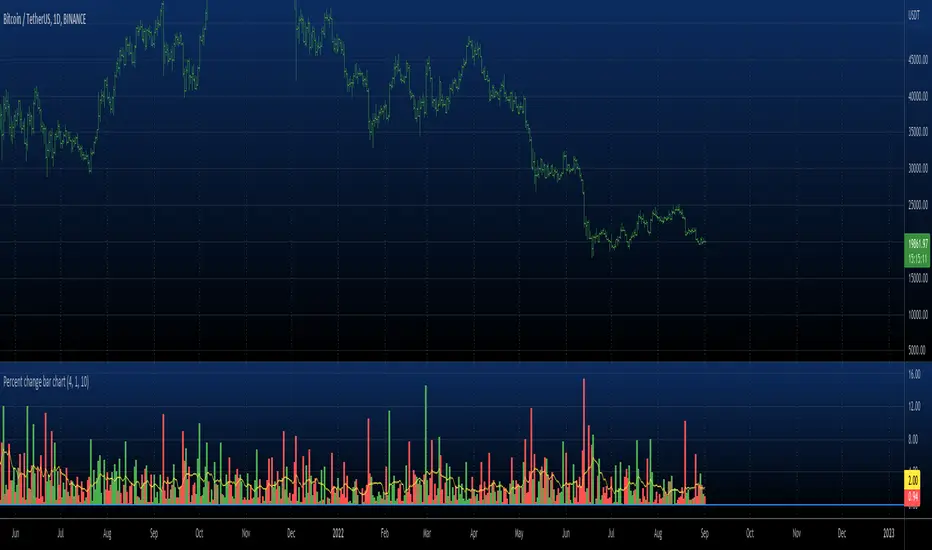
Percent change bar chart v 3.0 This histogram displays price or % change from previous bar.
Can be applied to any time frame.
06/01/2017
Added look back bars.
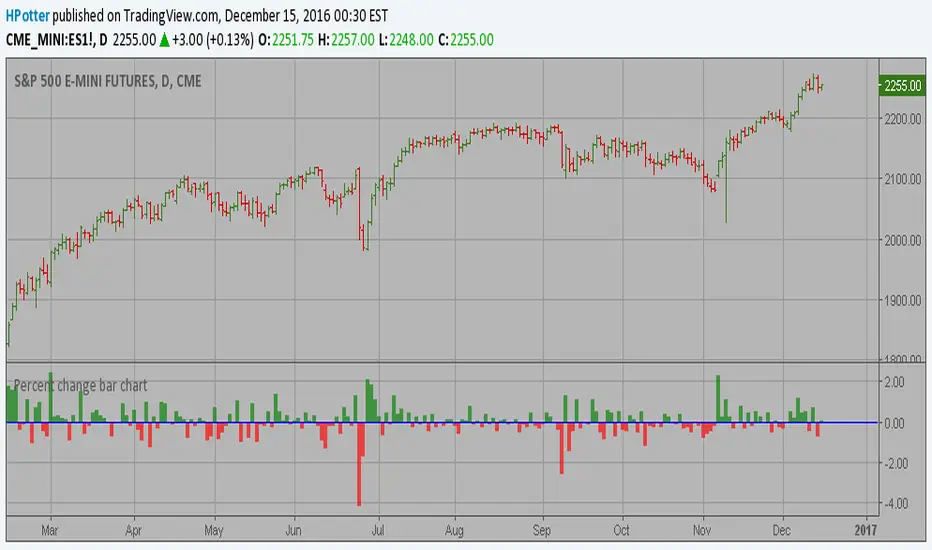
Percent change bar chart v 2.0 This histogram displays price or % change from previous bar.
Can be applied to any time frame.
15/12/2016 Update:
Number of digits after the floating point for study values on the axis now two.
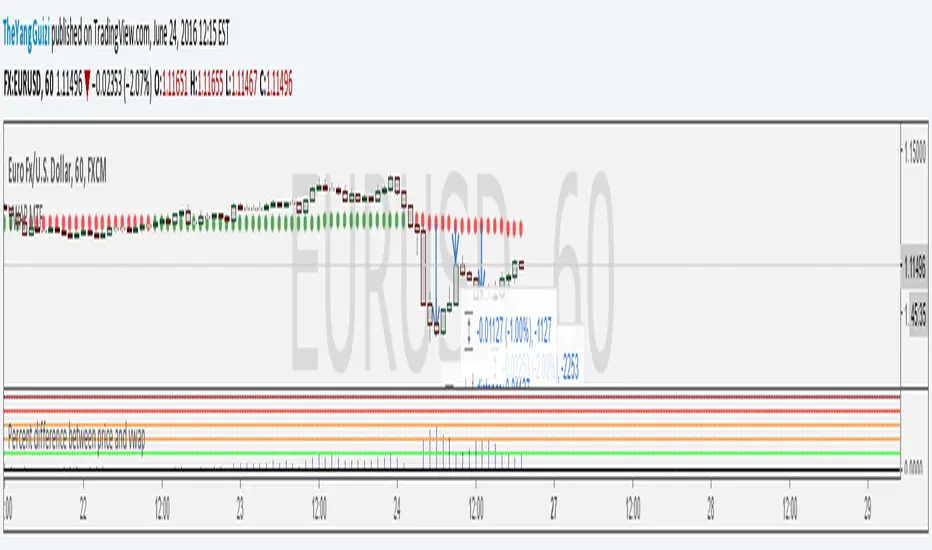
Difference % between PRICE and VWAP V2Shows difference between price and daily/weekly/monthly/hourly/whatever VWAP.
In v2:
option to color bars
average percentual difference of custom period
histogram changes color depending on which levels it's at
Levels/period/color etc can be customized.
Use these inputs in the timeframe box:
M - month
W - week
D - day
2D (or 3W or 2M or whatever) = 2 Days (or three week or 2 months and so on)
60= 1 H
240= 4 H
5 = 5 min
and so on.
btw, vaguely remembering reading somewhere that the big players like to make their entry at 4% difference.

Percent Difference Between VWAP and Price MTFShows the difference between vwap and price in percent.
You can can choose between multiple timeframe vwap. Default is normal daily.
The levels on the indicator can be changed to whatever you want to.
In the chart above we can see eurusd reverting up at 3% below monthly vwap, after the brexit dip, It then turns down again at 1% from monthly and lastly it turns up again at 2% from monthly.
Script is a small modification of this:
Williams %R I needed the %R code in one of my indicators and TradingVeiw have it hidden. So here is my attempt.

[RS]Timed Percentual Change V0EXPERIMENTAL: time based percentual change.
note: each series uses it self as base reference so there's a bit a divergence.

CM ATR PercentileRankCM ATR PercentileRank - Great For Showing Market Bottoms.
When Increased Volatility to the Downside Reaches Extreme Levels it’s Usually a Sign of a Market Bottom.
This Indicator Takes the ATR and uses a different LookBack Period to calculate the Percentile Rank of ATR Which is a Great Way To Calculate Volatility
Be Careful Of Using w/ Market Tops. Not As Reliable.
***Ability to Control ATR Period and set PercentileRank to Different Lookback Period
***Ability to Plot Histogram Just Showing Percentiles or Histogram Based on Up/Down Close
Fuchsia Lines = Greater Than 90th Percentile of Volatility based on ATR and LookBack Period.
Red Lines = Warning — 80-90th Percentile
Orange Lines = 70-80th Percentile
Other Useful Indicators
Williams Vix Fix
CM_RSI EMA Is a Great Filter for Williams Vix Fix

CM Percent Move Upper V1CM Percent Move Upper V1 .... Goes With the Lower Indicator
Created by ChrisMoody on 9/3/2014 by Request from vlad.adrian
**Plots A BackGround Highlight if % Move is Greater or Equal to User Input
** % Move is based on Close of Current Bar Compared to Close of Previous Bar

CM Percent Move Lower V1CM Percent Move Lower V1
Created by ChrisMoody on 9/3/2014 by Request from vlad.adrian
**Plots the percent move based on the Close of Bar Compared to the Close of Previous Bar
**If Bar closes Up then Histogram is Green, If Bar Closes Down Histogram is Red.
**Ability to Show/Hide Background Highlights, Horizontal Lines, % Histogram, and SMA of Percent Moves
