Stop loss and position size calculator (ATR)Calculates and plots Stop Loss and Position Size, based on desired ATR factor.
Displays Stop Loss Price, SL Distance Percent and Position Size overlayed in the chart and plots a stop loss line.
Additionally Stop Loss, ATR, SL Distance and Position Size are also displayed in the Data Window.
Available settings:
Trade - long / short
ATR timeframe - Allows to use ATR based on different timeframe than the current chart.
ATR factor - Stop Loss will be calculated by multiplying ATR with this factor.
Show last - Amount of previous stop loss lines to plot
Line Offset - Positions previous sl calculation under/above current price.
Calculation Offset - Displays calculation based on price action of previous bar(s).
Label Display Distance - Defines position of label relative to current bar.
Risk - Amount you are going to risk if stop loss is hit.
Positionsizing

Forex Risk CalculatorForex Risk Calculator 's logical is bring the differential between Entry price and Stoploss price, your acceptable risk and your account size to calculate the loss size first then convert to the 'Lot size' and have another feature like auto scale static target calculate by your loss size with RRR (Risk Reward Ratio). Give you to get easier to manage your orders.
Key Features:
📈 Real-time Risk Assessment: Enter the amount you are willing to risk, and Forex Risk Calculator will calculate the appropriate position size for your trade in real-time.
🎯 Target Lines and Static Target Prices based on RRR: Set your desired Risk-Reward Ratio (RRR), and let Forex Risk Calculator auto-generate target prices according to your RRR. Additionally, place target lines to visualize the expected profit if the price hits that line.
⚙️ Customizable Parameters: Adjust risk percentage, RRR, and other parameters to tailor the tool to your trading strategy.
👁️ User-Friendly Interface: Forex Risk Calculator features an easy-to-use and intuitive interface for both beginners and seasoned traders.
Usage:
Step 1: Place your entry price
Step 2: Place your stoploss price
Step 3: Place your target price
Step 4: Confirm your account detail
Step 5: Bring the 'Lot size' to use
Parameter:
Initial account size
Risk percent
Entry price
Stop price
Target price
Show your target price
Show static target prices
Number of your static target prices
Table position
Text size
Background color
Text color
Border color
Output:
Chart
Entry price line
Stop loss price line (loss in USD)
Target price line (profit in USD)
Table
Account size
Risk percent
Entry price
Stoploss price
Lot size
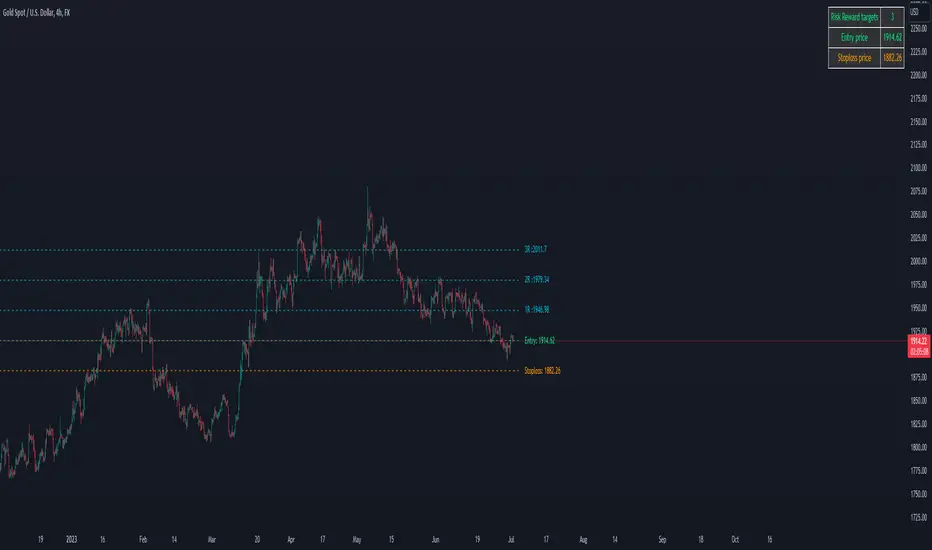
Crypto Risk CalculatorCrypto Risk Calculator 's logical is bring the differential between Entry price and Stoploss price, your acceptable risk and your account size to calculate the loss size first then convert to the 'Amount coins' and have another feature like auto scale static target calculate by your loss size with RRR (Risk Reward Ratio). Give you to get easier to manage your orders. *** Create to use for Cryptocurrencies Future market ***
Key Features:
📈 Real-time Risk Assessment: Enter the amount you are willing to risk, and Crypto Risk Calculator will calculate the appropriate position size for your futures trade in real-time.
🎯 Target Lines and Static Target Prices based on RRR: Set your desired Risk-Reward Ratio (RRR), and let Crypto Risk Calculator auto-generate target prices according to your RRR. Additionally, place target lines to visualize the expected profit if the price hits that line.
⚙️ Customizable Parameters: Adjust risk percentage, RRR, and other parameters to tailor the tool to your trading strategy.
👁️ User-Friendly Interface: Crypto Risk Calculator features an easy-to-use and intuitive interface for both beginners and seasoned traders.
Usage:
Step 1: Place your entry price
Step 2: Place your stop loss price
Step 3: Place your target price
Step 4: Confirm your account detail
Step 5: Bring the 'Amount coins' to use
Parameter:
Initial account size
Risk percent
Leverage
Entry price
Stop price
Target price
Show your target price
Show static target prices
Number of your static target prices
Table position
Text size
Background color
Text color
Border color
Data output:
Chart
Entry price line
Stop loss price line (loss in base unit currency)
Target price line (profit in base unit currency)
Table
Account size
Risk percent
Leverage
Margin
Entry price
Stoploss price
Amounts coin

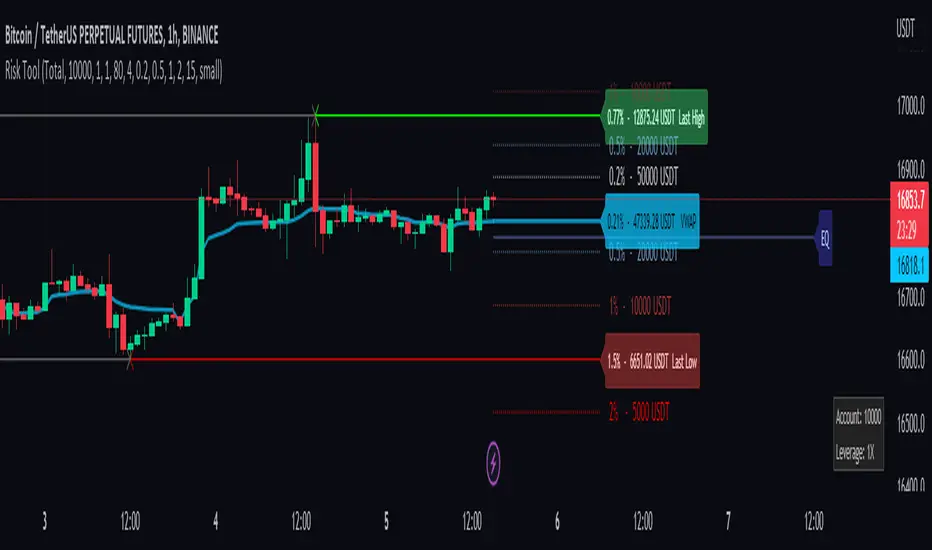
Risk Management ToolThis tool is a good way to get quick position sizing. No need to use your calculator and find that your price asset is already out of your range.
It works best with Cryptocurrencies Exchange way to manage position size calculation.
Really useful when scalping. This tool tracks the last high and low following your custom lookback bars number. It also follows the VWAP level.
You also have 4 custom ranges around the current price with the calculated position size. You set the desired percentage distance from the current price and you get the position size you need.
1. You choose the type of order
2. Account balance
3. Leverage if you use the cost base orders type
4. Amount to risk
and you get real-time risk management.
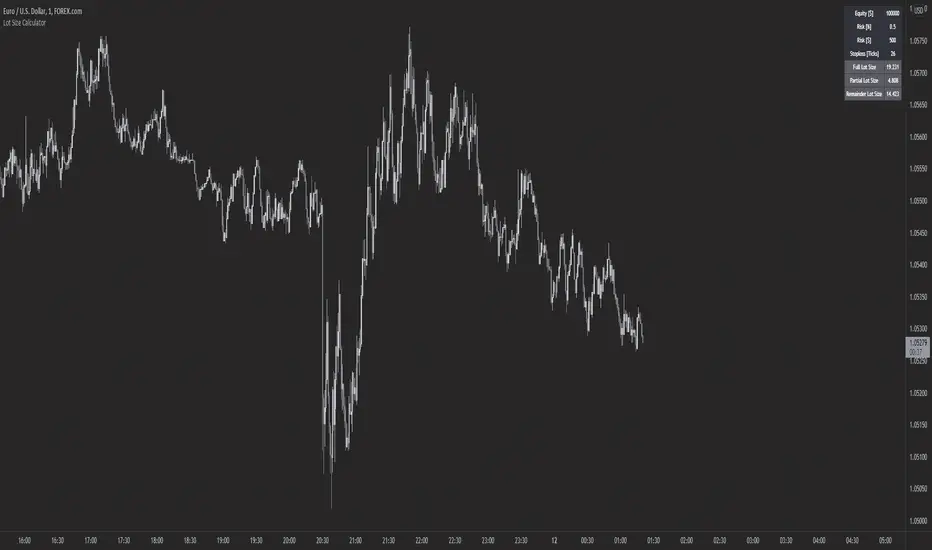
Crypto and FX PSCA simple tool to calculate crypto position size and FX lot size.
How to use:
1. Use TradingView measurement tool or position tool to know how wide is your stop loss.
2. Set the equity and risk parameters.
2. For crypto, input the PERCENTAGE in stop loss;
For FX, input the PIPS.
3. Position size will be displayed in the panel.
Notes:
>Position size is in USDT for Cryptocurrencies
>Lot size for forex.
Forex contract size is your account type set by the broker:
Standard = 100,000 units = ~$10/pip
Mini = 10,000 units = ~$1/pip
Micro = 1,000 units = ~$0.10/pip
Nano = 100 units = ~$0. 01/pip
Credits:
trananhvu149
hanabil

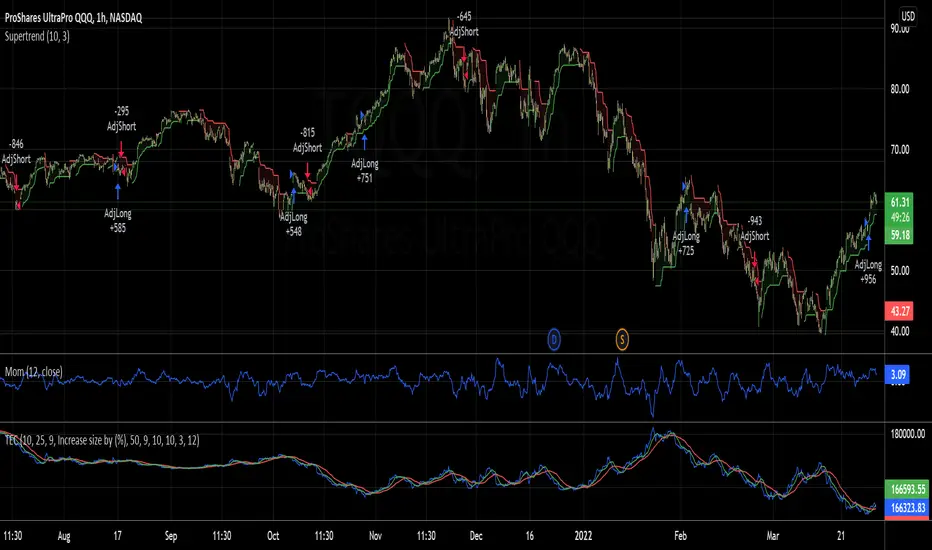
SuperTrend Entry(My goal creating this indicator) : Provide a way to enter the market systematically, automatically create Stop Loss Levels and Take Profit Levels, and provide the position size of each entry based on a fix Percentage of the traders account.
The Underlying Concept :
What is Momentum?
The Momentum shown is derived from a Mathematical Formula, SUPERTREND. When price closes above Supertrend Its bullish Momentum when its below Supertrend its Bearish Momentum. This indicator scans for candle closes on the current chart and when there is a shift in momentum (price closes below or above SUPERTREND) it notifies the trader with a Bar Color change.
Technical Inputs
- If you want to optimize the rate of signals to better fit your trading plan you would change the Factor input and ATR Length input. Increase factor and ATR Length to decrease the frequency of signals and decrease the Factor and ATR Length to increase the frequency of signals.
Quick TIP! : You can Sync all VFX SuperTrend Indicators together! All VFX SuperTrend indicators display unique information but its all derived from that same Momentum Formula. Keep the Factor input and ATR Length the same on other VFX SuperTrend indicators to have them operating on the same data.
Display Inputs
- The indicator has a candle overlay option you can toggle ON or OFF. If toggled ON the candles color will represent the momentum of your current chart ( bullish or bearish Momentum)
your able to change the colors that represent bullish or bearish to your preference
- You can toggle on which shows the exact candle momentum switched sides
your able to change the colors that represent a bullish switch or bearish switch to your preference
- The trader can specify which point you would like your stop loss to reference. (Low and High) Which uses the Low of the Momentum signal as the reference for your Stop Loss during buy signals and the High as the reference during sell signals. Or (Lowest Close and Highest Close) which uses the Lowest Close of the Momentum signal as the reference for your Stop Loss during buys and the Highest Close as the reference during sells.
- The colors that represent your Stop Loses and Take Profits can also be changed
Risk Management Inputs
- Your Risk MANAGMENT section is used to set up how your Stop Loss and Take Profit are calculated
- You have the option to take in account Volatility when calculating your Stop Loss. A adjusted ATR formula is used to achieve this. Increase Stop Loss Multiplier from 0 to widen stops.
- Increase Take Profit Multiplier from 0 to access visual Take Profit Levels based on your Stop Loss. This will be important for traders that Prefer trading using risk rewards. For Example: If the the Take Profit Multiplier is 3 a Take Profit level 3 times the size or your stop loss from your entry will be shown and a price number corresponding to that Take Profit Level becomes available.
- Enter your current Account size, Bet Percentage and Fixed Spread to get your Position Size for each trade
-Toggle on the Current Trade Chart and easily get the size of your Position and the exact price of your Take Profit and Stop Loss.
You can increase the Size of the Current Trade Chart= Tiny, Small, Normal, Large, Huge and change the Position of the Current
trade Chart to your preference, (Top- Right, Center, Left) (Middle- Right, Center, Left) (Bottom- Right, Center, Left).
How it can be used ?
- Enter Trades and always know where your stop is going to be
- Eliminate the need to manual calculate Position Size
- Get a consistent view of the current charts momentum
- Systematical enter trades
- Reduce information overload

Forex Lot Size Calculator [AKCHOOO]Forex Lot Size Calculator based off stop loss (ticks), also shows the lot size needed for taking partials (based of % of trade to close partial position).
credits
inspired by @DewMic
adapted from @hanabil
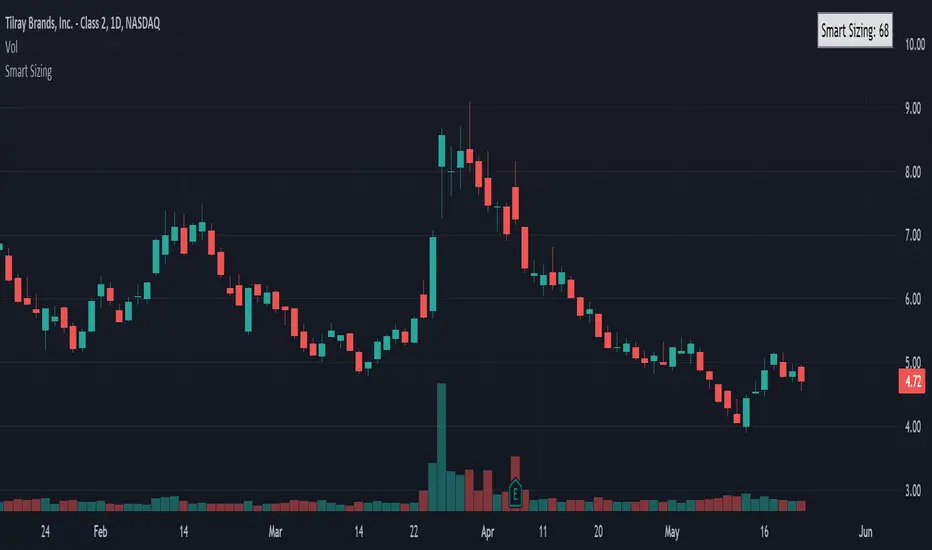
Smart SizingSmart Sizing is a simple indicator designed for stock traders to quickly see how many shares you should ideally trade to have an equal amount of risk on all of your trades. It uses your inputted values along with the ATR to determine the right amount of shares you should trade. Since every stock has a different level of volatility just simply buying 100 shares for every trade for example or an equal $ amount like $10,000 will leave your portfolio with concentrated risk in some stocks. If the more volatile stocks turn out to be losers then the wins from the less volatile stocks may not cover the losses, however if your positions were sized according to the volatility of each stock it may have resulted in being profitable overall instead.
That's what the Smart Sizing indicator does, it tells you directly on the chart in a small table and right next to the indicator a value that is how many shares to trade according to your account value and risk objectives. You simply enter in your account value in the indicator settings (I update mine everyday), what % of your account you want to risk, and what ATR Length and Timeframe you wish to use. For example, if you entered your account value at $10,000 with risk percentage at 1% and if you used the daily ATR which was 0.50 then it would show as 200 shares (10,000 x 0.01) / 0.50 = 200 and by trading 200 shares that means if the stock went against you by 1 daily ATR it would equal 1% of your account. So if you used a ATR trailing stop or a fixed stop based on the ATR this indicator can help you determine what your correct position size should be so you can practice good risk management.
Take the example below of two stocks with an almost identical price, Citigroup $C with a last traded price of $50.03 and Exelon $EXC with a last traded price of $50.02, you can see the Smart Sizing indicator is showing to trade 59 shares on Citigroup and 130 shares on Exelon, even though both stocks have almost the same stock price the different recommended position size is because Citigroup is much more volatile than Exelon which is a electric utility.
Please note this indicator is designed for stocks but could also be used for forex but shouldn't be used for futures. It can be used on any timeframe with stocks worldwide.
Jared.
Disclaimer: All my scripts and content are for educational purposes only. I'm not a financial advisor and do not give personal finance advice. Past performance is no guarantee of future performance. Please trade at your own risk.
Trading the Equity Curve Position Sizing Example"Trading the equity curve" as a risk management method is the process of acting on trade signals depending on whether a system’s performance is indicating the strategy is in a profitable or losing phase.
The point of managing equity curve is to minimize risk in trading when the equity curve is in a downtrend. This strategy has two modes to determine the equity curve downtrend: By creating two simple moving averages of a portfolio's equity curve - a short-term and a longer-term one - and acting on their crossings. If the fast SMA is below the slow SMA, equity downtrend is detected (smafastequity < smaslowequity).
The second method is by using the crossings of equity itself with the longer-period SMA (equity < smasloweequity).
When Trading with the Equity Curve" is active, the position size will be reduced by a specified percentage if the equity is "under water" according to a selected rule. If you're a risk seeker, select "Increase size by %" - for some robust systems, it could help overcome their small drawdowns quicker.
Position & Lot Size CalculatorBuilt with love "Position & Lot Size Calculator"
This indiator will help you to calculate your position size for managing the risk
Features :
1. Click-able Price Entry & SL (Easier Interface)
How to use it :
1. After add the indicator, set the Entry & SL Price with click price line in the chart
2. Set the risk and another parameter
Regards,
Hanabil

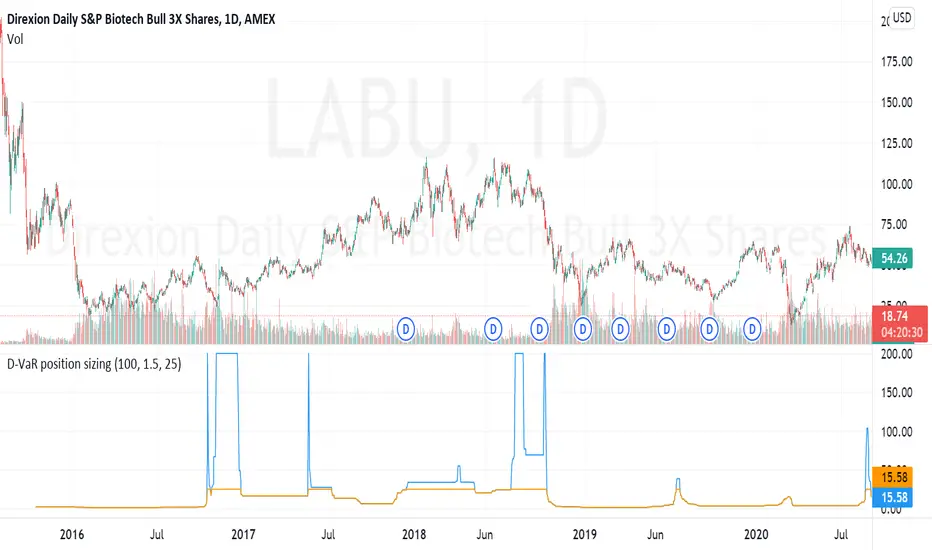
D-VaR position sizingThe D-VaR position sizing method was created by David Varadi. It's based on the concept of Value at Risk (VaR) - a widely used measure of the risk of loss in a portfolio based on the statistical analysis of historical price trends and volatilities. You can set the Percent Risk between 1 (lower) and 1.5 (higher); as well as, cap the % of Equity used in the position. The indicator plots the % of equity recommended based on the parameters you set.
ATR Position Size AutomationAll you have to fill out is your account balance, the % amount of your account you want to risk, and the percentage of ATR you want calculated. If you have 100% it will do a full ATR calculation. So if the ATR is $2 then your risk per share would be $2. If you had 50% in the same example it would be risking $1 per share.
You can also customize what time frame you want the ATR to be calculating off of. Just be aware the calculation will only be right if you are showing a lower time frame on your chart then the one selected on the indicator. (If you are calculating a daily dont be on a weekly chart. You have to be on a Daily or lower)
You can select what boxes you want displayed and if you want the ATR lines on the chart.

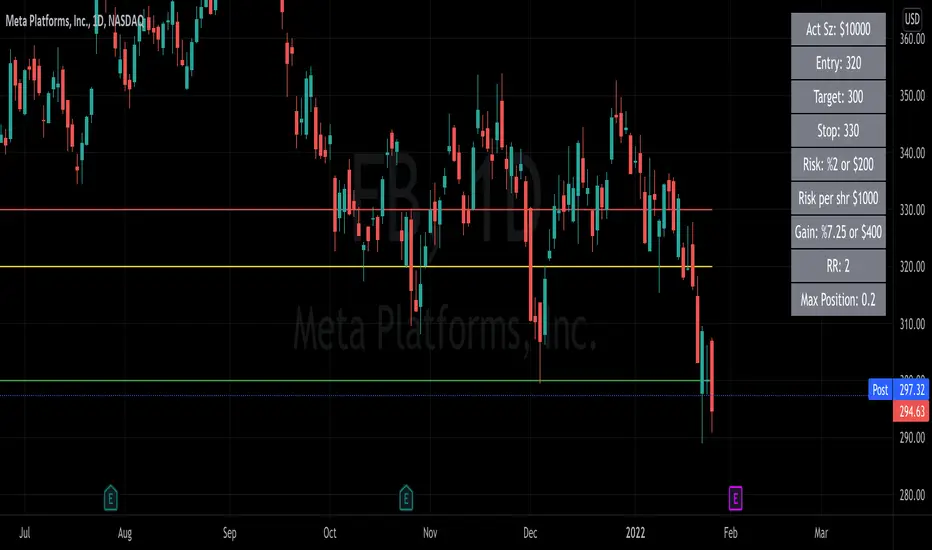
Risk Reward Position Size CalculatorThis can be used for Stocks or Options
This is a position size calculator. You must enter your Account size, Risk %, Entry, Stop, and Target. Then it will calculate your Max Position size, Risk Reward, Dollar gain and more.
It is completely customizable so you can change what you want the table to be showing.
It also can plot your entry, stop and target that you enter into the settings.
Trade Manager Pro - Quick Position Sizing This script allows the user to select directly on the chart the entry time/candle for a trade, its entry price, stop loss price and take profit price, and will quickly calculate the position size for the trade.
Some of the parameters that can be established by the trader in the indicator settings include the following:
-Account Size
-Leverage Multiple
-Risk % per trade
-% Trading Fee
A table with the outputs will be shown to the right of the chart, showing the following information:
-Margin used for the trade
-Leverage
-Total position size (Margin*Leverage)
-Position Type (Long or Short)
-Trading Fee $
-Stop Loss %
-Stop Loss $
-Take Profit %
-Take Profit $
-Risk/Reward Ratio
Note on its usage: When changing timeframes or tickers its better to exit the indicator and add it again to the chart, since TV doesnt reset its input functions when changing these.
Happy trading!!

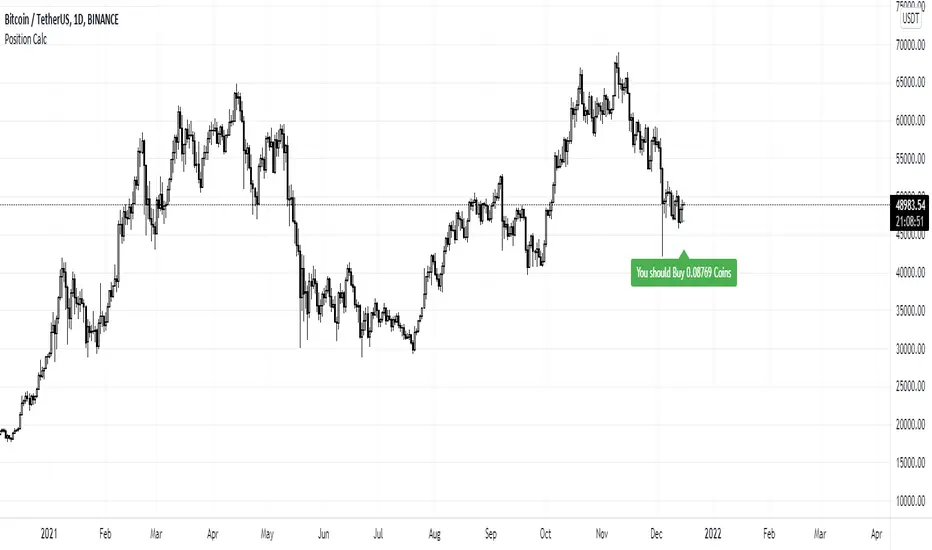
Position Sizing CalculatorThis is the Position Sizing Calculator indicator.
.
It's calculated by using the capital and risk that you can take per trade divided by the difference price between the current price and lowest close bar in 12 days.
.
The output is the number of coins that you should buy.
.
You should turn on this indicator only when the buy signal of another indicator is triggered.
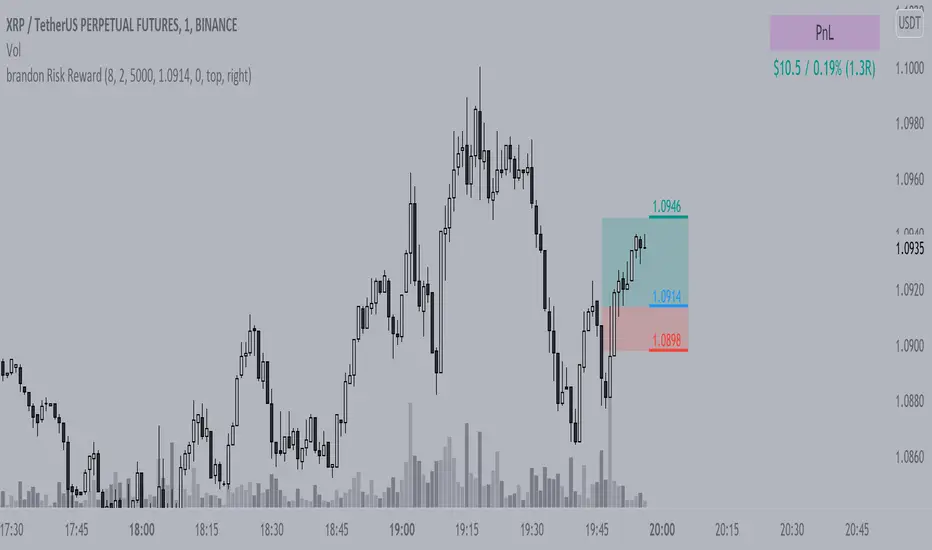
Brandon Risk RewardIndicator to track a position and its PnL, defined risk and reward given by share size and average price
Jerry Romine Momentum Dream With Risk ManagementThe Momentum Dream Indicator with Risk Management is really two powerful indicators combined in one.
The Momentum Dream Indicator is a volatility and momentum indicator that measures the relationship between the Bollinger Bands and Keltner Channels to help identify consolidations and signal potential breakouts.
MOMENTUM DREAM INDICATOR:
SIGNALS AND ZONES:
Green Arrow = Post Squeeze Buy Triggered = GREEN ⇧ shows squeeze out on upward momentum (often a good time to buy)
Orange Arrow = Post Squeeze Sell Alert = ORANGE ⇩ shows squeeze out on downward momentum (often a good time to sell or NOT buy)
Green Dot on Chart - Day one of the buy zone
Green Shading - Buy Zone
Pink Dot on Chart - Day one of warning zone
Red Shading - Warning zone. Often a good time not to buy or to consider selling.
LABELS (Color Indicates Direction):
Momo Up / Down = Current momentum direction.
Squeeze = Squeeze is on and squeeze line dots are red.
Dots = number of day or bars the squeeze has been in red(on)
Squeeze Fired = Green or Orange arrow shows squeeze fired direction.
Stacked = Fibonacci 8, 21, 34, 55, 89 EMA are stacked up or down
SQUEEZE LINE COLOR DEFINITIONS:
Dark Red = Extra Squeeze (In & Out)
Red = Original Squeeze (In & Out)
Pink = Pre-Squeeze (In)
Yellow = Pre-Squeeze (Out)
Green = Bollinger Bands are officially outside of Keltner Channels
STRATEGY
There are multiple ways the Momentum Dream Indicator can be used.
1. Buy/Sell during the squeeze (generally lower volatility and lower option premiums)
2. Buy/Sell when the squeeze fires to catch the breakout (volume/volatility often increase)
3. Use Buy/Sell Zones with other signals for entering positions
4. Use Momentum to assist with position direction
5. Use fading momentum to tighten stops or close positions.
* The labels only show when certain criteria are met. For example if a squeeze fired the label only shows on that day but the indicator arrow will always show. For this reason the labels on the chart above will vary from day to day and only alert you when needed. :)
RISK MANAGEMENT INDICATOR
Risk management is a vital part of investing and this indicator provides 2 recommended positions sizes. One based on the classic 1-2% risk rule where you never risk more than X% of your account. A second based on position size not exceeding X% of your account.
The Risk Management Indicator does all of the hard math and provides you with a realistic trading plan, position size, and trail stop based on your customizable criteria. If you’ve ever wondered how much of a stock to buy, when to sell and when to take profits this indicator is for you!
Please Use the link below for more information or to purchase.

The Chartless TraderThe Chartless Trader
The chartless trader is a trade management system designed to remove the randomness from the market. It is loosely based on the martingales betting system, but takes advantage of position sizing, minimum profit targets, dollar cost averaging, and trailing take profit.
The chart can be traded with or without a signal. There is a built in signal based on SB Master Chart's Buy the Dip algorithm.
The configurable settings include:
Account Value
Starting Account Value - This is the value of the account when you start using this system.
Current Cash - This is the amount of cash you have available to trade. This setting needs to be updated each time a trade is made.
TP/TTP Algo Settings
Take Profit % - This setting is otherwise known as minimum profit target. This algo will not advise you to sell or increase your trailing stop until this minimum profit target is met.
Trailing Stop % - This is the trailing stop. The default setting is 75%. As a basic example, if the stock is up 10%, the trailing stop would be set to 7.5% (10% * 75%). The algo may override and advise an alternative trailing stop should an overbought condition be detected.
DCA/BTD Algo
DCA/BTD Algo Time Frame - Default is 120 (2hrs). This algo looks for oversold periods on the 2h chart by default.
DCA % - The default for this setting is 5%. This is a trigger for the BTD Algo. The BTD algo will start looking for trades when the stock is 5% below your cost basis. This is to help you average down making it easier to turn a profit when the stock starts making gains.
Position #
The Chartless Trader supports a maximum of 20 symbols. This is a limitation of the security() function as a maximum of 40 calls are allowed and the script calls the security() function twice per symbol.
S# QTY - The number of open positions of the symbol. This has to be manually updated by the user after each buy/sell of the stock.
S# CB - This is the cost basis of the stock. Your broker should give you this after each buy/sell and it has to be updated here on the chart after each buy/sell.
S# TTP - The script will advise you to increase your Trailing Take Profit in your broker when its necessary. This should be updated manually after you update your order in your broker. This should be configured manually in your broker as a Stop Order.
Now that I have covered the configurable options, its important to understand the basis of this system. The martingales betting system is a system that seeks to double its position size each time you enter a losing trade. Eventually when you make a winning trade, it will be enough to cover the previous losses and net you one winning position.
Bet 1, lose 1, down 1.
Bet 2, lose 2, down 3.
Bet 4, lose 4, down 7.
Bet 8, lost 8, down 15.
Bet 16, win 16, up 1.
So the theory goes, if you have deep enough pockets, its a 100% win rate. Such a system is flawed and proven to cause an account to blow up given enough time. You can search Google/YouTube for others that have back tested the martingales system with stocks.
I advise that "The Chartless Trading" system be traded with a similar system, but instead of doubling your position, you simply increase your position size by 1%.
Bet 1%, lose 1%, down 1%
Bet 1%, lose 1%, down 2%
Bet 1%, lose 1%, down 3%.
In such a manner, your risk of ruin is significantly reduced. Lets say you lose 10 times in a row betting on a stock. You now have 10% of your account value in this particular stock. Because you only invested at times where you were more than 5% down and when an oversold position occurred, because of dollar cost averaging and buying during oversold periods, you may only be down 2-3% on your invested value. Eventually when the stock turns positive, you will have met your minimum profit target and the script will alert you to set a trailing stop. You log into your broker, set a stop loss and wait for it to either trigger or inform you to increase it again. Once the trailing stop is triggered, you deleverage the position by closing it and starting a single new position in either the same stock or a different one and the cycle repeats.
The key is to follow the stock down, follow it back up, and not back down. We repeat this cycle with many positions in many stocks to minimize risk and compound our balance sheet.
This is " The Chartless Trader ".
1920x1080p Monitor Required if using all 20 symbols.
The more symbols loaded, the longer the initial processing to load the table. Please be patient.

MM ATR Risk CalculatorBased on the NNFX Lot size position calculations MoneyMovesInvestments would like to provide to you the Free MM Atr Risk calculator
Directions are simple
Tells you the Atr value
Stop loss in pips
You can enter your account size
Based on your account size, enter the percent you want to risk
then the calculator will tell you your stop loss in pips based on current market and your lot size based on the account size and percent you want to risk
Check us out for your other trading needs
Link below or PM us for access to our other indicators
Happy Trading

Forex Position Size CalculatorPosition size calculator for FOREX only!
Lotsize is calculated by using properties described below.
Properties:
- Show position size: Will only be visible on 5m - 15m - 60m chart
- Account Currency:
- Account Size: Between 0 and 10 000 000 units of currency
- Risk: Between 0 and 100%
- Stoploss: Between 0 and 200 pips
- Textcolor

Position Sizing w/ ADR&ATR TrackingScript to use for position sizing based on portfolio size, max position, and max loss inputs. The option to use custom entry and stop are available, but default to last price for entry, and Low of Day (LoD) for stop. The ATR % is a measure of the low of day to current price as a percentage move.
Credit to LonesomeTheBlue for the base code on position sizing and TheScrutiniser/GlinckEastwoot for ADR formula
-Nelgoth, best of luck

Position Sizing Calculator for StocksThis position sizing calculator uses moving averages to calculate position size.
Here's what you can do:
Set the moving average value
Calculate the moving average as simple or exponential
Set your risk % per trade
Set your account value
Use a custom stop instead of the moving average value
You can also set the maximum % of capital to risk per trade.
The number of shares and percentage of account value will display as a label above the last bar price. It will work on multiple timeframes, but you will need to adjust the moving average length based on your current chart settings. Position sizing and risk management are important aspects of trading which should not be overlooked.
An example of setting your risk % per trade:
The current default is .50% which means that a $100,000 portfolio is willing to lose $500 per trade. The same account using a 1% risk model would be willing lose $1,000.
An example of how position size is calculated:
Portfolio Value=$100,000 Risk %= .50 Entry =$50 Moving Avg Value=$45 Amount I'm willing to lose is $100,000 x.50%=$500 so $500/(50-45) is equal to 100 shares. 100 shares x 50=$5000 or 5% of my total portfolio value.
Best of luck!

Risk Management: Position Size & Risk RewardHere is a Risk Management Indicator that calculates stop loss and position sizing based on the volatility of the stock. Most traders use a basic 1 or 2% Risk Rule, where they will not risk more than 1 or 2% of their capital on any one trade. I went further and applied four levels of risk: 0.25%, 0.50%, 1% and 2%. How you apply these different levels of risk is what makes this indicator extremely useful. Here are some common ways to apply this script:
• If the stock is extremely volatile and has a better than 50% chance of hitting the stop loss, then risk only 0.25% of your capital on that trade.
• If a stock has low volatility and has less than 20% change of hitting the stop loss, then risk 2% of your capital on that trade.
• Risking anywhere between 0.25% and 2% is purely based on your intuition and assessment of the market.
• If you are on a losing streak and you want to cut back on your position sizing, then lowering the Risk % can help you weather the storm.
• If you are on a winning streak and your entries are experiencing a higher level of success, then gradually increase the Risk % to reap bigger profits.
• If you want to trade outside the noise of the market or take on more noise/risk, you can adjust the ATR Factor.
• … and whatever else you can imagine using it to benefit your trading.
The position size is calculated using the Capital and Risk % fields, which is the percentage of your total trading capital (a.k.a net liquidity or Capital at Risk). If you instead want to calculate the position size based on a specific amount of money, then enter the amount in the Custom Risk Amt input box. Any amount greater than 0 in the Custom Risk Amt field will override the values in the Capital and Risk % fields.
The stop loss is calculated by using the ATR. The default setting is the 14 RMA, but you can change the length and smoothing of the true range moving average to your liking. Selecting a different length and smoothing affects the stop loss and position size, so choose these values very carefully.
The ATR Factor is a multiplier of the ATR. The ATR Factor can be used to adjust the stop loss and move it outside of the market noise. For the more volatile stock, increase the factor to lower the stop loss and reduce the chance of getting stopped out. For stocks with less volatility , you can lower the factor to raise the stop loss and increase position size. Adjusting the ATR Factor can also be useful when you want the stop loss to be at or below key levels of support.
The Market Session is the hours the market is open. The Market Session only affects the Opening Range Breakout (ORB) option, so it’s important to change these values if you’re trading the ORB and you’re outside of Eastern Standard Time or you’re trading in a foreign exchange.
The ORB is a bonus to the script. When enabled, the indicator will only appear in the first green candle of the day (09:30:00 or 09:30 AM EST or the start time specified in Market Session). When using the ORB, the stop loss is based on the spread of the first candle at the Open. The spread is the difference between the High and Low of the green candle. On 1-day or higher timeframes, the indicator will be the spread of the last (or current) candle.
The output of the indicator is a label overlaying the chart:
1. ATR (14 RMA x2) – This indicated that the stop loss is determined by the ATR. The x2 is the ATR Factor. If ORB is selected, then the first line will show SPREAD, instead of ATR.
2. Capital – This is your total capital or capital at risk.
3. Risk X% of Capital – The amount you’re risking on a % of the Capital. If a Custom Risk Amt is entered, then Risk Amount will be shown in place of Capital and Risk % of Capital.
4. Entry – The current price.
5. Stop Loss – The stop loss price.
6. -1R – The stop loss price and the amount that will be lost of the stop loss is hit.
7. – These are the target prices, or levels where you will want to take profit.
This script is primarily meant for people who are new to active trading and who are looking for a sound risk management strategy based on market volatility . This script can also be used by the more experienced trader who is using a similar system, but also wants to see it applied as an indicator on TradingView. I’m looking forward to maintaining this script and making it better in future revisions. If you want to include or change anything you believe will be a good change or feature, then please contact me in TradingView.
