Quintalytics BullBear Thrusters 19NDICATOR DESCRIPTION
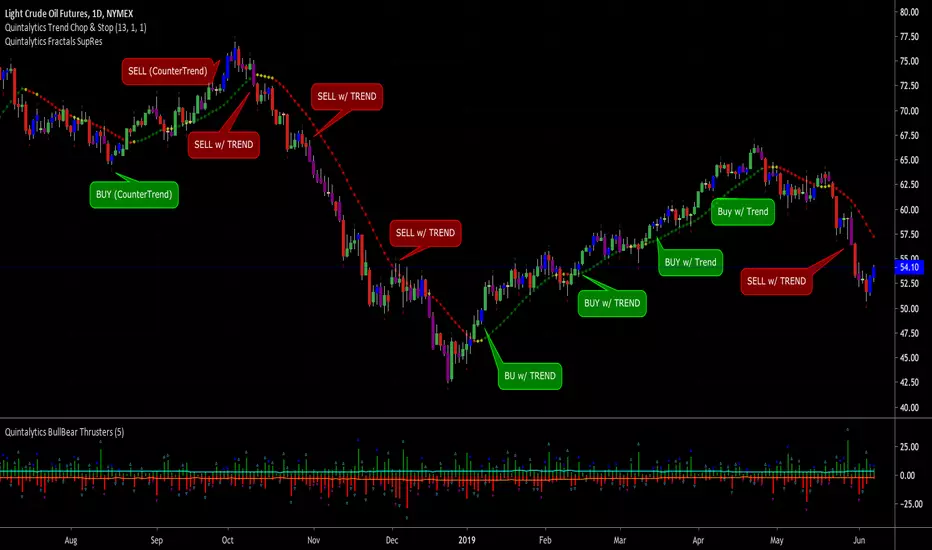
The “Quintalytics BullBear Thruster” indicator visualizes the balance of Buying and Selling pressure of the market for any given timeframe. It can be utilized as a Trade position setup/confirmation and Trade position exit/confirmation indicator. This indicator is suitable for use in all timeframes, markets, and chart types such as Bars, Candlesticks , Heiken Ashi, and Range.
BullBear Thrusters is presented on the chart as a Histogram (values above and below ZERO) along with a Bullish and Bearish Threshold line. A signal (Up and Down Arrows) is indicated via a Histogram plotted above or below the Threshold lines. The color of these arrows is determined by an algorithm based off of Buying and Selling Volume .
BUYING and SELLING PRESSURE Indications
The combination of the color and location of the Histogram and Threshold lines can provide information on the direction and strength of a trend, as well as whether Buyers or Sellers are affecting price movement.
The Color GREEN indicates the presence of a Buying Pressure.
The Color RED indicates the presence of a Selling Pressure.
The Color BLUE indicates Pricing Action is more influenced by BUYERS
The Color MAGENTA indicates Price Action is more influenced by SELLERS
TRADE POSITION SETUPS/CONFIRMATIONS
The presence of a BLUE/MAGENTA Signal Arrow (and associated Barcolors) can be used as criteria for trade entry, exit, or take profit conditions. These should not be used as the sole method of trading, but rather in conjunction with other indicators and trading strategies, as well as Trailing Stop Loss indicators such as the Quintalytics “Trend, Stop, and Chop”
FOR LONG TRADE POSITION ENTRY CRITERIA OPTIONS:
• A BLUE Arrow/Bar in the presence of an established LONG Trend (Trend)
• A BLUE Arrow/Bar which CLOSE ABOVE a level of Resistance (Breakout)
• A BLUE Arrow/Bar the occurs 1-3 bars after a MAGENTA Arrow/Bar (Countertrend)
FOR SHORT TRADE POSITION ENTRY CRITERIA OPTIONS:
• A MAGENTA Arrow/Bar in the presence of an established SHORT Trend (Trend)
• A MAGENTA Arrow/Bar which CLOSE BELOW a level of Support (Breakout)
• A MAGENTA Arrow/Bar the occurs 1-3 bars after a BLUE Arrow/Bar (Countertrend)
FOR LONG TRADE POSITION EXIT/TAKE PROFIT CRITERIA OPTIONS:
• A MAGENTA Arrow/Bar
FOR SHORT TRADE POSITION EXIT/TAKE PROFIT CRITERIA OPTIONS:
• A BLUE Arrow/Bar
SETTINGS
The indicator has TWO parameters: “Threshold”, and “Barcolor”.
Adjusting the “Threshold” will affect the indicator’s overall level of sensitivity. The HIGHER the Threshold, the larger the Price Action and Volume will be needed in order to generate a signal Arrow. Recommended settings are: 5, 8, 13, and 21.
Adjusting the “Barcolor” will Enable/Disable to changing of the Color of the Price Bar on the Main Chart.
Priceaction

Bearish&Bullish Engulfing (created by LucaBono)Questo indicatore (o price action pattern) stampa sul grafico delle frecce o barre colorate (modificabili dalle impostazioni) quando si verificano entrambi i segnali del Bearish e Bullish Engulfing ufficiali, ovvero quando il corpo della candela è più ampio dell'intera candela precedente.
Il segnale LONG si effettua quando il massimo della Bullish bar viene rotto dalla candela successiva.
Il segnale SHORT viceversa si effettua alla rottura del minimo.
E' più facile trovare questo tipo di segnali su timefrime giornaliero e mercati come azioni, futures e titoli che non stanno aperti 24h.
Consiglio sempre di accompagnare questi segnali ad altri tipi di segnali o analisi per maggiorare le probabilità di successo e di tenuta del trade.
This indicator (or price action pattern) prints on the graph arrows or colored bars (which can be changed from the settings) when both official Bearish and Bullish Engulfing signals occur, ie when the body of the candle is wider than the entire previous candle.
The LONG signal is made when the maximum of the Bullish bar is broken by the next candle.
The SHORT signal, on the other hand, is performed when the minimum is broken.
It is easier to find this type of signals on daily timefrime and markets like stocks, futures and stocks that are not open 24h.
I always advise to accompany these signals to other types of signals or analyzes to increase the chances of success and stability of the trade.

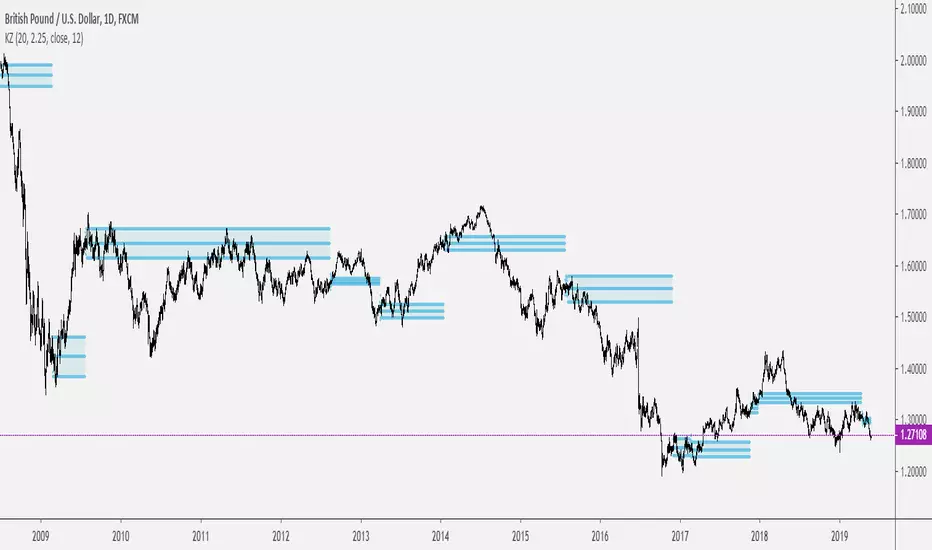
Keltner ZonesThis is an indicator that draws support and resistance zones / levels based on price action in and around Keltner Channels.
There are 3 different modes;
Draw zones based on price breaking the upper band
Draw zones based on price breaking the lower band
Draw zones if price stays within the bands for a prolonged period of time.
You can also decide if you want the indicator to paint zones or levels. The Zones can grow rather large if there is a volatility shock since they are drawn using the true range around the trigger price.
Upper Band Zones
Lower Band Zones
Congestion Zone
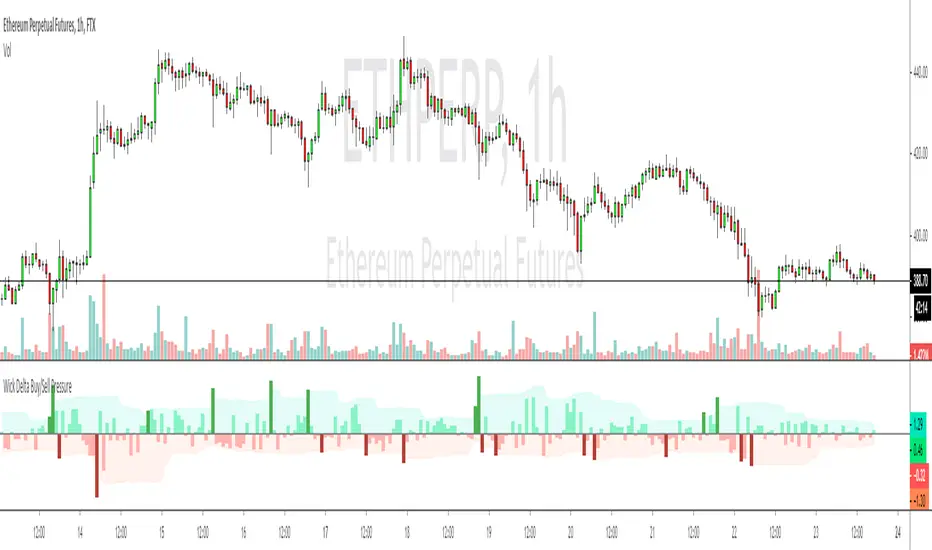
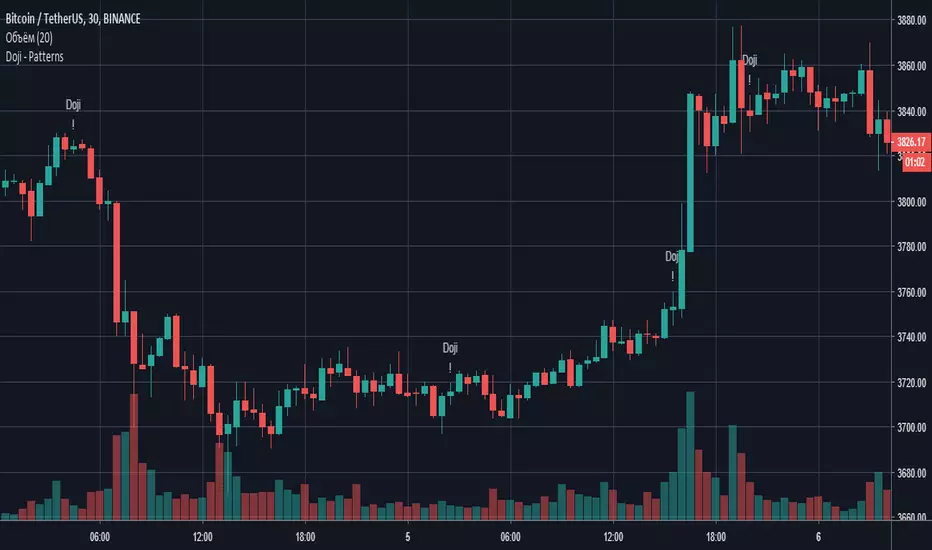
Wick Delta Buy/Sell PressureIf you think of a perfect doji candle, where the wicks on top and bottom are exactly the same, that's a candle with a delta of 0. What this indicator does is show the delta/difference between wicks, if the top wick is longer than the bottom wick it show's sell pressure/bear interest, which is displayed as a red bar and vice versa for buy/bull pressure, which is shown as green bars. I added arrows for clarity.
It's a different way of visualising wicks, which can clarify sentiment and be a useful way to understand wicks better in general. One way to use it is to look for clusters of 3/4 larger bars in a row, which generally helps to determine future direction especially when seen at important levels.
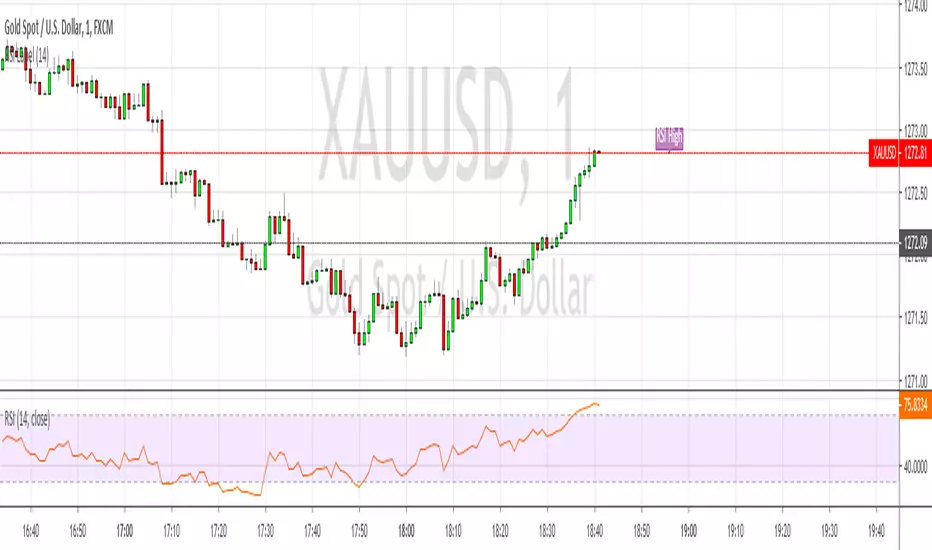
RSI LabelAdds a purple label to the right of price if RSI is overbought or oversold, otherwise it doesn't show anything at all, nada. Handy for people (like me) who often focus on price action and forget to watch the RSI
Naresh - iJPASIMPORTANT NOTE
This strategy has been developed as a professional service. It was published only or testing and verification by the customer. As such, access cannot be granted to anyone else. Sorry about that!
Other open source scripts are available on the BacktestRookies profile.
Intra-day Japanese Candlestick Price Action Strategy
An intraday strategy which focuses on analyzing price action of the opening 3 bars to make trading decisions.
Once certain criteria are met, entry and exit targets are set and left until they are hit else we reset and start again on a new day.


NinaThis is for education purpose.
Nina provides opportunity to detect various peculiarities and patterns in price dynamics which are invisible to the naked eye.
It can be simultaneously used with xSuperTrend indicator. When both gives same signal, opportunity may be taken.


PA Extremely Early version
Experimenting with traditional "market structure" and candlestick patterns for trend analysis

IO_Volatility Quality Zero LineThis is the Volatility Quality Zero Line Indicator. This indicator measures volatility strength.

AutoUFOs (patented)█ OVERVIEW:
AutoUFOs is a cutting-edge trading tool designed to enhance your trading precision and to save you trading time. With its unique patented technology, AutoUFOs analyzes various financial markets, identifying potential Un-Filled Orders (UFOs) and plotting them on your charts. By leveraging these UFOs, you can define precise entry, stop, and target points, giving you a strategic edge in your trading decisions.
█ CONCEPTS:
AutoUFOs identifies price regions with pending buy and sell orders
UFOs on the charts represent these regions and indicate potential upcoming turning points
UFOs help define more precise entry, stop, and target points
Enhances trading precision and improves performance
Useful for all styles: long-term, intermediate-term, short-term
Powerful for commercial hedging strategies
Time interval flexibility for different trading styles
Benefits options traders in identifying powerful strike prices
Empowers users to make informed trading decisions
█ WITH MORE DETAIL:
AutoUFOs goes beyond simple technical analysis and plots UFO Bands on your charts. These UFO Bands visually represent the price regions where potential buy and sell orders are waiting to be executed. The intensity of the color within the bands provides a valuable indication of the potential strength of the unfulfilled orders in those regions.
In addition to UFO Bands, AutoUFOs introduces round Flying Saucers to enhance your understanding of market dynamics. These Flying Saucers highlight the areas on the chart with the highest concentration of UFOs. By pinpointing these areas, you gain deeper insights into where the market is likely to react and experience significant movement.
The combination of UFO Bands and Flying Saucers provides a comprehensive visual representation of potential order flow and market sentiment. Traders can leverage this information to make more informed decisions about entry and exit points, allowing for greater precision in their trading strategies.
Whether you're a technical analyst seeking to identify price levels where the market is likely to bounce or a trend follower looking for confirmation of market momentum, AutoUFOs empowers you with detailed visuals to support your trading decisions.
█ BEHIND THE SCENES:
AutoUFOs employs a unique and patented approach to identifying Un-Filled Orders (UFOs) in the market. Unlike traditional methods that rely on current order book data, AutoUFOs takes into account the intricate nuances of market dynamics, considering the intentions and strategies of larger market players who employ sophisticated algorithms to execute their orders, such as iceberg algos. By doing so, AutoUFOs uncovers potential UFOs that are likely to remain in the market based on the underlying reasons behind their placement.
One key aspect of AutoUFOs' analysis is the recognition of price levels that hold significance due to the presence of UFOs. These levels represent areas where market makers, for instance, strategically hedge their positions in response to large orders that were only partially filled upon injection into the marketplace. AutoUFOs diligently identifies these signs, allowing traders to gain insights into the potential existence of unfulfilled orders that can significantly impact market behavior.
AutoUFOs operates on a distinctive methodology that sets it apart from traditional approaches. Notably, it eschews the use of order book information, relying solely on level 1 data for its analysis. This unconventional approach seeks out subtle indications that hint at the existence of Un-Filled Orders (UFOs). By examining these signs, AutoUFOs uncovers potential price levels where UFOs may be lurking.
Consider, for instance, a scenario where a market experiences a sudden and pronounced price movement. In such cases, AutoUFOs directs its attention to the origin of the movement, recognizing it as a crucial area to investigate. The underlying rationale is simple yet profound: if all orders had been filled at the origin, the price would have stagnated, resulting in a sideways price action. However, the occurrence of a significant movement suggests that the market encountered a scarcity of buyers (for a downward movement) or sellers (for an upward movement) at that specific price level. This scarcity implies the presence of Un-Filled Orders that remained unfilled from the outset. By diligently identifying such scenarios, AutoUFOs initiates additional analytical processes that consider factors such as volume ratios, tick ratios range ratios, etc., providing an evaluation of the expected quantity of potential UFOs.
This example illuminates the essence of the concept previously mentioned—AutoUFOs diligently "looks for signs" that point towards the potential existence of UFOs. By systematically examining various market dynamics, AutoUFOs unravels hidden opportunities that arise from unfulfilled orders, leveraging metrics like volume ratios and tick ratios to gauge the anticipated abundance of UFOs. Through this meticulous and sophisticated analysis, AutoUFOs empowers traders with invaluable insights into the market, enabling them to make more informed decisions based on these hidden signals.
Once this initial analysis is complete and multiple relevant price points are identified based on the UFOs detected, AutoUFOs delves further by employing its advanced technology to retrospectively evaluate the UFO Performance. This evaluation assesses the characteristics and attributes that contributed to the effectiveness of specific UFOs in the past. By unraveling these statistical insights, AutoUFOs identifies the most relevant UFOs that are likely to retain their predictive power into the future.
Through its scientific and technical methodology, AutoUFOs offers traders a powerful way to navigate the complexities of the market for informed decision-making.
█ FEATURES:
Precise Trade Entries: Utilize the power of UFOs to identify optimal moments/prices to enter trades with confidence
Strategic Exits: Plan your exits by leveraging the UFOs' reaction points, maximizing your profits and minimizing risk
Flexible Time Intervals: Apply AutoUFOs to different time intervals, from seconds to monthly bars, range bars, etc. tailoring it to your preferred trading style
Options Trading Advantage: For options traders, AutoUFOs helps identify price levels that are unlikely to be reached, allowing you to profit from selling out-of-the-money options and collecting premiums
█ HOW TO USE:
Follow the author’s instructions to request access to this invite-only script or follow the links in the vendor’s signature field that appears under this description
Add AutoUFOs to your TradingView chart by clicking on Indicators > Invite-only scripts > AutoUFOs
Select the market and timeframe you want to analyze and make sure you have adjusted the calibration settings to your liking
For long trades, you may consider buying within a Green UFO and sell within a Red UFO
For short trades, you may consider selling within a Red UFO and buy within a Green UFO
Options traders can utilize UFOs to identify areas for selling options with limited risk or to select their strike prices
Consider the color intensity of UFOs for potential trade strength
Enhance your current trading methodology by combining UFOs with what you currently do
Plan your trades based on the Un-Filled Orders identified by AutoUFOs and the rules of your trading plan
We strongly recommend you to read the HOW-TO idea on " HOW-TO Add Precision To Entries & Exits With AutoUFOs (patented) " which is linked below as a related idea
█ LIMITATIONS:
AutoUFOs should not be used as the sole basis for trading decisions
The tool is not infallible and should be used in conjunction with other market analysis tools, especially when it comes to defining the current market condition, for which we prefer AutoClimate
Thank you for considering AutoClimate as your ultimate market environment indicator. We hope it enhances your trading experience and leads to greater success in your trades
═════════════════════════════════════════════════════════════════════════
Disclaimer: Trading involves risk and each investor/trader must determine if it is a suitable investment. Past performance is not indicative of future results. You accept responsibility for your actions and agree not to hold the author/developer liable for any outcomes.
No Service Guarantee: The author/developer makes no guarantee that the TradingView indicators and services will be uninterrupted, timely, secure, accurate, or error-free. The market data may be delayed, inaccurate, or contain errors, and the developer is not liable for any issues that arise.
Calibration: The user is responsible for calibrating the indicator as different parameters can produce different results. The author/developer is not responsible for any outcomes resulting from the user's calibration.
Testimonials: Testimonials are subjective and not independently verified.

Doji - PatternsПаттерн "Доджи" - показывает равновесие сил продавцов и покупателей. Хотя сам по себе этот паттерн не является сигналом к открытию сделки, не стоит его всегда игнорировать. Доджи встречается в более сложных паттернах, состоящих из двух - трех свечей, например: "Утренняя звезда", "Вечерняя звезда" и "Крест харами" (подробнее о них я расскажу в своих следующих публикациях). Часто появление данного паттерна указывает на окончание трендового движения и/или начале "рэнджа".

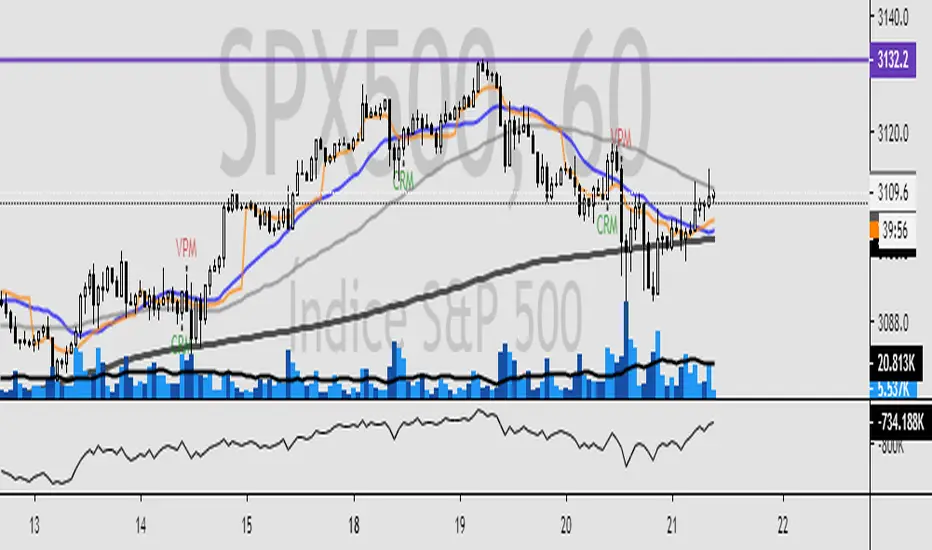
Trading Trend IndicatorEsse indicador plota na tela do ativo avaliado, pontos de compra e venda baseado em regras de tendência e confirmação por volume. Caso o ativo entre em tendência, o script plota na tela os dizeres "CPM" = Comprar na perda da máxima, ou seja comprar assim que o preço perder a máxima no próximo candle, e "VPM" = Vender na perda da mínima, assim que o preço perder a mínima no próximo candle. O indicador também avalia o volume, se o volume for 3x superior a média de 21 períodos, plota-se na tela "Vol. 3x" e se a barra de volume for 3x maior que a barra anterior, plota-se "3x" sobre o gráfico de volume.
Caso tenham interesse, solicitem o teste gratuito de 7 dias.
Description in english
This indicator plots on the screen of the evaluated asset, points of purchase and sale based on trend rules and confirmation by volume. If the asset is in trend, the script will display the words "CPM" = Buy at the loss of the maximum, ie to buy as soon as the price loses the maximum in the next candle, and "VPM" = Sell at the minimum loss, so that the price to lose the minimum in the next candle. The indicator also evaluates the volume, if the volume is 3x higher than the average of 21 periods, it is plotted in the "Vol 3x" screen and if the volume bar is 3x larger than the previous bar, it is plotted "3x" on the volume chart.
If you are interested, request a free 7-day trial.
Grimes Modified MACD Supply DemandA follower of mine asked me if I could make a version of my www.tradingview.com script using the MACD. Well it just so happens I was making a few modifications to my MACD script: just as this question came up so I went ahead and threw this together.
The MACD that triggers the SR zones is pictured below, with key trigger points encircled to illustrate how it works.
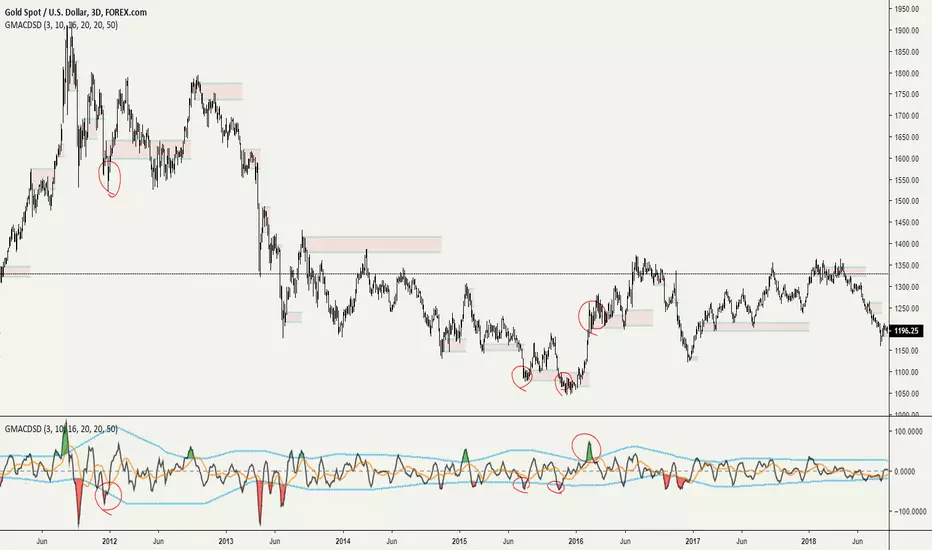
The Center..some measure of “center” or average price is useful.
- Adam H. Grimes
This line off Adams blog inspired me to cook up a very simple indicator that just takes the High and Low of the time given (input in minutes), adds them together and divides it in half. This way we get a center based on the higher timeframe. Not only does it inform you of the dominating trend, but also works as a sort of momentum indicator if you measure the distance price is from the center.
Got the daily high/low calculations off www.tradingview.com

Swing PointsThis indicator gives a clear indication of price action swing-points as well as an indication of whether it is a higher, lower, or equal swing point relative to the last high/low.

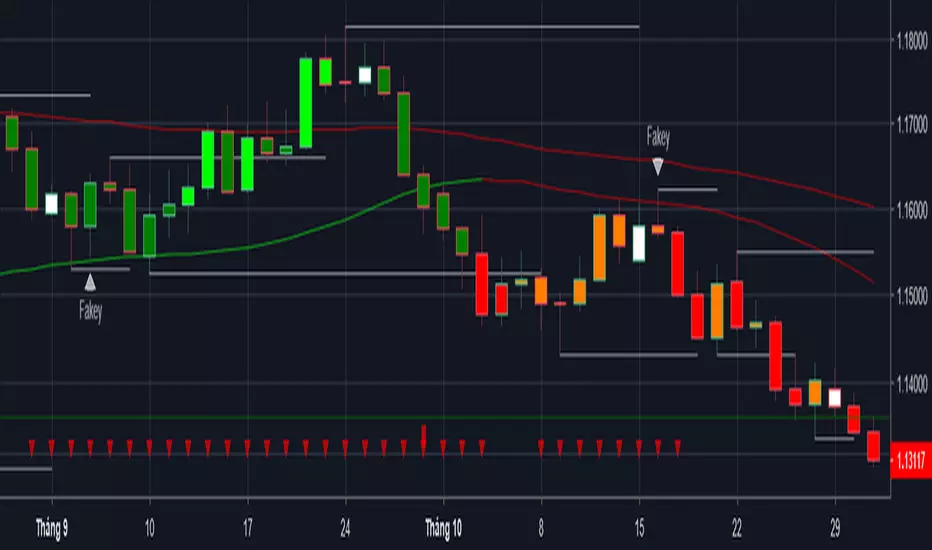
Price Action with MACD Barcolor + Insidebar + Fakey + Key level EMA 89 and Hull MA 89 used to filter trading signals and working as support and resistance.
When both of them are red, market is bearisk, only short.
When both of them are green, market is bullish, only long.
when there is 1 green and 1 red, market is neutral, can short or long.
Enjoy and happy trading!
You can follow me there: www.facebook.com you are welcom!
4Hours-optimized Crypto Alert ReloadedUPDATE:
*Added Pivot Levels for a better market lecture.
Advice, try to filter the early B signals by pivot strength.
Stay tunned!
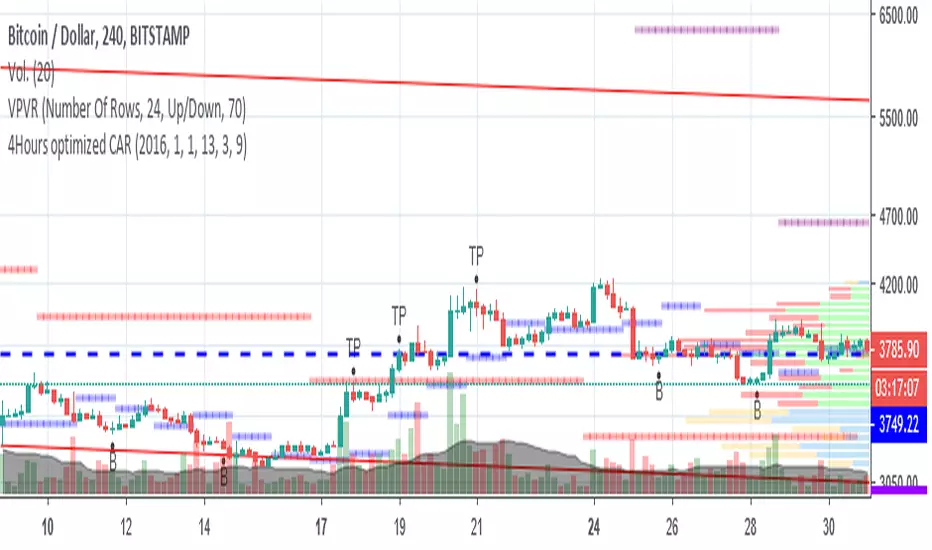
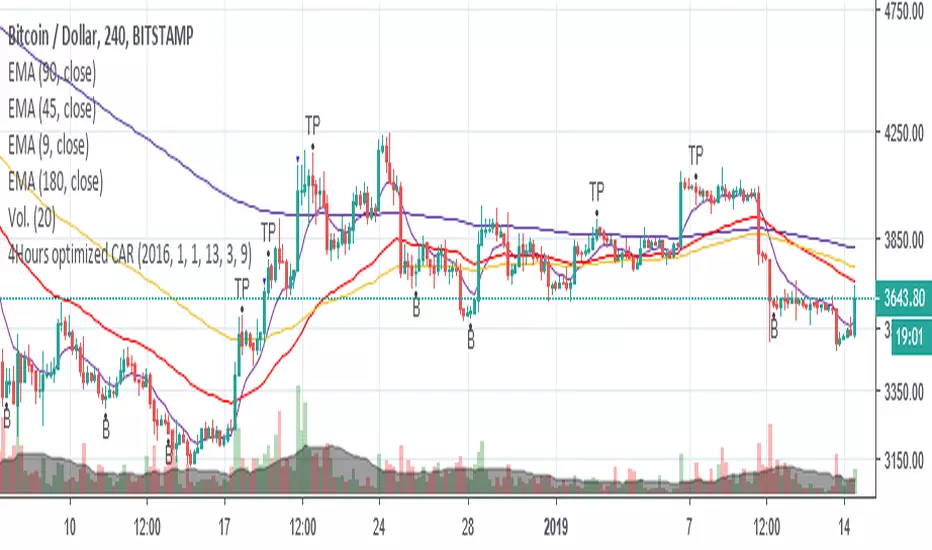
4Hours optimized CARHey!
I have been working on this script the lasts days, it's a collaboration with an uruguayan mate.
#####IMPORTANT#####
* It has been optimized for 4h charts, use it on other at your own risk.
* Always use Stop Loss, since it might give false signals after a long trend.
* I'm still working on it, I'm going to add candlestick pattern filtering.
Thanks for your support, greetings.
Congestion DetectorThis script detects price action congestion. These congestions are marked on chart itself.
