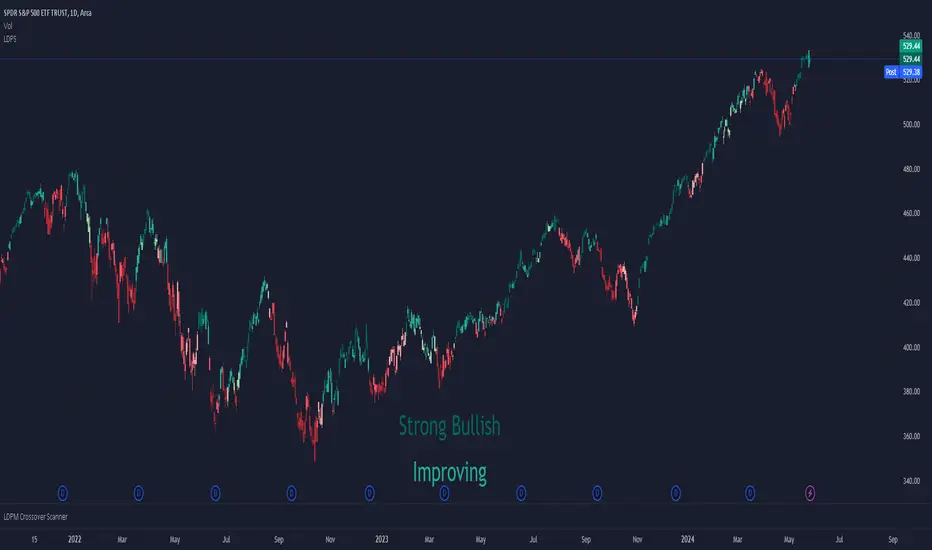
Liquidity Dependent Price Stability AlgorithmThe Liquidity Dependent Price Stability (LDPS) indicator is designed to measure liquidity levels on an equity and, from those measurements, provide Bullish or Bearish outlooks for future price action. These outlooks are given via reporting the equity's Liquidity Condition and Liquidity Flow.
Interpretation
Liquidity Condition (LC) and Liquidity Flow (LF) measurements are displayed with color-specific chart colors and/or with text output.
LC can be reported as "Weak Bullish", "Bullish", or "Strong Bullish" for Bullish outlooks and "Weak Bearish", "Bearish" or "Strong Bearish" for Bearish outlooks. LC can also just be reported as "Bullish" or "Bearish".
Bullish LCs have a statistical correlation with future price appreciation, and Bearish LCs have a statistical correlation with price depreciation. When LC is “Bullish”, the price is likely to go up, and if LC is “Bearish”, the price is likely to go down.
Liquidity Flow (LF) is a measure of how LC is changing. When LC is becoming more bullish, LF is reported as “Improving”. When LC is becoming more bearish, LF is reported as “Worsening”. LF is only displayed via text output.
Settings and Configurations
LDPS Sensitivity and Reactivity: Determines if you want LDPS to be more sensitive to changing conditions or less sensitive. This choice affects how certain LDPS is when forming its future outlooks. LDPS achieves this increase in sensitivity and reactivity by lowering the bar for what LDPS considers a significant change.
Aggressive : LDPS will optimize reporting early changes in LC and LF at the expensive of accuracy. Aggressive is good for low-risk trading styles that prefer to exit a position early rather than deal with increased risk of oppositional movement.
Balanced : LDPS will try to balance reporting changes in LC and LF with maintaining accuracy. Balanced style is a good setting to start out with and is applicable across the widest range of equity’s and timeframes.
Conservative : LDPS will optimize accuracy over being sensitive to changes in LC or LF. Conservative is a good choice for lower timeframes and traders who only want to change or exit positions with the greatest confidence.
LDPS Reporting Style: Determines how you want LC to be reported.
Simplified : LDPS will only report LC as “Bullish” or “Bearish”.
Full : LDPS will increase its reporting details and include the “Strong” and “Weak” pre-fixes, when appropriate.
LDPS Candle Coloring: There are three different ways that LC can be reported on the chart via coloring.
LDPS Candle Replacement: This will replace the chart’s default candles with those created by LDPS. Note: In order to see LDPS’ candles and not the chart’s, you have to disable to chart’s candles. This can be done in Settings -> Symbol and unchecking “Body”, “Borders” and “Wick” boxes.
LDPS Candle Coloring: This will just color the bodies of the chart’s default candles. Note: This setting should not have the chart’s candle’s disabled.
LDPS Background Coloring: This will color the chart’s background rather than any candles.
LDPS Text Output: LC and LF are reported via a text box that can be moved several places on the chart, or the text box can be removed.
LDPS Measurements – Display: When selected, LC and LF will be reported via the text box.
LDPS Measurement – Text Location: Determines where the text box with LC and LF are located.
LDPS Measurement – Text Size: Determines the size of LC and LF within the text box.
LDPS Measurement – Background Color: Determines the background color of the text box with LC and LF.
LDPS Condition Color Selection – Bullish / Bearish: Color selection for each type of LC. Note: If the Simplified reporting style is selected, the “Full Bullish” and “Full Bearish” are the bullish and bearish color choices, respectively.
Frequently Asked Questions:
Where can I get additional Information?
Please check the “Author’s Instructions” section below.
Where can I find the results of the LDPS research?
Please check the “Author’s Instructions” section below.
Help! Something’s not working!
Apologies. Please see the email listed in “Author’s Instructions” below and let’s get started on solving the issue.
Which Sensitivity setting should I use?
The author’s preference is Conservative in most cases, but the answer for you depends on your preferred style.
An analogy might help: the aggressive setting will ensure LDPS is early to the party – every party. Of the parties that really kick off, you can be certain LDPS is there, but they had to visit a several of parties before finding the right one.
The Conservative setting won’t bring LDPS to every party – it will gladly stay at the one it’s at but when it detects the next real big hit, LDPS will move to that party instead. It won’t be the first one there, but it is definitely earlier than most.
Should I use the Full or Simplified reporting style?
Depending on how engaged you are with the particular equity or position, either choice can be beneficial. The Full reporting style will let you detect changes in LC before they might show with the Simplified reporting style. Some enjoy the additional data, some (like the Author) enjoy keeping things simple.
I can see LDPS’ colors in the chart’s candlesticks when the settings are open, but not when the settings are closed. How come?
If you are using the “LDPS Candle Replacement” setting, be sure to turn off the Chart’s default candles by right-clicking on the chart, going to Settings, then Symbol and then un-checking “Body”, “Border” and “Wick”. This should fix the issue.
I think there’s a bug – where do I report it?
Thank you for reaching out about a potential bug or issue! Please see the email below in “Author’s Instructions” to report the issue.
Priceactionanalysis
Trend Bars Pro (HTF PO3)Hello Traders!
The innovative TRN Trend Bars Pro are designed to help traders to analyze markets in an intuitive way and provide high probability entry and exit signals. It combines three core concepts:
TRN Trend Bars to see the current trend and reversals (replaces the default chart bars)
Bar Ranges to highlight consolidations
Dynamic Trend to see the overall trend.
First, let's have a look at each of these concepts individually. Afterwards, we describe how a combination of all three gives you a crystal-clear picture of the market.
TRN Trend Bars Pro
They show bullish and bearish trends and reversals based on color coding the bars and give high probability trade opportunities with special colors. The trend analysis is based on a new algorithm that includes several different inputs:
classical and advanced bar patterns and their statistical frequency
probability distributions of price expansions after certain bar patterns
bar information such as wick length in %, overlapping of the previous bar in % and many more
historical trend and consolidation analysis
The algorithm weighs these concepts and outputs a color scheme for the chart bars or candlesticks.
Bar Types
Trend bars in green and red
Reversal Bars in blue and fuchsia
Continuation Bars in turquoise and orange
Breakout Bars in dark green and pink
Green Bars signify a sustained uptrend, indicating bullish market sentiment. On the other hand, Red Bars indicate a persistent downtrend, representing bearish market sentiment. The transition from red to green denotes a bullish trend reversal, suggesting a shift from bearish to bullish sentiment. Conversely, the shift from green to red signals a bearish trend reversal, indicating a transition from bullish to bearish sentiment. By monitoring these color changes, traders can identify potential trend reversals and make informed trading decisions.
The presence of gray and black bars indicates a neutral market state, often observed before an impending color change from red to green or green to red. These neutral bars serve as a transition phase between the previous trend and the potential reversal.
The TRN Trend Bars Pro incorporate signal bars, distinguished by their distinct colors, to offer potential buy and sell signals and deeper insights into market dynamics.
Reversal Bars
The presence of blue Reversal Bars indicates a trend reversal to the upside, while pink Reversal Bars indicate a reversal to the downside. These bars not only serve as signals for potential trend shifts but also present favorable opportunities to enter the market or increase one's position size.
Continuation Bars
In addition to the reversal bars, the indicator also includes bullish continuation bars (colored turquoise) and bearish continuation bars (colored orange). These bars act as signals for the continuation of an existing trend. Like the reversal bars, they can be utilized as entry points or opportunities to augment one's position size.
Breakout Bars
The dark green breakout bars within TRN Trend Bars Pro show a powerful breakout from a price range detected by our integrated bar range feature. They signify the continuation or potential change in a trend following a consolidation phase. As such, these bars hold dual functionality, serving as reversal signals and validating the persistence of an ongoing trend.
Bar Ranges
The bar range feature automatically finds consolidations where the price range of several consecutives bars is rather small. The detection of the bar ranges includes among other things the overlapping percentage of these bars.
How to Use Price Ranges
Here are a few ways you can use the bar ranges in your trading:
Identify Support and Resistance Levels
The price ranges can help you identify key support and resistance levels on a chart. By observing price ranges and identifying these levels, you can make more informed decisions about entering or exiting trades.
Breakout Trading
Price ranges can also provide insights into potential breakout opportunities. Breakouts occur when the price breaks out of a defined range, signaling a potential shift in market sentiment and the start of a new trend. The Color highlighted Breakout Bars from the TRN Trend Bars Pro are signaling a powerful breakout of a price range. Traders can enter positions in the direction of the breakout and set appropriate stop-loss orders to manage risk. Note that not every price range is left by a powerful breakout.
Dynamic Trend
The Dynamic Trend combines elements from standard trend strength indicators (e.g. DI-, DI+, Parabolic SAR) and volatility indicators (e.g. ATR, Standard Deviation). It produces a moving average line that adapts to changing market volatility. It is inspired by the ideas of the programmer and trader Fat Tails. The adaptive behavior provides more relevant information for traders when compared to traditional moving averages which do not consider volatility and trend strength together. This makes the Dynamic Trend completely unique, and no other moving average indicator can give you this precision.
How to use Dynamic Trend
Generally, a rising Dynamic Trend line, displayed in green, indicates that an uptrend is strong, while a falling Dynamic Trend, displayed in red, suggests that the downtrend is sharp. The Dynamic Trend turns gray when there is insufficient clarity to establish a distinct trend and especially when there is not volatility in the market.
Identify potential trade entries and exits: When used in conjunction with price action, the Dynamic Trend can provide potential trade signals. For example, if the price crosses above the Dynamic Trend, it may be a bullish sign, suggesting a potential buy entry. Conversely, if the price crosses below the Dynamic Trend, it may indicate bearish conditions and a potential sell signal.
Trend Identification and Pullback trading
Observe the Dynamic Trend's color. When it's on the rise and appears green, it indicates a bullish trend. Conversely, if it's in decline and displayed in red, it signals a bearish trend.
If Dynamic Trend is green and price pulls from above back to the Dynamic Trend, then this can be considered as a bullish signal.
If Dynamic Trend is red and price pulls from below back to the Dynamic Trend, then this can be considered as a bearish signal.
In the event of a bearish signal, such as a bearish TRN Signal Bar, and the Dynamic Trend is red, it provides additional confirmation to the bearish signal. Likewise, bullish signals gain added conviction when the Dynamic Trend is green.
Crossovers
As with other moving averages, crossovers between the Dynamic Trend and the price can be significant.
If price is crossing above the Dynamic Trend, then this can be considered as a bullish signal.
If price is crossing below the Dynamic Trend, then this can be considered as a bearish signal.
If you currently hold a position, both bullish and bearish crossovers can serve as potential exit signals. For instance, in the case of a long position, a bearish crossover can indicate a potential shift in sentiment, signaling a bearish reversal and a potential opportunity to close your long position.
Filtering Noise
Due to its adaptive nature, the Dynamic Trend can be a useful tool to filter out market noise. When the market is choppy or consolidating, the Dynamic Trend tends to remain flat and colored gray, signaling traders to potentially stay out of the market.
Stop Losses
The Dynamic Trend can also be used as a dynamic stop loss. For instance, in a long trade, traders can use the Dynamic Trend as a trailing stop, selling their position if the price crosses below the Dynamic Trend.
Combining TRN Trend Bars Pro, Bar Ranges and Dynamic Trend together
Combining all three concepts gives you a crystal-clear picture of the market. The Dynamic Trend shows you the overall trend. If price pulls back to the dynamic trend line and then price picks up the trend direction again, then the TRN Trend Bars Pro immediately switches the color to the trend direction. Therefore, you can easily identify high probability entry signals based on the bar color.
As a simple trading model, you can set the stop loss below the last swing or below a TRN signal bar (vice versa for short entries) and use 2.5 R or 3 R as target.
You can increase the success rate of the high probability TRN signal bars entries even more if they are in line with the Dynamic Trend line.
On the other hand, the TRN Bar Ranges help you to stay out of the market in case the price does not really change. As a confluence signal to stay flat in this period the dynamic trend line tends to be grey as well. If the price breaks out of the range, then the indicator prints a breakout bar which serves as a high probability entry signal.
Although it is possible to switch off any of these concepts, it is highly recommended to use all three in combination to get a crystal-clear picture of the market.
Alerts
Experience the power of our TRN Trend Bars Pro alerts, delivering real-time notifications for trend changes, price range breakouts, and signal bar formations or confirmations. Stay on top of the market with these versatile alerts, customizable to your preferred assets and timeframes.
Conclusion
While signals from TRN Trend Bars Pro can be informative, it is important to recognize that their reliability may vary. Various external factors can impact market prices, and it is essential to consider your risk tolerance and investment goals when executing trades.
Risk Disclaimer
The content, tools, scripts, articles, and educational resources offered by TRN Trading are intended solely for informational and educational purposes. Remember, past performance does not ensure future outcomes.

NZTInstitutionalLevelDESCRIPTION IN ENGLISH
🔶 INTRODUCTION
NZTInstitutionalLevel is an indicator for the TradingView platform designed to display institutional levels on a price chart. This script is based on the concept of calculating significant price levels that can be used for both long-term trading and intraday operations. The indicator calculates and visualizes the levels at which large market participants , such as institutional investors and large funds , can actively participate. The displayed levels are very important , as psychologically people tend to buy or sell at these levels, which makes them a reliable support in the analysis
🔶 CONTENT
The indicator uses the analysis of support and resistance levels , which are often tested by major market players . These levels represent prices that have historically experienced significant price movements due to large trading volumes, making them relevant for future trading decisions. You may notice that price often reverses or tests these round levels. These levels are a powerful pillar of price action analysis.
🔶 KEY FEATURES
The indicator displays institutional (bank) levels . Thanks to which you can easily determine the position of major players and the direction of their capital.
Visualization customization:
Users can customize the display of levels by selecting color, thickness and line style (solid, dotted, dashed).
Adaptability:
The script adapts the level step size depending on the current price of the asset and the selected time interval, which allows it to be used in various trading conditions and for assets with different volatility and price range.
Automatic scaling:
The number of displayed levels changes depending on the selected time interval, allowing traders to focus only on significant levels without overloading the chart with unnecessary information.
🔶 SETTINGS
🔹 Show Institutional Levels (Показывать институциональные уровни)
Allows you to disable or enable the display of institutional levels.
🔹 Level color (Цвет уровней)
Allows you to customize the color of the levels.
🔹 Level thickness (Толщина уровней)
Allows you to adjust the thickness of the levels.
🔹 Level style (Стиль уровней)
Allows you to customize the levels' style.
🔶 RECOMMENDATIONS FOR USE
To use the indicator, activate it on the desired price chart through the TradingView indicator menu. Once activated, adjust the visibility, color, style and thickness of the levels according to your preferences. The indicator will automatically calculate and display institutional levels based on the current asset price and configured parameters . These levels can serve as potential points for placing buy or sell orders, setting stop losses, or taking profits.
The indicator was developed by Temirlan Tolegenov for NZT Trader Community , May 2024, Prague, Czech Republic.
ОПИСАНИЕ НА РУССКОМ ЯЗЫКЕ
🔶 ВСТУПЛЕНИЕ
NZTInstitutionalLevel – это индикатор для платформы TradingView, предназначенный для отображения институциональных уровней на ценовом графике . Этот скрипт основан на концепции вычисления значимых ценовых уровней , которые могут быть использованы как для долгосрочной торговли, так и для интрадей-операций . Индикатор рассчитывает и визуализирует уровни , на которых могут активно участвовать крупные участники рынка , такие как институциональные инвесторы и большие фонды . Отображаемые уровни очень важны , так как психологически люди склонны покупать или продавать на этих уровнях , что делает их надежной опорой при анализе.
🔶 СОДЕРЖАНИЕ
Индикатор использует анализ уровней поддержки и сопротивления , которые часто тестируются крупными игроками рынка . Эти уровни представляют собой цены, на которых исторически происходили значительные движения цен за счет больших объемов торгов, что делает их релевантными для будущих торговых решений. Вы можете заметить, что цена часто разворачивается или тестирует эти круглые уровни. Эти уровни являются мощной основой анализа price action.
🔶 КЛЮЧЕВЫЕ ОСОБЕННОСТИ
Индикатор отображает институциональные (банковские/круглые) уровни. Благодаря чему вы легко сможете определить позиции крупных игроков и направление их капиталов.
Настройка визуализации:
Пользователи могут настроить отображение уровней, выбрав цвет, толщину и стиль линий (сплошные, пунктирные, точками).
Адаптивность:
Скрипт адаптирует размер шага уровня в зависимости от текущей цены актива и выбранного временного интервала, что позволяет использовать его в различных торговых условиях и для активов с разной волатильностью и ценовым диапазоном.
Автоматическое масштабирование:
Количество отображаемых уровней меняется в зависимости от выбранного временного интервала, позволяя трейдерам сосредоточиться только на значимых уровнях, не перегружая график лишней информацией.
🔶 НАСТРОЙКИ
🔹 Показывать институциональные уровни
Позволяет отключить или включить отображение институциональных уровней.
🔹 Цвет уровней
Позволяет настроить цвет уровней.
🔹 Толщина уровней
Позволяет регулировать толщину уровней.
🔹 Стиль уровней
Позволяет настроить стиль уровней.
🔶 РЕКОМЕНДАЦИИ К ИСПОЛЬЗОВАНИЮ
Для использования индикатора, активируйте его на желаемом ценовом графике через меню индикаторов TradingView. После активации, н астройте видимость, цвет, стиль и толщину уровней в соответствии с вашими предпочтениями. Индикатор автоматически рассчитает и отобразит институциональные уровни , основываясь на текущей цене актива и настроенных параметрах . Эти уровни могут служить потенциальными точками для размещения ордеров на покупку или продажу, установления стоп-лоссов или взятия прибыли.
Индикатор разработан Темирланом Толегеновым для международного сообщества NZT Trader , Май 2024, Прага, Чешская Республика.
The indicator is published in accordance and respect to all House Rules of the TradingView platform.
Индикатор опубликован в соответствии и уважением ко всем внутренним правилами платформы TradingView.

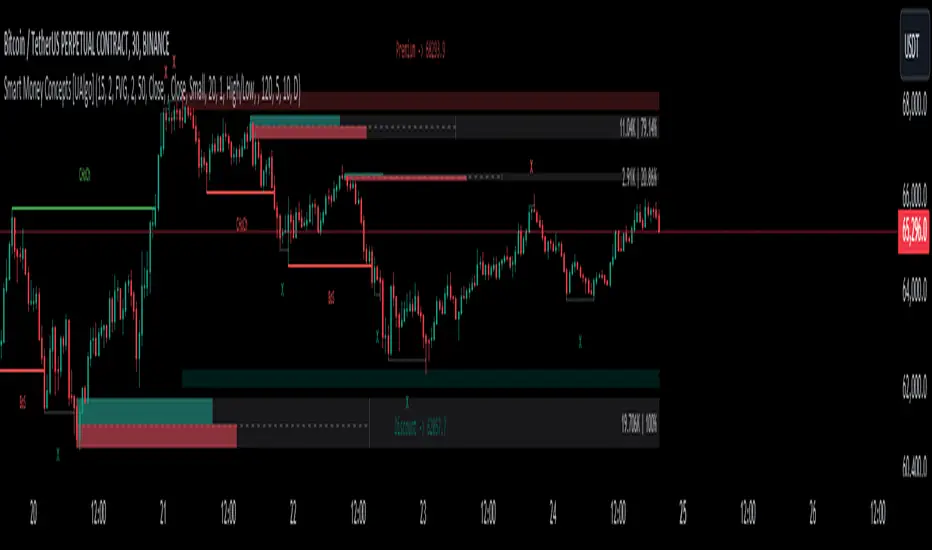
Price Action SuiteThe TRN Price Action Suite incorporates a treasure trove of time and price action concepts. It includes a set of trading tools that, when combined, allow for a more accurate view of the market. This enables traders to find high probability entry points before the market moves to the next liquidation level.
Features of the TRN Price Action Suite:
(Inverse) Fair Value Gaps (FVG)
Order Blocks (OB)
FVG and OB with Cumulative Volume Delta
Volume Imbalances
Market Structure
Liquidity levels
Sessions
Kill zones/Opening Range
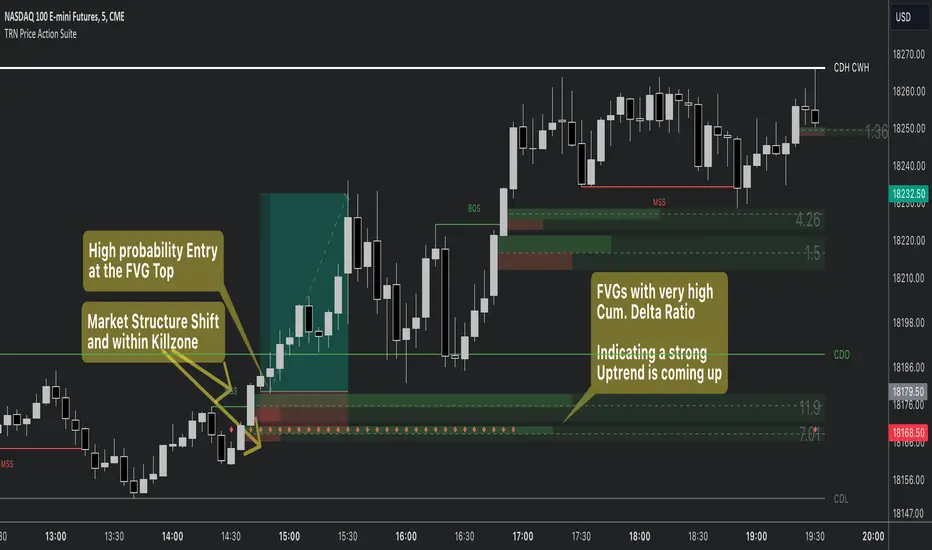
The indicator helps traders to easily identify favorable market conditions and high probability trade setups. It automatically finds time and price action concepts and displays them in an intuitive way on the chart. One of the highlights is the detection of Fair Value Gaps and Order Blocks in connection with Cumulative Volume Delta (approx.). You will not find this connection anywhere else.
Fair Value Gaps (FVGs)
A fair value gap occurs when there are inefficiencies in the market or imbalanced buying and selling pressures. Fair value gaps can become a magnet for the price before continuing in the same direction. Special attention should be paid to FVGs that are supported by support and resistance levels, as these offer a higher probability of success for trades. Additionally, the indicator plots inverse FVG (iFVG). These are FVG that are “closed” by a FVG in the other direction. IFVGs are a strong sign of the market to continue in the direction of the iFVG.
In addition to the FVGs you see on the chart, you can add also FVGs from a higher timeframe including the cumulative buy/sell volume. For this you can set “Timeframe 1” and “Timeframe 2” in the settings to your preferred timeframes. E.g. you trade on a 5-minute chart, and you want to see FVGs from 4 hours and a daily chart, then you set Timeframe 1 to 4 h and to Timeframe 2 to 1 D.
Order Blocks and Volume Imbalances can also be shown from higher timeframes.
Order Blocks (OBs)
Order blocks are areas on the chart where a high concentration of limit orders was found in the past. They can serve as potential support or resistance areas. These represent areas in the market where there is an oversupply (supply) or an excess demand (demand). They are often key zones for potential turning points or continuations of the current trend. A bullish OB, for example, is the last bearish candle before a significant uptrend.
FVGs and OBs with Cumulative Volume Delta
The TRN Price Action Suite can show FVGs and OBs with the corresponding Cumulative Volume Delta (CVD). It is a metric to analyze market dynamics by tracking the net difference between buying and selling volumes over a specific timeframe. It is used to determine the strength of the FVG/OB. The FVG/OB includes two bars on the left side, indicating the cumulative buy volume in green as well es the cumulative sell volume in red. At the right side of the FVG/OB box the ratio of the cumulative buy/sell volume is displayed. A high ratio over 1, for example 1.5, indicates a lot of buying pressure. On the hand, a ratio far below 1, for example 0.66, indicates a lot of selling pressure.
Volume Imbalances (VIBs)
Volume Imbalances indicate a price gap from the previous close, but unlike gaps, there is no absence of trading activity within a specific price range. Bullish VIs have opening and closing prices above the previous close, with overlap between the current low and previous high. Bearish VIs are vice versa.
Market Structure
The market structure represents the dominant trend in the market. It is based on swing highs and lows. For instance, if the price makes higher highs (HH) and higher lows (HL) the market structure represents an uptrend. Vice versa if price makes lower lows (LL) and lower highs (LH) the market trend is down.
If the market structure is up, traders can enter positions in a pullback. For this, a trader could use a FVG or an OB as an entry condition.
Market Structure Shift (MSS) (Change of Character (ChoCh))
A market structure shift occurs when the market transitions from one dominant trend to a different one, often signaling a potential change in the underlying market dynamics. A MSS signals the start of a new trend. It signals the change from an uptrend to a down trend and vice versa. Therefore, it is sometimes called change of character (ChoCh). A valid MSS should ideally occur in a strong supply or demand zone. This indicates that the market may be approaching a trend reversal or consolidation.
Break of Structure (BOS)
A break of structure happens when the market breaks out of its established trading range or pattern. The market continues its dominant trend, indicated by the last MSS.
In an uptrend, for example, each time the price breaks through a new high, a "bullish BOS" is formed. This indicates that the market can overcome previous resistance levels and continue to rise.
Levels
One core concept in trading is that price flows to areas of liquidity. Natural liquidity areas are the current day open, high, low (CDO, CDH, CDL) or the previous day high, low, close (PDH, PDL, PDC). The same is true for the current week (CWO, CWH, CWL) and the previous week (PWH, PWL, PWC).
Pay special attention in case some of these levels are close together. Then these levels serve like a magnet for the price. The TRN Price Action Suite indicator can cluster these levels fully automatically together to give the trader the flexibility to focus solely on the trading part.
Sessions
Sessions are the trading hours during which the banks are actively trading. The three main trading sessions:
Asia: Most of the volume from the Asian players are handled within this session.
London: This is where the European players are most active.
New York: In the New York session all the USA players are active as well as all the other American players. Furthermore, a lot of global players are active in this session as well.
Killzones
A kill zone in trading refers to a specific time period during the trading day when the market experiences increased volatility and liquidity. It is an opportunity for traders to capitalize on potential price movements and generate profits. There are several different killzones during the day.
There are three different types of killzones:
Indices/Futures: This one is suitable if you trade products like the ES, NQ, FDAX, CL or Stocks, Options.
Forex: If you trade Forex this setting will mark the most liquid periods of the day.
Opening Range: In case you trade the opening range of the sessions, use this setting.
Trading Example
ICT Immediate Rebalance [LuxAlgo]The ICT Immediate Rebalance aims at detecting and highlighting immediate rebalances, a concept taught by Inner Circle Trader. The ICT Immediate Rebalance, although frequently overlooked, emerges as one of ICT's most influential concepts, particularly when considered within a specific context.
🔶 USAGE
Immediate rebalances, a concept taught by ICT, hold significant importance in decision-making. To comprehend the concept of immediate rebalance, it's essential to grasp the notion of the fair value gap. A fair value gap arises from market inefficiencies or imbalances, whereas an immediate rebalance leaves no gap, no inefficiencies, or no imbalances that the price would need to return to.
Following an immediate rebalance, the typical expectation is for two extension candles to ensue; failing this, the immediate rebalance is deemed unsuccessful. It's important to note that both failed and successful immediate rebalances hold significance in trading when analyzed within a contextual framework.
Immediate rebalances can manifest across various locations and timeframes. It's recommended to analyze them in conjunction with other ICT tools or technical indicators to gain a more comprehensive understanding of market dynamics.
🔹 Multi Timeframe
The script facilitates multi-timeframe analysis, enabling users to display immediate rebalances from higher timeframes.
Enabling the display of higher timeframe candles helps visualize the detected immediate rebalance patterns.
🔹 Dashboard
The dashboard offers statistical insights into immediate rebalances.
🔶 SETTINGS
🔹 Immediate Rebalances
Timeframe: this option is to identify immediate rebalances from higher timeframes. If a timeframe lower than the chart's timeframe is selected, calculations will be based on the chart's timeframe.
Bullish, and Bearish Immediate Rebalances: color customization options.
Wicks 75%, %50, and %25: color customization options of the wick price levels for the detected immediate rebalances.
Immediate Rebalance Candles: toggles the visualization of higher timeframe candles where immediate rebalance is detected.
Confirmation (Bars): specifies the number of bars required to confirm the validation of the detected immediate rebalance.
Immediate Rebalance Icon: allows customization of the size of the icon used to represent the immediate rebalance.
🔹 Dashboard
Dashboard: toggles the visualization of the dashboard, sets its location, and customizes the size of the dashboard.
🔶 RELATED SCRIPTS
Fair-Value-Gap
Thanks to our community for recommending this script. For more conceptual scripts and related content, we welcome you to explore by visiting >>> LuxAlgo-Scripts .

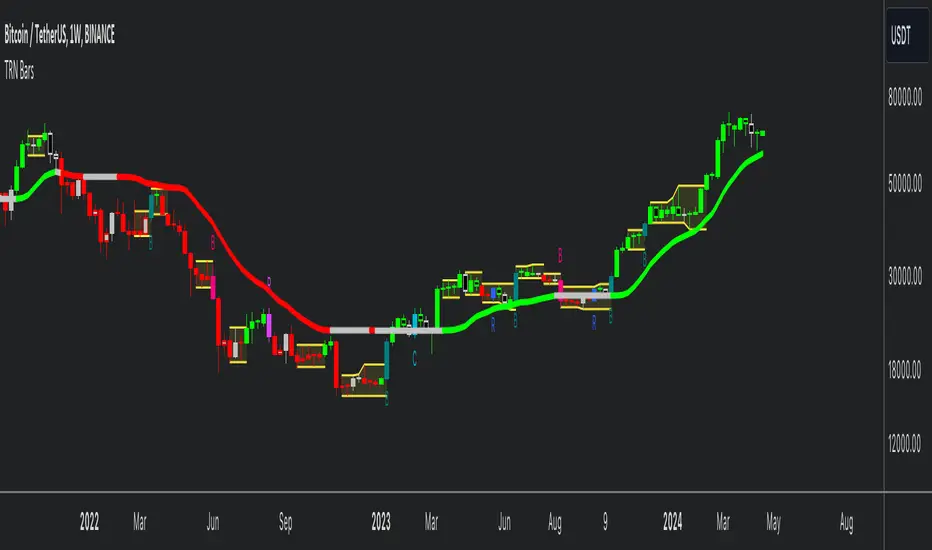
TRN BarsThe innovative TRN Bars are designed to help traders to analyze markets in an intuitive way. It combines three core concepts:
TRN Bars to see the current trend and reversals (replaces the default chart bars)
Bar Ranges to highlight consolidations
Dynamic Trend to see the overall trend.
First, let's have a look at each of these concepts individually. Afterwards, we describe how a combination of all three gives you a crystal-clear picture of the market.
TRN Bars
They show bullish and bearish trends and reversals based on color coding the bars and give high probability trade opportunities with special colors. The trend analysis is based on a new algorithm that includes several different inputs:
classical and advanced bar patterns and their statistical frequency
probability distributions of price expansions after certain bar patterns
bar information such as wick length in %, overlapping of the previous bar in % and many more
historical trend and consolidation analysis
The algorithm weighs these concepts and outputs a color scheme for the chart bars or candlesticks.
Bar Types
Trend bars in green and red
Reversal Bars in blue and fuchsia
Continuation Bars in turquoise and orange
Breakout Bars in dark green and pink
Green Bars signify a sustained uptrend, indicating bullish market sentiment. On the other hand, Red Bars indicate a persistent downtrend, representing bearish market sentiment. The transition from red to green denotes a bullish trend reversal, suggesting a shift from bearish to bullish sentiment. Conversely, the shift from green to red signals a bearish trend reversal, indicating a transition from bullish to bearish sentiment. By monitoring these color changes, traders can identify potential trend reversals and make informed trading decisions.
The presence of gray and black bars indicates a neutral market state, often observed before an impending color change from red to green or green to red. These neutral bars serve as a transition phase between the previous trend and the potential reversal.
The TRN Bars incorporate Signal Bars, distinguished by their distinct colors, to offer potential buy and sell signals and deeper insights into market dynamics.
Reversal Bars
The presence of blue Reversal Bars indicates a trend reversal to the upside, while pink Reversal Bars indicate a reversal to the downside. These bars not only serve as signals for potential trend shifts but also present favorable opportunities to enter the market or increase one's position size.
Continuation Bars
In addition to the reversal bars, TRN Bars also include bullish continuation bars (colored turquoise) and bearish continuation bars (colored orange). These bars act as signals for the continuation of an existing trend. Like the reversal bars, they can be utilized as entry points or opportunities to augment one's position size.
Breakout Bars
The dark green breakout bars within TRN Bars show a powerful breakout from a price range detected by our integrated bar range feature. They signify the continuation or potential change in a trend following a consolidation phase. As such, these bars hold dual functionality, serving as reversal signals and validating the persistence of an ongoing trend.
Bar Ranges
The bar range feature automatically finds consolidations where the price range of several consecutives bars is rather small. The detection of the bar ranges includes among other things the overlapping percentage of these bars.
How to Use Price Ranges
Here are a few ways you can use the bar ranges in your trading:
Identify Support and Resistance Levels
The price ranges can help you identify key support and resistance levels on a chart. By observing price ranges and identifying these levels, you can make more informed decisions about entering or exiting trades.
Breakout Trading
Price ranges can also provide insights into potential breakout opportunities. Breakouts occur when the price breaks out of a defined range, signaling a potential shift in market sentiment and the start of a new trend. The Color highlighted Breakout Bars from the TRN Bars are signaling a powerful breakout of a price range. Traders can enter positions in the direction of the breakout and set appropriate stop-loss orders to manage risk. Note that not every price range is left by a powerful breakout.
Dynamic Trend
The Dynamic Trend combines elements from standard trend strength indicators (e.g. DI-, DI+, Parabolic SAR) and volatility indicators (e.g. ATR, Standard Deviation). It produces a moving average line that adapts to changing market volatility. It is inspired by the ideas of the programmer and trader Fat Tails. The adaptive behavior provides more relevant information for traders when compared to traditional moving averages which do not consider volatility and trend strength together. This makes the Dynamic Trend completely unique, and no other moving average indicator can give you this precision.
How to use Dynamic Trend
Generally, a rising Dynamic Trend line, displayed in green, indicates that an uptrend is strong, while a falling Dynamic Trend, displayed in red, suggests that the downtrend is sharp. The Dynamic Trend turns gray when there is insufficient clarity to establish a distinct trend and especially when there is not volatility in the market.
Identify potential trade entries and exits: When used in conjunction with price action, the Dynamic Trend can provide potential trade signals. For example, if the price crosses above the Dynamic Trend, it may be a bullish sign, suggesting a potential buy entry. Conversely, if the price crosses below the Dynamic Trend, it may indicate bearish conditions and a potential sell signal.
Trend Identification and Pullback trading
Observe the Dynamic Trend's color. When it's on the rise and appears green, it indicates a bullish trend. Conversely, if it's in decline and displayed in red, it signals a bearish trend.
If Dynamic Trend is green and price pulls from above back to the Dynamic Trend, then this can be considered as a bullish signal.
If Dynamic Trend is red and price pulls from below back to the Dynamic Trend, then this can be considered as a bearish signal.
In the event of a bearish signal, such as a bearish TRN Signal Bar, and the Dynamic Trend is red, it provides additional confirmation to the bearish signal. Likewise, bullish signals gain added conviction when the Dynamic Trend is green.
Crossovers
As with other moving averages, crossovers between the Dynamic Trend and the price can be significant.
If price is crossing above the Dynamic Trend, then this can be considered as a bullish signal.
If price is crossing below the Dynamic Trend, then this can be considered as a bearish signal.
If you currently hold a position, both bullish and bearish crossovers can serve as potential exit signals. For instance, in the case of a long position, a bearish crossover can indicate a potential shift in sentiment, signaling a bearish reversal and a potential opportunity to close your long position.
Filtering Noise
Due to its adaptive nature, the Dynamic Trend can be a useful tool to filter out market noise. When the market is choppy or consolidating, the Dynamic Trend tends to remain flat and colored gray, signaling traders to potentially stay out of the market.
Stop Losses
The Dynamic Trend can also be used as a dynamic stop loss. For instance, in a long trade, traders can use the Dynamic Trend as a trailing stop, selling their position if the price crosses below the Dynamic Trend.
Combining TRN Bars, Bar Ranges and Dynamic Trend together
Combining all three concepts gives you a crystal-clear picture of the market. The Dynamic Trend shows you the overall trend. If price pulls back to the dynamic trend line and then price picks up the trend direction again, then the TRN Bars immediately switch the color to the trend direction. Therefore, you can easily identify high probability entry signals based on the bar color.
As a simple trading model, you can set the stop loss below the last swing or below a TRN signal bar (vice versa for short entries) and use 2.5 R or 3 R as target.
You can increase the success rate of the high probability TRN signal bars entries even more if they are in line with the Dynamic Trend line.
On the other hand, the TRN Bar Ranges help you to stay out of the market in case the price does not really change. As a confluence signal to stay flat in this period the dynamic trend line tends to be grey as well. If the price breaks out of the range, then the TRN Bars print a breakout bar which serves as a high probability entry signal.
Although it is possible to switch off any of these concepts, it is highly recommended to use all three in combination to get a crystal-clear picture of the market.
Alerts
Experience the power of our TRN Bars Alerts, delivering real-time notifications for trend changes, price range breakouts, and signal bar formations or confirmations. Stay on top of the market with these versatile alerts, customizable to your preferred assets and timeframes.
Conclusion
While signals from TRN Bars can be informative, it is important to recognize that their reliability may vary. Various external factors can impact market prices, and it is essential to consider your risk tolerance and investment goals when executing trades.
FVG Positioning Average [LuxAlgo]The FVG Positioning Average indicator aims to uncover potential price levels of interest by averaging together recent Fair Value Gap (FVG) initiation levels.
This indicator is grounded in the theory that significant buying or selling activity is the primary catalyst for creating FVGs.
By averaging together the prices where each FVG initiated, we may potentially reveal where major participants are positioned.
🔶 USAGE
By analyzing the average price of bullish or bearish FVGs, users can identify potential support or resistance areas where the larger participants may re-enter or defend their positions.
These areas could be used to adjust entries and exits or assist with risk management such as take-profit or stop-loss levels.
The indicator displays 2 lines, the Bull Average and the Bear Average.
The Bull Average is only displayed when the price holds above the bull Average.
The Bear Average is only displayed when the price holds below the bear average.
When only one average is displayed alone, this level is seen as support or resistance, it is anticipated that this level would be defended for the current trend to stay valid.
When both averages are displayed simultaneously, it can be interpreted as one side attempting to take over the trend.
The movements and reactions during these attempts can be analyzed to provide helpful information about where the price might be headed.
Possible outcomes:
Trend Confirmation/Re-Entry (From Weak Attempts)
Trend Reversal (Creating Support or Resistance)
Consolidation (Oscillating between/around Bull & Bear Averages)
🔶 DETAILS
🔹 Lookback Types
This indicator includes 2 lookback types:
Bar Count: Uses Bars to determine what data to include. This type can be utilized for averages that are more locally relevant to the current chart data.
FVG Count: Uses a specific # of FVGs for calculations. This type can be utilized for a continuous & consistent view, typically relevant with longer term analysis.
Note: When using bar lookback, if no data is in range, no lines will be displayed.
Below is an example of the 'FVG Count' Display.
🔹 Initiation Levels
Initiation Levels are the specific price points where each FVG starts, these are the last points the price was traded at before creating the gap.
Bull Initiation Level: Lowest Point (Bottom) of FVG
Bear Initiation Level: Highest Point (Top) of FVG
🔹 FVG Display
Each FVG being used for the current calculation of averages is displayed on the chart for reference.
Note: If you prefer to not display the FVGs, they can be toggled off in the settings, uncheck "Show FVGs on Chart".
🔶 Settings
FVG Lookback: As mentioned above in the 'Lookback Types', this sets the number of FVGs or Bars to use for consideration.
Lookback Type: As also mentioned above in 'Lookback Types', this determines the method of lookback to be used.
ATR Multiplier: The FVGs are required to have a Greater Width than (ATR * Multiplier) in order to be used for calculations. This allows you to focus on the data being considered if needed.

Volumetric Fair Value Gaps [AlgoAlpha]🎯 Introducing the Volumetric Fair Value Gaps by AlgoAlpha 🎯
Embrace the power of volume and price action with the Volumetric Fair Value Gaps (VFVG) indicator, designed meticulously by AlgoAlpha. This innovative tool enhances your charting capabilities by highlighting fair value gaps in real-time, facilitating superior market entry and exit decisions. 🚀📈
🔍 Key Features:
🔹 Fair Value Gap Detection: Utilizes price action and volume to identify significant fair value gaps, offering potential high-probability trading opportunities.
🔹 Adjustability: Customize the sensitivity with 'FVG Noise Reduction Length' and 'Noise Reduction Factor' to match the volatility and characteristics of the asset being traded.
🔹 Visual Appeal: Displays bullish gaps in a soothing Bullish Color and bearish gaps in a striking Bearish Color, making it easy to spot and analyze trends on the fly.
🔹 Overlay Feature: Plots directly on the price chart for seamless integration and analysis.
🌟 Quick Guide to Using the Volumetric Fair Value Gaps Indicator:
🛠 Add the Indicator: Add the indicator to favourites and set it up with your desired settings.
📊 Market Analysis: Watch for the appearance of colored boxes (blue for bearish, gray for bullish) which represent the fair value gaps. These are high-probability areas for reversals or continuations. FVGs with higher volume are implied to induce a stronger reaction on price.
🔔 Alerts: Set up alerts to notify you when new gaps are detected, ensuring you never miss out on potential trades!
🛠 How It Works:
The Volumetric Fair Value Gaps (VFVG) indicator identifies significant price gaps that are not just based on price action but are also substantiated by volume, which are often overlooked in typical analyses. It operates by comparing the current candle’s price range against historical averages and is calculated over a user-defined period, displayed with volume for further insights. For a gap to be recognized as significant (either bullish or bearish), it must exceed a certain size relative to these averages, which can be adjusted for sensitivity using the provided settings. Bullish gaps are identified when the current low is higher than the second previous high after surpassing the threshold, and bearish gaps are marked when the current high is below the second previous low, similarly surpassing the threshold. This dual-confirmation (volume and price deviation) approach minimizes false signals and enhances the reliability of identified gaps.
Maximize your trading strategy with the VFVG Indicator by AlgoAlpha and turn those gaps into opportunities! 🌈✨

Fair Value Gaps (FVG) [UAlgo]A fair value gap is especially popular among price action traders and occurs when there are inefficiencies or imbalances in the market, or when the buying and selling are not equal. Fair value gaps can become a magnet for the price before continuing in the same direction.
🔶 Key Features :
Fair Value Gap Identification:
Bullish fair value gaps occur when the current market price exceeds the previous high. The indicator identifies bullish gaps by comparing the low of the current candle with the high of the candle two candles ago . If the low of the current candle is higher than the high two candles ago and the closing price of the previous candle is also higher than the high two candles ago, a bullish fair value gap is detected.
Bearish fair value gaps occur when the current market price falls below the previous low. The indicator identifies bearish gaps by comparing the high of the current candle with the low of the candle two candles ago. If the high of the current candle is lower than the low two periods ago and the closing price of the previous candle is also lower than the low two candles ago, a bearish fair value gap is detected.
Fair Value Gap Filter :
ATR measures market volatility by analyzing the range of price movements over a specified period. It provides insights into the average price range that a security experiences within a given timeframe. After the ATR is calculated, a Simple Moving Average (SMA) is computed for the ATR values. This moving average smoothens out the ATR data, providing a clearer indication of the average volatility levels over time.
When the filter is active, fair value gaps are identified only if they occur during periods of relatively higher volatility, as indicated by the ATR being greater than the SMA. This helps in refining and obtaining the detection of stronger fair value gaps
An example with FVG filtering off:
An example with FVG filtering on:
Customizable Settings: Users have the flexibility to customize various parameters to suit their trading preferences. They can adjust settings such as the number of fair value gaps displayed, mitigation method (either based on closing prices or wicks), and apply filters based on Average True Range (ATR) to refine gap detection.
🔶 Disclaimer :
Use with Caution: Trading involves significant risk, and this indicator should be used with caution. While it can help identify potential trading opportunities, it does not guarantee profits and may sometimes provide false signals.
Not Financial Advice: The information provided by the Fair Value Gaps indicator is for educational and informational purposes only and should not be considered as financial advice. Traders should conduct their own research and consult with financial professionals before making any trading decisions.
Past Performance: Past performance is not indicative of future results. Historical price movements analyzed by the indicator may not accurately predict future market behavior.

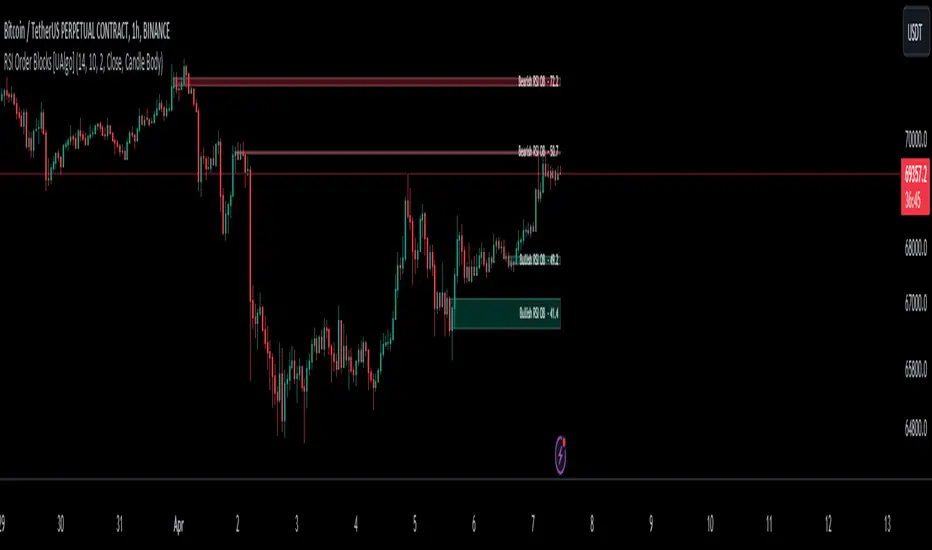
RSI Order Blocks [UAlgo]The "RSI Order Blocks " identifies and visualizes potential order blocks based on the Relative Strength Index (RSI) indicator. These zones may indicating potential support or resistance levels.
🔶 Key Features :
RSI-based Order Block Identification: The script utilizes the RSI indicator to identify potential order blocks. It detects pivot highs and lows in the RSI, which are indicative of potential reversal points, and marks these areas as potential order blocks.
Order Block Visualization: Identified order blocks are visually represented on the chart, making it easy for traders to recognize and interpret these significant price zones. Both bullish and bearish order blocks are differentiated by color, enhancing clarity and ease of analysis. Additionally, within each order block, the RSI value of that block is also shown.
RSI Overbought/Oversold Filter: Optionally, users can apply a filter based on RSI levels to refine the detection of order blocks. This filter prevents the creation of order blocks when the RSI is within specified overbought or oversold conditions (default between 30 and 70), helping traders focus on areas of potentially significant price action.
An Example with the OB/OS Filter Feature Turned Off:
An Example with the OB/OS Filter Feature Turned On:
Mitigation of Broken Order Blocks: Provides flexibility in selecting the mitigation method (based on close or wick) for determining order block breaches.
Customizable Parameters: The script offers a range of customizable parameters to tailor the detection and visualization of order blocks to suit individual trading preferences. Users can adjust parameters such as RSI Length, Order Block Detection Sensitivity, Mitigation Method, and order block style to fine-tune the analysis according to their trading strategy.
🔶 Disclaimer :
Not Financial Advice: This indicator is intended for educational and informational purposes only. It does not constitute financial advice or recommendations to buy, sell, or hold any financial instruments.
Use at Own Risk: Trading involves substantial risk of loss and is not suitable for all investors. Users of this indicator should exercise caution and conduct their own research and analysis before making any trading decisions.
Performance Not Guaranteed: Past performance is not indicative of future results. While the indicator aims to assist traders in analyzing market trends, there is no guarantee of accuracy or success in trading operations.
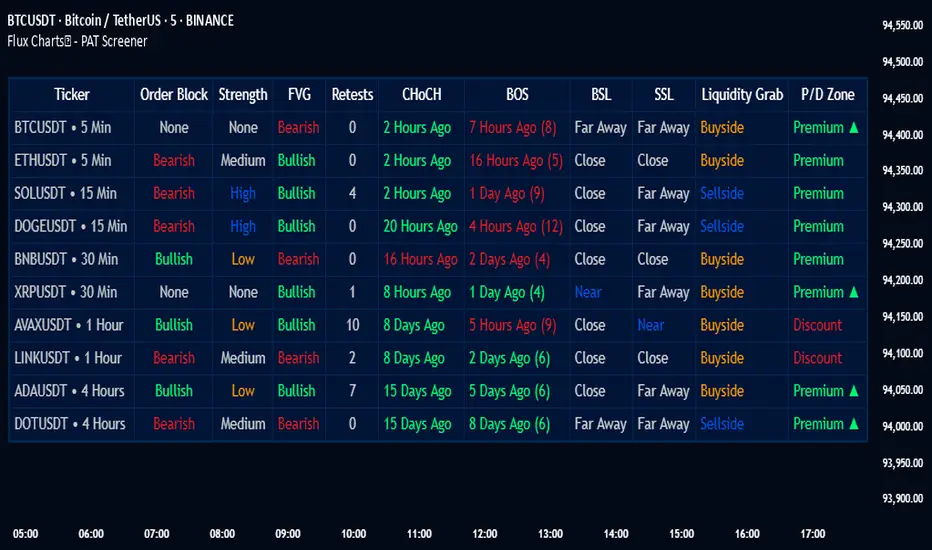
PAT Screener | Flux Charts💎 GENERAL OVERVIEW
Introducing our new Price Action Toolkit (PAT) Screener! This screener can spot trading opportunities that Price Action Toolkit offers across 8 different tickers! We believe that this screener will help you take a glimpse of the current state of the market much easier.
Features of the new Price Action Toolkit (PAT) Screener :
Finds Latest Across 8 Tickers:
Order Blocks
Breaker Blocks
Fair Value Gaps (FVG)
Inversion FVGs
Market Structures (BOS, CHoCH, CHoCH+)
Liquidity Zones
Liquidity Grabs
Premium / Discount Zones
Shows Additional Information Like :
Strength
Retests
(Bullish & Bearish) Volume
Consumption
Also :
All Features Support Tuning
Customizable Theme
📌 HOW DOES IT WORK ?
1. Order Blocks
Order blocks occur when there is a high amount of market orders exist on a price range. It is possible to find order blocks using specific formations on the chart.
The high & low volume of order blocks should be taken into consideration while determining their strengths. The determination of the high & low volume of order blocks are similar to FVGs, in a bullish order block, the high volume is the last 2 bars' total volume, while the low volume is the oldest bar's volume. In a bearish order block scenario, the low volume becomes the last 2 bars' total volume.
2. Breaker Blocks
Breaker blocks form when an order block fails, or "breaks". It is often associated with market going in the opposite direction of the broken order block, and they can be spotted by following order blocks and finding the point they get broken, i.e. price goes below a bullish order block.
The volume of a breaker block is simply the total volume of the bar that the original order block is broken. Often the higher the breaking bar's volume, the stronger the breaker block is.
The strength of Order & Breaker Blocks are calculated by the size of the block to the Average True Range (ATR) of the chart.
3. Fair Value Gaps
Fair value gaps often occur when there is an imbalance in the market, and can be spotted with a specific formation on the chart.
The volume when the FVG occurs plays an important role when determining the strength of it, so we've placed two bars on the FVG zone, indicating the high & low volumes of the FVG. The high volume is the total volume of the last two bars on a bullish FVG, while the low volume is - of the FVG. For a bearish FVG, the total volume of the last two bars is the low volume. The indicator can also detect FVGs that exist in other timeframes than the current chart.
4. Inversion Fair Value Gaps
A Fair Value Gap generally occur when there is an imbalance in the market. They can be detected by specific formations within the chart. An Inverse Fair Value Gap is when a FVG becomes invalidated, thus reversing the direction of the FVG.
IFVGs get consumed when a Close / Wick enters the IFVG zone. Check this example:
5. Market Structures
Sometimes specific market structures form and break as the market fills buy & sell orders. Formed Change of Character (CHoCH) and Break of Structure (BOS) often mean that market will change direction, and they can be spotted by inspecting low & high pivot points of the chart.
The number of times the chart recently had a BOS is displayed between brackets, Ex : (3)
6. Liquidity Zones
Buyside & Sellside Liquidity zones are where most traders place their take-profits and stop-losses in their long / short positions. They are spotted by using high & low pivot points on the chart.
7. Liquidity Grabs
Liquidity grabs occur when one of the latest pivots has a false breakout. Then, if the wick to body ratio of the bar is higher than 0.5 (can be changed from the settings) a liquidity grab has occurred.
8. Premium & Discount Zones
The premium zone is a zone that is over the fair value of the asset's price, and the discount zone is the opposite. They are formed by the latest high & low pivot points.
If the latest close price is outside the Premium or Discount zone, you will see "Premium ⬆️" or "Discount ⬇️". These mean that the price is currently higher than the premium zone or lower than the discount zone.
🚩UNIQUENESS
This screener offers a comprehensive dashboard for traders, combining multiple analytical elements with customizable settings to aid in decision-making across different tickers and timeframes. We believe that this will help traders spot trading opportunities much easier by providing crucial information in a single dashboard. Our new screener contains of common elements like Order & Breaker Blocks, Fair Value Gaps & IFVGs as well as rather unique elements like Liquidity Grabs . With the use of up to 8 tickers & timeframes , you can easily take a look at the bigger picture of the market. We recommend reading the "How Does It Work" section of the description to get a better understanding about how this indicator is unique to others.
⚙️SETTINGS
1. Tickers
You can set up to 8 tickers for the screener to scan here. You can also enable / disable them and set their individual timeframes.
You can enable / disable Retests, Strength, Consumption and (Bullish & Bearish) Volume for :
Order Blocks (Retests, Strength, Bullish & Bearish Volume)
Breaker Blocks (Retests, Strength, Volume)
Fair Value Gaps (Retests, Consumption, Strength, Bullish & Bearish Volume)
Inversion Fair Value Gaps (Retests, Consumption, Strength, Volume)
2. Order Blocks
Enabled -> Enables / Disables Order Blocks
Zone Invalidation -> Select between Wick & Close price for Order Block Invalidation.
Swing Length -> Swing length is used when finding order block formations. Smaller values will result in finding smaller order blocks.
3. Breaker Blocks
Enabled -> Enables / Disables Breaker Blocks
Zone Invalidation -> Select between Wick & Close price for Breaker Block Invalidation.
4. Fair Value Gaps
Enabled -> Enables / Disables Fair Value Gaps
Zone Invalidation -> Select between Wick & Close price for FVG Zone Invalidation.
Zone Filtering -> With "Average Range" selected, algorithm will find FVG zones in comparison with average range of last bars in the chart. With the "Volume Threshold" option, you may select a Volume Threshold % to spot FVGs with a larger total volume than average.
FVG Detection -> With the "Same Type" option, all 3 bars that formed the FVG should be the same type. (Bullish / Bearish). If the "All" option is selected, bar types may vary between Bullish / Bearish.
Detection Sensitivity -> You may select between Low, Normal or High FVG detection sensitivity. This will essentially determine the size of the spotted FVGs, with lower sensitivities resulting in spotting bigger FVGs, and higher sensitivities resulting in spotting all sizes of FVGs.
5. Inversion Fair Value Gaps
Zone Invalidation -> Select between Wick & Close price for IFVG Zone Invalidation. This setting also switches the type for IFVG consumption.
6. Market Structures
Break Of Structure (BOS) -> If the current structure of the market is broken in a bullish or bearish direction, it will be displayed.
Change Of Character (CHoCH) -> If the market shifts into another direction, it will be displayed.
Change Of Character+ (CHoCH+) -> This will display Change Of Characters detected with higher sensitivity if enabled.
7. Liquidity Zones
Buyside Liquidity -> Enables / Disables Buyside Liquidity
Sellside Liquidity -> Enables / Disables Sellside Liquidity
8. Liquidity Grabs
Pivot Length -> This setting determines the range of the pivots. This means a candle has to have the highest / lowest wick of the previous X bars and the next X bars to become a high / low pivot.
Wick-Body Ratio -> After a pivot has a false breakout, the wick-body ratio of the latest candle is tested. The resulting ratio must be higher than this setting for it to be considered as a liquidity grab.
9. Premium & Discount Zones
Enabled -> Enables / Disables Premium & Discount Zones.
10. Style
You can customize the visual looks of the screener here.
Smart Money Setup 03 [TradingFinder] Minor OB & Trend Proof🔵 Introduction
The "Smart Money Concept" transcends mere technical trading strategies; it embodies a comprehensive philosophy elucidating market dynamics. Central to this concept is the acknowledgment that influential market participants manipulate price actions, presenting challenges for retail traders.
As a "retail trader", aligning your strategy with the behavior of "Smart Money," primarily market makers, is paramount. Understanding their trading patterns, which revolve around supply, demand, and market structure, forms the cornerstone of your approach. Consequently, decisions to enter trades should be informed by these considerations.
🟣 Important Note
In this setup, pattern formation revolves around the robustness of the "Stop Hunt" targeting retail traders.
When this stop hunt occurs, if the price tests below the minor pivot or above the minor pivot, a "Minor Order Block" is formed.
Similarly, if the price tests below the major pivot or above the major pivot, a "Major Order Block" is formed.
Since the price hasn't successfully broken the major pivots before breaking the Top or Bottom, it can be inferred that the minor pivots formed within a leg of price movement exhibit a "Range" structure.
For a deeper comprehension of this setup, refer to the accompanying visual aids below.
Bullish Setup Details :
Bearish Setup Details :
🔵 How to Use
Upon integrating the indicator into your chart, exercise patience as you await the evolution of the trading setup.
Experiment with different trading positions by adjusting both the "Time Frame" and "Pivot Period". Typically, setups materializing over longer "Time Frames" and "Pivot Periods" carry heightened validity.
Bullish Setup Details on Chart :
Bearish Setup Details on Chart :
Within the settings, you possess the flexibility to modify the "Pivot Period" input to tailor the indicator to your preferences.

Dynamic Order Blocks [LuxAlgo]The Dynamic Order Blocks indicator displays the most recent unmitigated bullish and bearish order blocks on the chart, providing dynamic support/resistance areas.
When price sweeps an order block, this is highlighted by the script indicating a potential reversal.
The average between the displayed order blocks is also displayed.
🔶 USAGE
Order blocks are a popular method of price action analysis, representing price areas where more significant market participants accumulate their orders.
Displaying order blocks dynamically allows obtaining relevant areas of support/resistance. Users can obtain longer-term order blocks using a higher "Swing Lookback" setting.
Users can also use mitigation events to assess the current trend direction, with price mitigating a bearish order block (breaking above the upper extremity) indicating an uptrend, and price mitigating a bullish order block (breaking below the lower extremity) indicating a downtrend.
🔹 Average Level
An average level obtained from the displayed bullish and bearish order blocks is included in the indicator and offers an additional polyvalent dynamic support/resistance level.
The change of direction of the average line can also be indicative of the current trend direction.
🔹 Dynamic Sweeps
Price sweeping the mitigation level of an order block is highlighted on the chart using bordered rectangles. These highlight a breakout failure and can be indicative of a potential reversal.
🔶 SETTINGS
Swing Lookback: Period of the swing detection used to construct order blocks. Higher values will return longer-term order blocks.
Use Candle Body: Use the candle body as the order block area instead of the candle full range.

Smart Money Concepts [UAlgo]🔶 Description:
Smart Money Concepts (SMC) refer to a trading strategy that revolves around understanding and following the actions of institutional investors, such as banks and hedge funds, who are considered the “smart money” in the market. The concept is based on the idea that these institutions have more information and resources, and thus their market activities can indicate future market movements.
This script designed to be a tool that will automatically provide many features related to SMC concept for investors, offering a market structure analysis that includes the identification of order blocks, breaker blocks, and liquidity points. It also delineates premium and discount zones, highlights Fair Value Gaps (FVG), Volume Imbalance (VI) and Order Gap (OG) areas, providing users with a multifaceted view of market dynamics.
🔶 Key Features:
Market Structure Analysis : Simplifies the overview of market behavior, identifies market breakouts or trend continuation.
It detects the market structure as shown in the image below :
Order Blocks : Detects Order Blocks based on market structure analysis and volume characteristics. It draws these blocks and provides information such as volume.
Order Block Identification:
Breaker Blocks : Detects Breaker Blocks based on market structure analysis.
Breaker Block Identification:
When Order Block above is broken,
As you can see, it has now turned into a Bearish Breaker Block,
And it seems that the price is getting a reaction from this breaker block above.
Liquidity Sweeps : Tracks liquidity sweeps on both the buy and sell sides, offering traders a perspective on market momentum and potential shifts.
Multi-Timeframe Fair Value Gap (FVG), Volume Imbalance (VI), Order Gaps (OG) Detection : Detects Fair Value Gap (FVG), Volume Imbalance (VI) and Order Gaps (OG) based on different criteria such as price movements and volume characteristics. It marks these gaps/voids and provides visual cues for analysis.
Examle for FVG:
Premium & Discount Zone Analysis : Analyzes premium and discount zones, showing prices within these zones and highlighting equilibrium (0.5) levels.
Customizable Options : Provides various input parameters for customization, such as market structure length, sensitivity settings, display preferences, and mitigation methods.
Previous Key Levels : Identifies previous key levels include previous highs, lows, equilibrium points, and open prices across different timeframes such as daily, weekly, and monthly.
🔶 Disclaimer:
Use with Caution: This indicator is provided for educational and informational purposes only and should not be considered as financial advice. Users should exercise caution and perform their own analysis before making trading decisions based on the indicator's signals.
Not Financial Advice: The information provided by this indicator does not constitute financial advice, and the creator (UAlgo) shall not be held responsible for any trading losses incurred as a result of using this indicator.
Backtesting Recommended: Traders are encouraged to backtest the indicator thoroughly on historical data before using it in live trading to assess its performance and suitability for their trading strategies.
Risk Management: Trading involves inherent risks, and users should implement proper risk management strategies, including but not limited to stop-loss orders and position sizing, to mitigate potential losses.
No Guarantees: The accuracy and reliability of the indicator's signals cannot be guaranteed, as they are based on historical price data and past performance may not be indicative of future results.
Price Action Fractal Forecasts [AlgoAlpha]🔮 Price Action Fractal Forecasts - Unleash the Power of Historical Patterns! 🌌✨
Dive into the future with AlgoAlpha's Price Action Fractal Forecasts ! This innovative indicator utilizes the mesmerizing complexity of fractals to predict future price movements, offering traders a unique edge in the market. By analyzing historical price action and identifying repeating patterns, this tool forecasts future price trends, providing visually engaging and actionable insights.
Key Features:
🔄 Flexible Data Series Selection: Choose your preferred data series for precise analysis.
🕰 Flexible Training and Reference Data Windows: Customize the length of training data and reference periods to match your trading style.
📈 Custom Forecast Length: Adjust the forecast horizon to suit your strategic objectives.
🌈 Customizable Visual Elements: Tailor the colors of forecast deviation cones, data reference areas, and more for optimal chart readability.
🔄 Anticipatory and Repetitive Forecast Modes: Select between anticipating future trends or identifying repetitive patterns for forecasts.
🔎 Enhanced Similarity Search: Leverages correlation metrics to find the most similar historical data segments.
📊 Forecast Deviation Cone: Visualize potential price range deviations with adjustable multipliers.
🚀 Quick Guide to Maximizing Your Trading with Price Action Fractal Forecasts:
🛠 Add the Indicator: Search for "Price Action Fractal Forecasts" in TradingView's Indicators & Strategies. Customize settings according to your trading strategy.
📊 Strategic Forecasting: Monitor the forecast deviation cone and forecast directional changes for insights into potential future price movements.
🔔 Alerts for Swift Action: Set up notifications based on forecast changes to stay ahead of market movements without constant monitoring.
Behind the Magic: How It Works
The core of the Price Action Fractal Forecasts lies in its ability to compare current market behavior with historical data to unearth similar patterns. It first establishes a training data window to analyze historical prices. Within this window, it then defines a reference length to identify the most recent price action that will serve as the basis for comparison. The indicator searches through the historical data within the training window to find segments that closely match the recent price action in the reference period.
Depending on whether you choose the anticipatory or repetitive forecast mode, the indicator either looks ahead to predict future prices based on past outcomes following similar patterns or focuses on the repeating patterns within the reference period itself for forecasts. The forecast's direction can be configured to reflect the mean average of forecasted prices or the end-point relative to the start-point of the forecast, offering flexibility in how forecasts are interpreted.
To enhance the comprehensiveness and visualization, the indicator features a forecast deviation cone. This cone represents the potential range of price movements, providing a visual cue for volatility and uncertainty in the forecasted prices. The intensity of this cone can be adjusted to suit individual preferences, offering a visual guide to the level of risk and uncertainty associated with the forecasted price path.
Embrace the fractal magic of markets with AlgoAlpha's Price Action Fractal Forecasts and transform your trading today! 🌟🚀

FVG Detector [TradingFinder] Fair Value Gap-Imbalance-Mitigated🔵 Introduction
When the market makes a strong move in the form of a "Marubozu" or "Spike" candlestick and consecutive candles move without a retracement, the maximum place where a "FVG" or "Fair Value Gap" is created.
🔵 Definition
To describe this precisely, whenever a move occurs where the current candle does not cover the body of the previous and subsequent candles, a fair value gap is created.
Important : The significant point is that, because there is no equilibrium between buyers and sellers in these conditions, and market power is in the hands of buyers or sellers, the market is likely to move towards these areas.
An example of "FVG" in a price increase where we expect buying on the return to it.
An example of "FVG" in a downward trend where the market will move towards it in a downward direction.
🔵 How to Use
🟣 Bearish FVG
In a downward trend, "orange boxes" are drawn, which are the same and can act as "support" zones along the downward path, and we expect the price to continue its downward trend on return.
🟣 Bullish FVG
In an upward trend, "green boxes" are drawn, which are . They act exactly like support in the upward path, and we expect the price to continue its upward trend on return.
🟣 Auxiliary Definitions
Imbalance : As mentioned above, market power is in the hands of one of the two sides, buyers or sellers, and a non-equilibrium zone is created. It may be completed in whole or in part in subsequent price movements.
Mitigated : If the price returns to the "FVG" area and fills it, we call it "Mitigated," and most "pending" or "profit and loss limits" positions are executed. We will not have a specific reaction on the return of the price.
🔵 Settings
Very Aggressive : In addition to the initial condition, another condition is added. For an upward FVG, the maximum price of the last candle should be larger than the middle candle's maximum price. Similarly, for a downward FVG, the minimum price of the last candle should be smaller than the middle candle's minimum price. In this mode, a very small number of FVGs are eliminated.
Aggressive : In addition to the conditions of the Very Aggressive mode, in this mode, the size of the middle candle should not be small. In this mode, a larger number of FVGs are eliminated.
Defensive : In addition to the conditions of the Very Aggressive mode, in this mode, the size of the middle candle should be relatively large, and the majority of it should be made up of the body. Additionally, to identify upward FVGs, the second and third candles must be positive, and to identify downward FVGs, the second and third candles must be negative. In this mode, a large number of FVGs are eliminated, leaving only those with suitable quality.
Very Defensive : In addition to the conditions of the Defensive mode, the first and third candles should not be very small-bodied doji candles. In this mode, the majority of FVGs are filtered out, leaving only the highest quality ones.
🔵 Features
Show Demand FVG : Displays demand-related boxes, which can be "off" and "on."
Show Supply FVG : Displays supply-related boxes along the path, and can be turned "off" and "on."
🔵 Indicator Advantages
In this indicator, I have implemented 4 types of "filters" that allow you to select one based on the trading symbol, timeframe, etc. From "Very Aggressive" to "Very Defensive" mode, it is possible to select.
In most indicators, all FVGs are displayed, and the chart becomes full of lines. But this unique feature allows the trader to manage the drawing of boxes.

Pin Bar PrompterRecognition principle of the Pin Bar
1. The K-Chart has a long shadow line
2. The length of the long shadow line must be greater than 2/3 of the length of the body
3. The shadow line above the body is bearish Pin Bar; the shadow line below the body is bullish Pin Bar.
Pin Bar is just a K-Chart pattern and is only used as a basis for judgment and not as investment advice.
Pin Bar识别的逻辑
1.K线有长影线
2.长影线的长度大于整根K长度的2/3
3.影线在实体上方为:看跌pinbar;影线在实体下方为:看涨pinbar
Pin Bar只是一种K线形态,仅作为一种判断依据,不作为投资建议

NY Open Breakout Strategy - High Liquidity & Favorable RRR Pine Description:
The NY Open Breakout Strategy is an advanced Pine Script indicator tailored for the TradingView platform. This strategy is specifically designed to exploit the high liquidity found during the New York session opening in the Forex market. Its primary goal is to provide traders with an opportunity to engage in positions with lower risk and higher potential profits, thereby ensuring an advantageous risk-to-reward ratio (RRR).
Core Objectives:
Leveraging High Liquidity: Capitalizes on the significant market movements at the New York session opening, known for its high liquidity, to identify strong breakout signals.
Achieving Favorable RRR: By setting strategic stop-loss and take-profit levels, the strategy aims for a higher RRR. This approach can lead to overall profitability, even if the win rate is lower than the loss rate.
Functionality:
Dynamic Breakout Identification: Uses the first 15-minute candle’s high and low after NY open as benchmarks for detecting potential breakouts.
Customizable Stop-Loss & Take-Profit: Provides options to configure stop-loss at the last swing or the previous candle’s close. The take-profit levels are determined based on a favorable risk-reward ratio.
Visual Session Indicators: Includes distinct background coloring and vertical lines to mark the New York session for easy visibility.
Methodology:
This strategy hinges on the premise that the opening of the New York session often triggers key price movements due to an influx of trading activity. By focusing on these moments, our indicator aims to capture strong trends and breakout patterns. The carefully calibrated stop-loss and take-profit settings ensure that each trade aims for a higher potential reward compared to the risk undertaken.
Unique Features:
Enhanced Risk Management: With adaptable risk-reward settings, traders can tailor their trading strategies to align with individual risk appetites.
Personalized User Experience: Offers a range of customizable settings for visual elements, allowing traders to adjust the look and feel of the indicator to their preferences.
Usage Guidelines:
Customize the indicator settings, including the stop-loss reference and risk-reward ratio, to match your trading style.
Watch for 'Buy Enter' and 'Sell Enter' signals during the New York session opening.
Utilize the displayed stop-loss and take-profit levels to effectively manage each trade.
This NY Open Breakout Strategy is ideal for traders who prioritize efficient risk management while aiming to capitalize on the high liquidity periods of the Forex market. The strategy is designed to be robust, providing a pathway to profitability even in scenarios where the number of losing trades surpasses winning ones, thanks to its emphasis on a high risk-to-reward ratio.

Dip & Rip Patterns - The Quant Science🇺🇸
GENERAL OVERVIEW
This indicator detects Dip and Rip patterns by quickly highlighting them on the chart.
These patterns have become popular during the pandemic period mainly in the stock, ETF and cryptocurrency markets on which traders use two interesting strategies:
Buy The Dip
Sell The Rip
Before going into the merits of this technical indicator, let's understand what these two patterns mean and what they identify precisely.
Rip (Rise In Price) : wants to identify a market condition in which the price rises rapidly, for example from $100 to $110 in a few minutes or hours.
Dip (Drop In Price) : wants to identify a market condition in which the price drops rapidly, for example from $100 to $90 in a few minutes or hours.
HOW TO USE
For a better user experience, we recommend choosing a neutral colour for the candles while analysing with this indicator. You can quickly change the colour in Chart Settings > Symbol > Candles .
Depending on the configuration set by the user, the indicator will show Dip (Dip In Price) patterns in red and Rip (Rise In Price) patterns in green.
When the pattern forms, a circle will be displayed and a vertical line will be coloured on the chart along with the body of the candle. The user will then be able to quickly and easily track the configured market conditions.
In this example, we decided to use a 4H timeframe on the BTC/USDT pair (Binance).
Set in the user interface:
Period: 20
Dip (%): -25
Rip (%): 20
Price falls by 25% or more in 80 hours (Dip Pattern).
Price rise by 25% or more in 80 hours (Rip Pattern).
The user can easily configure the parameters via the user interface in the Inputs section (A) and change the indicator design in the Properties section (B).
🇮🇹
PANORAMICA GENERALE
Questo indicatore rileva i Dip e Rip patterns evidenziandoli velocemente sul grafico.
Questi patterns sono diventati famosi durante il periodo pandemico principalmente nel mercato delle azioni, ETF e Criptovalute su cui i trader utilizzano due interessanti strategie:
Buy The Dip
Sell The Rip
Prima di entrare nel merito di questo indicatore tecnico, comprendiamo il significato di questi due pattern e cosa identificano precisamente.
Rip (Rise In Price) : vuole identificare una condizione di mercato in cui il prezzo sale rapidamente, per esempio passando da 100$ a 110$ in pochi minuti o poche ore.
Dip (Drop In Price) : vuole identificare una condizione di mercato in cui il prezzo cala rapidamente, per esempio passando da 100$ a 90$ in pochi minuti o poche ore.
UTILIZZO
Per una migliore esperienza utente consigliamo di scegliere un colore neutro per le candele mentre si analizza con questo indicatore. Puoi cambiare velocemente il colore in Chart Settings > Symbol > Candles .
In base alla configurazione impostata dall'utente l'indicatore mostrerà in rosso i pattern Dip (Dip In Price) e in verde i pattern Rip (Rise In Price).
Quando il pattern si forma verrà visualizzato un cerchio e una linea verticale sul grafico che sarà colorata insieme al corpo della candela. L'utente quindi potrà tracciare facilmente e velocemente le condizioni di mercato configurate.
In questo esempio abbiamo deciso di utilizzare un timeframe 4H con l'obbiettivo di ricercare i patterns sul pair BTC/USDT (Binance).
Impostiamo nell'interfaccia utente:
Period: 20
Dip (%): -25
Rip (%): 20
Il prezzo diminuisce del 25% o più in 80 ore (Dip Pattern).
Il prezzo aumenta del 25% o più in 80 ore (Rip Pattern).
L' utente può configurare facilmente i parametri attraverso l'interfaccia utente nella sezione Inputs (A) e modificare il design dell'indicatore nella sezione Properties (B).

Buy/Sell BoxThis indicator tries to identify the points where the price exceeds or falls below a rectangle based on the opening and closing prices of the previous period, the creation of the boxes occurs when a doji is detected therefore it will calculate the coordinates of the rectangle that will be drawn around it, therefore the indicator offers buy or sell signals based on this logic. Specifically, the buy signal is generated if the closing price is above the top of the rectangle and satisfies some previous price conditions while the sell signal is generated if the closing price is below the bottom of the rectangle and satisfies some conditions of previous prices within a further threshold based on the Ema 150.
Lines are then drawn on the graph to visually display the extreme price levels, which can be useful for any confirmation of buy and sell signals, Stop Loss and Take Profit, Trend Filter (to visually understand if the trend is bullish or bearish)
A potentially effective trading strategy could involve identifying buy and sell signals near the extreme price level lines drawn by the indicator. This approach can be used to try to improve the accuracy of your trading signals and make more informed decisions. For example:
When you receive a buy or sell signal based on the dojis and rectangles generated by the indicator, check whether the price is also near one of the extreme price level lines. If you are receiving a buy signal and notice that the current price is near a low of the lower level line, this may further confirm the buying opportunity, as the price is near a significant resistance level. On the contrary, if the sell signal was close to a maximum price level it could confirm an excellent short entry.
It is also possible to use the boxes as reference points to set the stop loss and take profit levels. If you are entering a buy position, you might consider setting your stop loss just below an upper line of the last box. Additionally, you may want to set your take profit near a higher price level if you are looking to maximize profits. This will help manage risks and protect your capital.

Zaree - Bull & Bear Volume VoidThe "Zaree - Bull & Bear Volume Void" (BBVV) indicator is a versatile tool designed to help traders assess the dynamics of bull and bear power in the market, with a focus on volume-based analysis. This indicator offers a range of features that aid in identifying potential shifts in market sentiment and strength.
Details of the Indicator:
Volume Void Color Settings: This indicator allows you to customize the colors used for different conditions, such as strong bull areas, slowing bull areas, strong bear areas, and slowing bear areas. These colors play a crucial role in visualizing the indicator's output.
Volume Void Settings: The BBVV indicator provides options for selecting specific volume void functions, which include "Relative Volume Comparison," "Percentage of Average Volume," "Fixed Volume Threshold," "Volatility-Adjusted Volume," "Compare to Previous Volume Bars," "Volume Percentile Rank," and "Market Session Comparison." Each function has its own criteria for evaluating volume conditions.
Void Bull Sensitivity and Void Bear Sensitivity: These are key parameters in the settings. The values you choose for void bull sensitivity and void bear sensitivity will significantly impact the background color displayed by the indicator. Properly configuring these values is crucial for the indicator's effectiveness.
Moving Average Settings: You can specify the source and length of moving averages used in the indicator. This helps in smoothing out data and providing a clearer picture of bull and bear power.
Void Color Background Conditions: The indicator dynamically changes the background color of the chart based on the current market conditions. It takes into account bull and bear power, as well as the configured sensitivity levels to determine whether the market is in a strong or slowing bull/bear phase.
MACD and Signal Lines: The indicator also displays MACD and signal lines on the chart, helping traders identify potential bullish and bearish crossovers.
Histogram Bars: Histogram bars are used to represent the strength of bull and bear power. Above-zero bars indicate bullish strength, while below-zero bars indicate bearish strength.
How to Use the Indicator:
Begin by customizing the color settings for different market conditions to your preference.
Select a volume void function that aligns with your trading strategy and objectives.
Configure the void bull sensitivity and void bear sensitivity values carefully. These values should reflect your desired sensitivity to volume conditions.
Choose the source and length of moving averages based on your analysis requirements.
Pay attention to the background color of the chart. It will change dynamically based on the current market conditions, providing insights into the strength of bull and bear power.
Observe the MACD and signal lines for potential bullish or bearish crossovers, which can be used as additional confirmation signals.
Interpret the histogram bars to gauge the strength of bull and bear power.
Example of Usage:
As a swing trader with a focus on volume analysis, you can use the BBVV indicator to enhance your trading decisions. Here's an example of how you might use the indicator:
Select "Relative Volume Comparison" as the volume void function to assess volume relative to a simple moving average.
Configure void bull sensitivity and void bear sensitivity to match your risk tolerance and trading style.
Choose "SMA" as the moving average type with a suitable length.
Pay attention to the background color changes in the chart. Strong bull areas may indicate potential bullish opportunities, while strong bear areas may signal bearish conditions.
Monitor the MACD and signal lines for potential crossovers, aligning them with the background color to validate your trading decisions.
Use the histogram bars to assess the strength of bull and bear power, helping you gauge market sentiment.
Remember that the BBVV indicator is a valuable tool to complement your trading strategy. It provides insights into volume dynamics and market conditions, allowing you to make informed trading choices.
Be sure to adjust the indicator settings according to your trading preferences and always consider the broader market context in your analysis.

Price Strength Index + RSI Buy/Sell ZonesThe Price Strength Index + RSI Buy/Sell Zones indicator is a technical analysis tool designed to evaluate the strength of a financial asset's price movement by comparing it with a series of Volume Weighted Moving Averages (VWMAs) of different lengths calculated from historical data.
Hypothesis :
The core hypothesis behind this indicator is that assessing the relationship between the current price and a range of VWMAs with varying lengths can provide valuable insights into the strength and direction of a price trend. Additionally, it incorporates Relative Strength Index (RSI) conditions to further refine potential buy and sell signals.
How It Works :
Multiple VWMA Calculation: The indicator calculates multiple VWMAs, each with a different length, using historical price data and volume. These VWMAs represent weighted moving averages over various periods, helping to capture different aspects of the price trend.
Comparison with Current Price : For each of these VWMAs, the indicator compares the current bar's price with the VWMA value. This comparison is crucial in understanding how the current price relates to historical averages, shedding light on the strength and direction of the prevailing trend.
SMA of Percentage Above VWMA : The indicator calculates the Simple Moving Average (SMA) of the percentage of prices above the various VWMAs over a specified period. This moving average smoothens out the percentage data, providing a clearer trend signal.
Buy and Sell Zones : User-defined upper and lower thresholds for the percentage of prices above the VWMAs are used to define buy and sell zones. When the percentage falls below the lower threshold, it signals a potential buy zone, suggesting a weakening trend. Conversely, when it exceeds the upper threshold, it signifies a potential sell zone, indicating a strengthening trend.
RSI Integration : The RSI is calculated for the selected price source with a specified length. When the SMA of the percentage above VWMAs falls within the buy zone and the RSI is below the lower RSI threshold, it indicates an oversold condition, potentially signaling a buy opportunity. Conversely, when the SMA falls within the sell zone and the RSI is above the upper RSI threshold, it suggests an overbought condition, possibly signaling a sell opportunity.
Color Coding : The indicator employs color-coding to visually represent the buy and sell zones, as well as extreme RSI conditions. Green color denotes the buy zone, red represents the sell zone, and orange lines indicate the median and potential reversal points.
In summary, the Price Strength Index + RSI Buy/Sell Zones indicator leverages multiple VWMAs of different lengths to assess the relationship between current prices and historical moving averages. This comprehensive analysis, coupled with RSI conditions, aids traders in identifying potential buy and sell zones, as well as extreme RSI points within those zones, enhancing the evaluation of price strength and potential trend reversals.

TrapZone ProThis script combines the concepts of Price Action, Trend and Momentum to identify Price Zones (Red and Green filled areas) and Price Bars (Red, Green and Gray) where traders can get trapped in the Market.
It will clearly mark the bars which favor the prevailing Trend and those bars which just don't have the momentum anymore. TrapZone moves with the market trend and will often provide it support. As the TrapZone changes direction & its color, traders can change their trade bias.
Features:
Identify strong & weak price action - By leveraging a regression calculation of price movement on Y axis against the x axis, we identify the strength of current bars. Increasing relative strength of bars indicate Bullish (Green Bars) & Bearish (Red Bars) price movement, respectively. As the relative strength starts to decrease in Bullish or Bearish price action, the indicator immediately changes the color of these bars to Gray (by default). We call these TrapBars .
Current price trend - By using the highs and lows of price in multiple periods, we are calculating the trend of the price. The Bullish trend is shown by the Green zone and Bearish trend is shown by the Red zone. These zones are the shaded areas which are plotted on the chart. If the price is in these Zones, Longs or Short trades are not advised as that price action is weak. We call these TrapZones .
Strength of the Momentum - the thickness of the TrapZone shows the strength of the current Bullish or Bearish trend. That means the wider the shaded area grows the stronger is the current market momentum. A Flat TrapZone indicates sideways price action.
Knowing when NOT to Trade is as important as when to Trade. While this indicator is designed to avoid taking bad trades such as FOMO, Catching a Falling Knife or Fighting The Trend , it successfully reveals the good trade setups!
How these features of this indicator helps Traders avoids common mistakes:
FOMO or Fear of Missing Out - If a Trader Sees TrapBars in a Bullish or Bearish Trend, they will avoid entry as the price action is weak at that time. This will avoid late entries.
Catching a Falling Knife (a.k.a. Picking a Bottom) - When Red TrapZone is being plotted, Traders can avoid taking Long Entries hoping for a price reversal.
Fighting The Trend (a.k.a Picking a Top) - When Green TrapZone is being plotted, Traders can avoid taking Short entries hoping for a price reversal.
TrapZone Pro does all this in a single panel of the chart irrespective of the market or timeframe.
How to use TrapZone Pro indicator for trading [
A. Market Analysis
Green TrapZone is Bullish and traders should not take Shorts. If Green TrapZone is moving higher, Market is Strong
Red TrapZone is Bearish and traders should not take Longs. If Red TrapZone is moving Lower, Market is Strong
No trades when TrapBars are forming
No trades inside the TrapZone
B. Trade Guidance System
Establish Market Bias - Bullish or Bearish using the TrapZone Color
Only Enter Long in Long Color Bars i.e. Green by default
Only Enter Short in Short Color Bars i.e. Red by default
3 Classes of Trades are Possible Class A, B & C. A being the best Reward : Risk ratio and C being the least rewarding. So use trade size accordingly.
Class A - Best bars are always the first & Second, close to the TrapZone
Class B - Long Bar or Short Bar Forming after TrapBar away from the TrapZone in a Strong Market
Class C - Long Bar or Short Bar Forming after TrapBar close to the TrapZone in a Flat Market (identified by Flat TrapZone )
Take profits when Price moves away from the TrapZone & TrapBars start forming OR Your Target is hit !
See a few examples of Trade Classes & Entries/ Exits for a better understanding
Recommendations
Select Session to “Electronic Trading Hours” in chart settings so you can see the Post & Pre Market trading as well. You can change the color of these sessions to the same color as chart background, so it is not distracting.
Start by Trading in the Hourly or Daily time frame to get used to the new indicator and its Trade Guidance System .
Position Size is the best form of Risk Management. Have a fixed dollar loss per trade pre-determined and adjust the size based on market volatility.
Even though this indicator is designed to work on any market or timeframe, trade the markets that you are familiar with and timeframe that matches your lifestyle. Your understanding of the instrument's behavior and knowledge of what makes it move is valuable.
Basic Set-Up
Add the Indicator to the chart
Open Chart Settings and in Symbol Section
Switch off “ Borders ”
Switch off “ Wick ” or Change the colors to a same non-distracting color like Black or Gray
Open TrapZone Pro Settings
Set the colors for the “ Long Bars ”, “ Short Bars ” & “ No Entry Bars ” if you wish to change the default colors
Change “ TrapZone ” colors to your Taste or leave the defaults
Green for “Color 0” that represents Bullish Price Action
Red for “Color 1” that represents Bearish Price Action
Important Advice & Disclaimer: This indicator does not guarantee that you will make money. It is a tool that performs market analysis for you and presents it in a easy to consume fashion. Markets are truly random and can change direction on a dime. You must use prudent risk and money management strategy based on your investor profile, investment objectives and risk appetite.
To Get Access - See Author’s instructions below
