40+ Coin Screener (workaround to 40 Security Limit Per Script) This is a far inferior method for a screener/scanner (compared to my first publication) but after looking at that script from a noobs eyes again, I could see how this form would be a lot easier to take in/understand so wanted to publish it. Everything that I could think of to mention about this is in my 1st pub so ill leave it to you to check it out...though I did include some comments in the script. It is pretty straight forward but if you have any questions don't hold them in. I'll answer them if I can. The only thing that is not in this one is setting up the alert feature so that you only have to create 1 alert per iteration of the script and it takes care of all of the coins for that iteration/set that is chosen in the settings (so please see previous script if would like to do this for your screener/scanner).
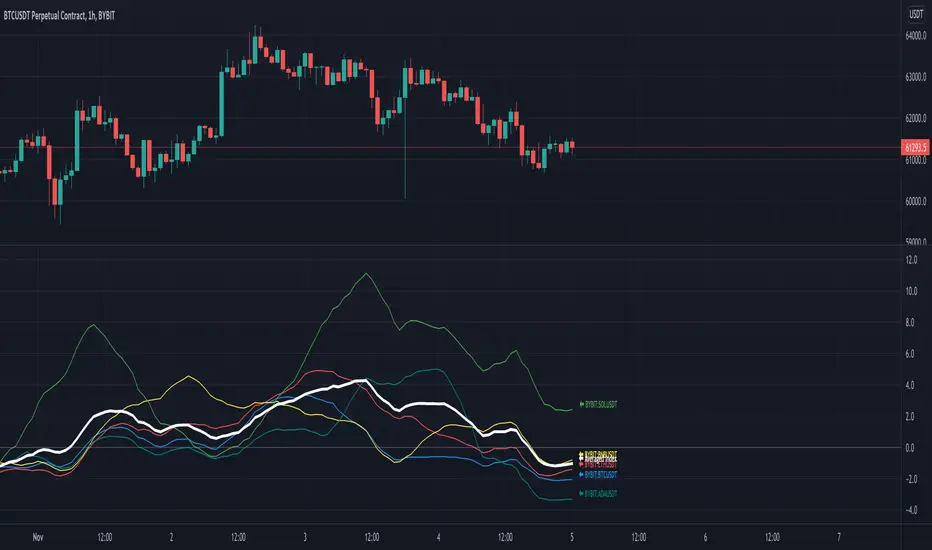
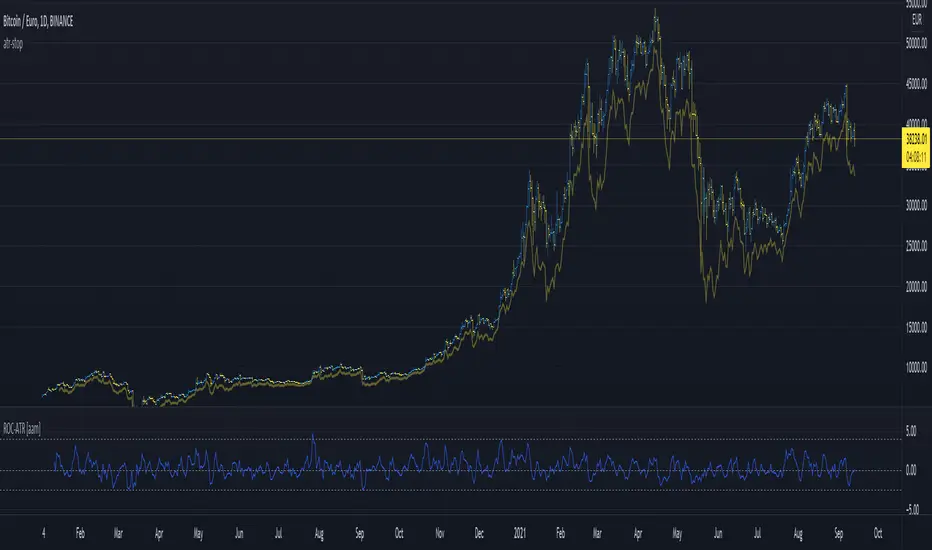
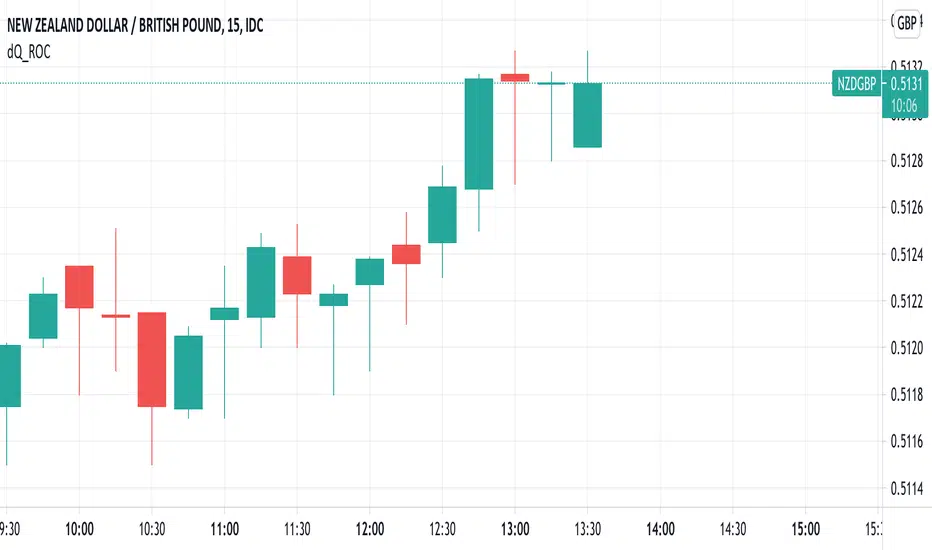
To be PERFECTLY CLEAR, the workaround is to the issue of not being able to scan but only 40 coins per script. You can scan more than 40 per script but only if you create "batches" or "sets" that the user can select within the settings which set to use for each iteration of the script on the chart. That being, you have to the script multiple times to the chart and merge them into 1 window and merge the scales (instructions in first publications). Here in this script I am scanning 72 different coins that are the Margin Coins on KUCOIN. I have split them up into 3 sets (24 coins per set). I could have made 2 sets but the script will be slower to load and to respond (like, when it comes to receiving alerts), thus I split them up the way I did. If you want to change any of this there are slightly more details in the previous script.
One great use-case that I LOVE about this particular version (and the way I use it) is right at the end of when I see a whole market dump/pump coming to an end and want to know which horse to bet on. Used to think whichever coin come out the fastest from the dump was the one to bet on but quickly learned that 1-2 (or even a few) hrs needs to go by first bc the ones that look the strongest in the beginning are NOT the ones to have performed the best when viewing the results 12 hrs later. IN FACT, many instances of using this exact script for reasons as such has taught me that the manipulators (I believe this to be the case as least) WANT everyone to bet on these that come out the gate the hardest and thus they make them move REALLY hard in the beginning then they QUICKLY become stagnant (moreso, they become WORSE than stagnant, they actually quickly retrace to put you into the negative so that you get out to get into the others now moving (to provide the market with more liquidity. They WANT you to get into a coin thats moving crazy hard so that they can then cease that movement once many fall for the trick just to then make that once strong looking coin now stagnant and make others move crazy hard. They wait for you to get out of the 1st and into the next set of movers just to do this time and time again bc hey, what are we sheep good for other than to provide the big guns with liquidity, am I right? Thats rhetorical, which you would know if you've ever had this happen to you (without a doubt MANY of you have). Let this script (above all other things) provide good evidence to back up this cynical way of viewing the markets to anyone that is questioning it.
This prolonged time between when the dump is over and when the ACTUAL movers REALLY start moving can actually be of great benefit to us sheep if used correctly, Firstly, it gives us some time to determine if when we thought was the bottom, ACTUALLY was the bottom. That bottom is easily determined if there are no (or very few) coins that went any lower than the point in time that the script began calculating on. Secondly, it allows us time to wait for the REAL movers and shakers to start moving and shaking.
One new feature that I LOVE that TV has implemented is the ability (once the script is added to the chart) to be able to click a point in time on the chart where you want the script to begin its calculations. If this point needs to be changed at any point in time then you can either go into the setting and input the time you wish or simply remove the script and add it again so that you are prompted to select another point in time. Ok, I think that everything I wanted to say. The next version that I will add will be probably my favorite and most used by yours truly...not to mention unique in a way that I have yet to see an implementation anything like it in all of TV's public library. Not to say its not there, but I have yet to come across it and I have DEFINITELY done my fair share of searching for it when I couldn't figure out how to code it for the longest time (though, I was and still am a noob so might get some great feedback on better ways to approach it, but we'll save that jabbering for the next of the publications.
I hope each and every one of ya'll (yes, Im from the South) have the GREATEST of Thanksgivings (if in the US that is...I graced my parents with the best gift anyone could have given them 35 years ago on Thanksgiving....MEEEE ;) So I will sure as hell be having a great holiday. Thanks for checking out my script...you can "like" and leave a comment if you so feel the urge to...or not. Im not doing this for me, but rather to stretch my arms out as far as possible to benefit the most people as possible and more people would see the script if it has more likes/comments/traffic pointing towards it...not to mention as other publishers have...it IS gratifying to see a few likes in my side window, which btw, I have MANY more variations and completely diff types of scanners/screeners Ill be publishing in the future and to know that they've become of use....I"VE become of use to the community is very....pleasing to me and does (as I've also seen many publishers mention as well) drive me to want to publish ones that I originally thought I would keep for myself. Peace out people.
レート・オブ・チェンジ (ROC)

Scanner/Screener of Over 40 Coins Per Script I am very scatter-brained by nature and sporadic in my thought processes but if these benefit the community and ya'll ask for more perhaps I will get better and even out a tad....probably not....but you never know. Firstly, allow me to apologize to all the vet/more sophisticated coders out there whose eyes and brains might just be overly taxed due to my poor coding structure. Im just getting started for the first time in ANY sort of coding...so cut me a little slack. Also, if anyone sees any mistakes or the functionality is not as I proclaimed, PLEASE do let me know. In these past 12mo of me learning my 1st coding language (Pinescript) I would say that I have been intently focused on creating all types/sorts of scanners/screeners. Ive always hoped to be a benefit to the community as I was always SO grateful to those who have come before me that have led me to the little bit of progress I have made with Pinescript. This script is not necessarily something that should be traded with as it is just a thrown together example showing a scanner/screener whose results produce plot outputs (ie, Rate of Change / oscillators as well / etc) and how they can be used in the alert system so that only 1 alert has to be set per iteration of the script but more importantly how to use/scan/screen with over 40 coins per script. My intent is not to trick anyone here. So to be PERFECTLY CLEAR, more than 40 coins CAN in fact be screened/scanned from one script (here I am doing all of KUCOIN's Margin Coins...72 total I look at)...BUT...(heres the catch) it must be added to the chart however many times EQUAL to the amount of "sets" you have in your script. (Heres the limitation by TV) There cannot be more than 40 coins in each "set". The less coins you have per set, the quicker the script will startup and run, thus, the quicker alerts will be received if automating the process. Though, if you only have the free plan and can only have MAX 3 indicators per chart then the MAX you can screen at a time is 120 coins if you use 40 coins per set. So, this is the first one I would like to introduce. For this one your screener/scanner must be using some sort of plots as output that is being screened for. (original inspiration of ALL my variations mainly come from @QuantNomad, @daveatt, and @LonesomeTheBlue (and a few others I may be forgetting at the moment). Thanks for the inspiration through countless publications that ya'll have created for us in the community.
Some of my variations are more complex/elegant than others but there are MANY very different ones that I would like to share with the community. If you leave a comment and wonder why I have not responded but did so to every comment around yours...see if you are one of the individuals in this next few sentences...and if you are then perhaps someone else would like to waste their time responding to your comment...but basically, if you don't want to spend the time helping yourself by reading the title, description section, AND the comments section (at least scanning them) then I am MOST DEFINITELY not going to help you down your path of destruction that is most likely soon to be your blown-up trading account. I was called a "masochist" after asking for guidance on if its worth the headache to publish anything on TV bc there will NO DOUBT be comments that'll make me wish I didn't (ie. someone CLEARLY not reading the description (or seemingly even the title sometimes) bc they make a comment that has been explicitly addressed, or someone asking to rebuild the code compatible for another charting software or whatnot, or how about those asking if it repaints (this one is almost always addressed in the comments section but I can understand this question more than others as Im only 1 yr into learning any sort of coding for the first time in the beginning I saw people ask on EVERY script about if it repainted and it was worrisome at the lest (esp bc I didn't even understand what it was not so long ago, or my favorite...what TF it works best on...these people CLEARLY need not be trading yet if your still asking questions as such...Ill end it there). Point being, Ive got some truly VERY useful scripts that I want to share and as long as these people don't make me regret doing so in the beginning, then whats mine...will soon be yours. Though, I will take a little time between the releases.
YOU GUYS (TV and its community) ARE AWESOME (most of you anyways ;)
MUCH LOVE,
ChasinAlts
(1) INPUTS
Here is where the "sets" come in. I am looking at all of KUCOIN's Margin Coins (72 of them at least) so am splitting them up into 3 sets/iterations and a copy of the script must be added equal to amount of "sets" you have here. This is the ONLY workaround I have found to be able to scan/screen with more than 40 coins per script (due to TV's limitation of 40 Security Calls per script) ***So for everyone saying it's impossible scan more than 40 Coins per scipt...it' MOST DEFINITELY possible....BUT ONLY by adding this script multiple times on the chart and selecting 1 of each of the "sets" in the script settings via the chart window. To save the much needed room you must push each iteration of the script into 1 window and merging the scales of each into 1 scale(ie. "Scale A") within the settings of the script name on the chart(3 horizontal dots)
(2) FUNCTION
(2.1) COLORIDs
This is just to set up all my Colors of plots which are being matched with their respective labels. I have a diff color for each of the 72 coins Im plotting so Im telling the function, "depending on which set of coins I select...give me this color out of the colors I input later into the function"
(2.2) TICKERID CONSTRUCTION
I construct the tickerID this way so that the labels on my plots have only the Coin's name vs the label having the (Exchange Name):(Coin Name)(Base Pair Name). If you are using more than 1 Base pair (ie. XRP/BTC and XRP/USDT and XRP/ETH) OR more than 1 Exchange OR want your plots to show MORE THAN just the Trading Coin's name, then the tickerID MUST BE constructed differently
(2.3) SECURITY CALL & PLOT OUTPUT VARIABLES
If using a Higher Time Frame in Security Call then it MUST BE adjusted to permit or dissallow repainting if you so wish (BEYOND THE SCOPE OF THIS PUBLICATION so Do Your Own Researh). If your MAIN LOGIC is more complex than simply using a TV built-in function), THEN it MUST BE built into its own function outside of this function and called on within the "expression" slot of this Security Call OR can also be built into this function and called on in the "expression" slot of this Security call (BEYOND THE SCOPE OF THIS PUB SO DYOR). FURTHERMORE...when you are using a series(ie high/low/close/open/hl2/etc) / bar_index / time / etc that will be specific to the Coin/tickerID, then they MUST BE explicitly used within the "expression" slot of the Security Function when calling on your Main Logic or else it will pull the series/time/bar_index/etc from the Coin that the Chart is presently on (BEYOND THE SCOPE OF THIS PUB SO DYOR)
(2.4) PLOT LABEL
This is the Plot's Label that will be next to the end of the plot on the LAST bar_index. ***Notice in the "text" slot of the label I have "_coin" (without the quotes obviously)...this is where have JUST the Coin's name comes into effect on the label vs the (Exchange Name):(Coin Name)(Base Pair Name) which looks MUCH cleaner
(2.5) ALERT LOGIC / ALERT LABEL
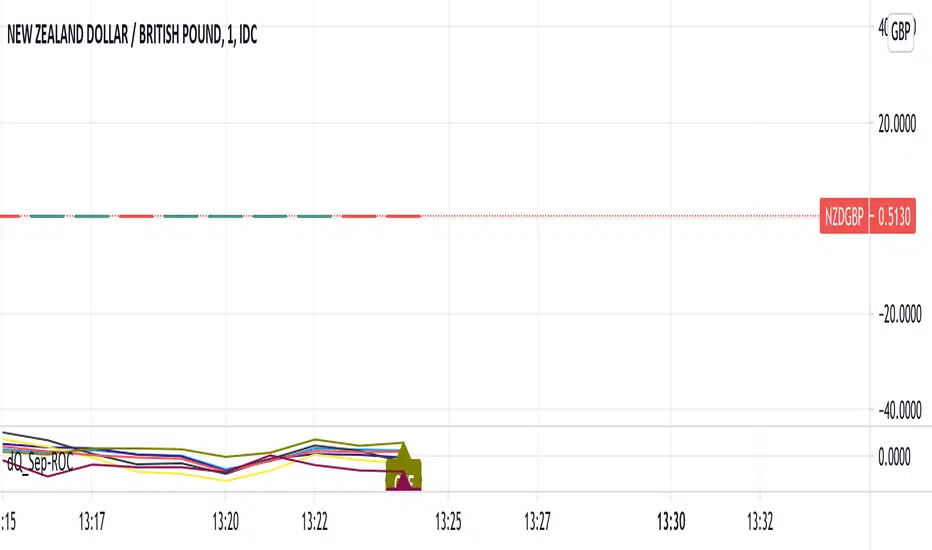
Your alert logic need not be as complex as this... I just wanted to create a decent enough timing for this system and wanted to simply print the labels displaying which coin produced the alert at the same time the alerts would go off. Alert is set up to Trigger Bullish when the ROC is below the Threshold and _chg > _chg X=length of bars inputted in "Rising/Falling Length" setting and vise versa for Bearish Alerts. If _chg plot only goes past threshold for a VERY few amount of bars NOT providing enough time for initial Alert to trigger, then alert/label triggers on crossing of threshold back towards 0(zero). ONLY 1 alert needs to be set per script to be able to scan ALL 72 of the coins as I have them in this script. Timing of Alert is inline with the name label printed past the thresholds.
(3) VARIABLES FROM MAIN FUNCTION
This is the tuple of the Main Function that outputs the variables from 3 lines up to be able to plot the lines and color them according to the colors on the labels. *** As of now, we CANNOT plot from within the function so MUST BE done this way to produce the variables and colors needed. The plots are the ONLY thing in this script that cannot be executed from within the function
(4) LINE PLOTS
ALL output variables from our Main Function are used here for the line plots

Multi-period ROCTHe indicator is backtested for the default periods -10 (short), 21(medium) and 45(long). These parameters can be changed using the settings as per your preference.
The indicator allows you to plot three ROC on multiple periods.
Why use this indicator?
A trend is confirmed when its identified as a trend across multiple timeframes or multiple periods.
As all default ROC (10, 21, 45) cross above zero, it marks the beginning of an uptrend. The indicator is backtested on daily timeframe.
Combine your existing bullish strategies with this indicator shall yield improved accuracy as you'd have trend confirmation. Go long only when the ROC is above 0 levels across short, medium and long term periods.
The indicator is inspired by teachings from Mr. Bharat Jhunjhunwala (Founder of ProRSI)

SROC Crypto Index [upslidedown]The idea for this indicator is simple: Without a crypto index we want to somehow understand ROC across many assets. This will average out data across the top 5 (current) cryptos and provide a benchmark index.
I've recently been looking into momentum strategies more and how to utilize ROC as part of crypto trading. This indicator was born to fill a void as there is no great index like SPY for the crypto world.
Why would you do this? This gives a picture of overall market sentiment and allows you to move stock strategies that use an index to do things like tighten SL, take positions, move to cash, etc. into the cryptocurrency market.
The plotted line is super fat so you can plot individual lines and tell the index from the individual ticker apart. My suggestion is to pair this with a ROC or SROC for individual assets and to develop strategies from there.
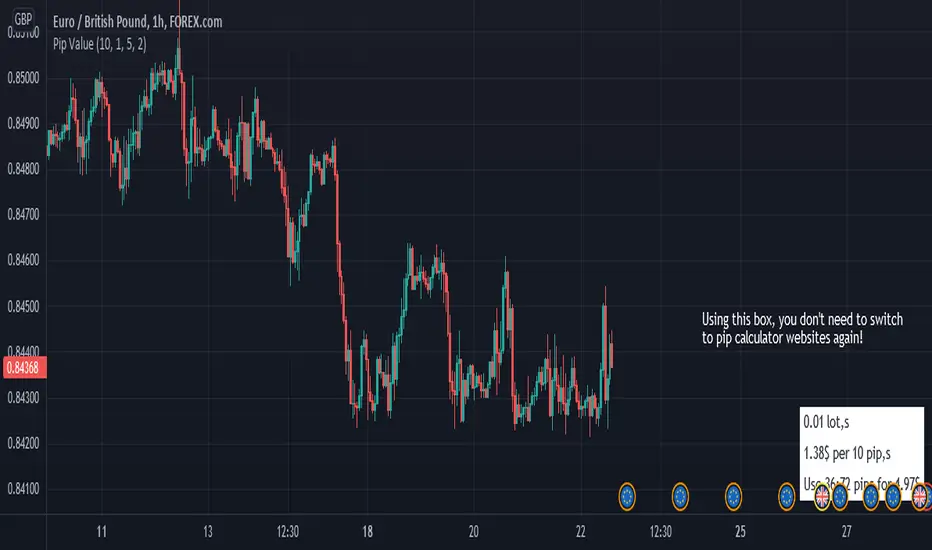
Pip ValueThis simple tool helps you manage your risk by calculating the exact price for pips.
it only works for forex pairs.
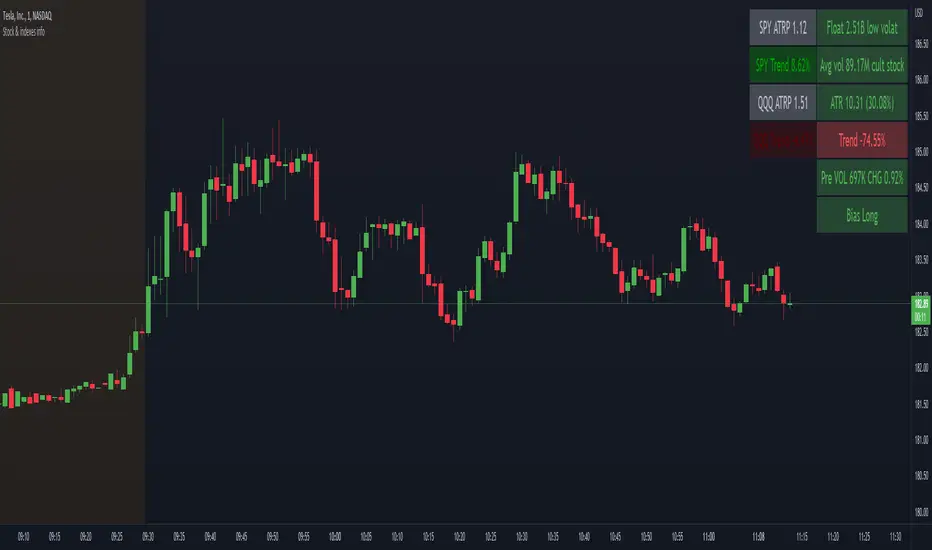
Stock float, avg volume, pre-market info and indexes atrp, trendNASDAQ:AAPL
This indicator shows the most usefull informations about the current symbol and the two common indexes (SPY and QQQ) in a table, in the upper right corner of the graph.
The informations are:
Symbol
Float
Daily average volume
Average True Range
Pre-market volume
Pre-market change %
Indexes
SPY ATRP
SPY trend (this value indicates how much the symbol is changing from the last X bars of Y minues. Higher values means a stronger trend)
QQQ ATRP
QQQ trend (same as SPY trend)
The indicator is highly customizable. Here are some of the settings:
Compact view
Text size
Every information is hidable
Most of the informations have customizable warning
Background color with thresholds
Period/lenght of the indicators
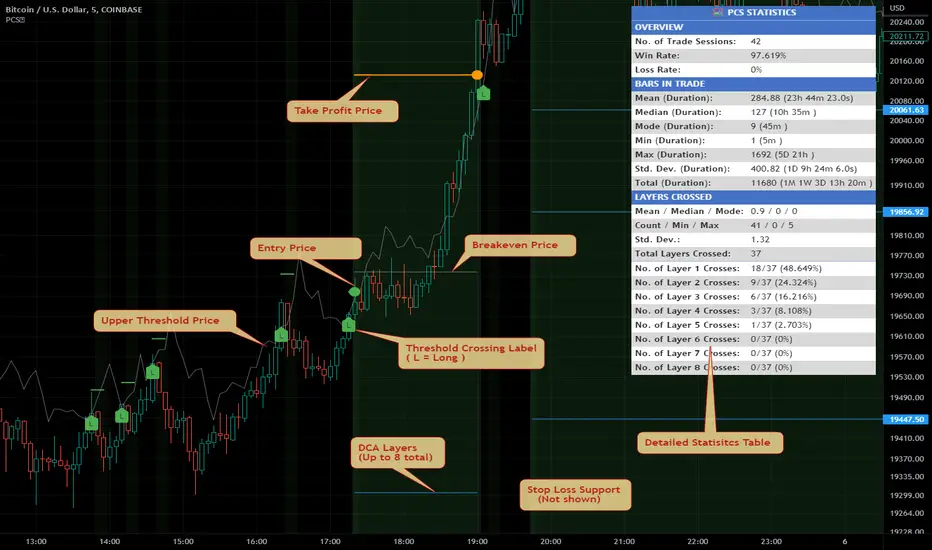
Price Change Scalping Indicator v1.0 - 3Commas EditionIntroduction
This indicator implements the Price Change Scalping (PCS) strategy specifically for the 3Commas platform. The Input settings have been redesigned to match the same inputs as the 3Commas My Bot Settings page. Only the "Deal Start Condition" section will echo the required PCS-related settings found in the original Price Change Scalping Indicator v1.0 to successfully implement the strategy.
The indicator uses a price rate of change (ROC) momentum calculation to determine the percent change in price between a defined range of bars. The calculated ROC value is then compared to the Upper Threshold and Lower Threshold values to determine if a trade setup is to be activated. If the threshold is crossed, a trade setup will occur based on the indicator settings. Entry, Take Profit, and Stop Loss prices are calculated and displayed on the chart. Once the Entry Price is crossed, a long or short position is created (depending on the direction) and once the Take Profit price is crossed, the position is closed. If the Entry Price is not crossed within a specific number of bars, the trade setup is canceled, and it will proceed to monitor price changes for the next set up.
How is it original and useful?
This indicator is unique in that the strategy version fully supports the TradingView backtester, which will enable you to perform experiments with various settings to evaluate performance using the historical chart data. The study version implements the "Start Deal" and "Close Deal" alerts for you to integrate with 3Comma's "Trading View Custom Signal" start condition. Both script versions will provide the same configuration abilities. The following list is a brief description of its usefulness:
Full support for all possible 3Commas bot settings.
Define a short or long trading strategy.
Price change data source and offset settings.
Your layering placement relative to the entry price.
Your trading parameters like take profit and stop loss offsets, trailing take profit support, exchange commission rates, trading start time, and order size multiplication for each layer.
Flexible trade eligibility rules that can use other chart indicators, like RSI or EMA, to exclude the selection of entry prices for trading.
The visibility of detailed statistics from the chart history pertaining to trading sessions started and closed, session durations, win rate, price action drops and bounces, as well as layer utilization.
The visibility of detailed Used Amount for Each Step table that details how each layer will be allocated for trading.
How does it compare to other scripts in the Public Library?
The indicator offers a very detailed, comprehensive settings to address all types of markets found on TradingView where you can implement the price change scalping strategy. The strategy version can be considered the first of its kind on TradingView to leverage the backtester to provide informative, detailed performance measurements surrounding this unique trading strategy. The study version will implement the latest alert framework called "Any Alert() Function" where you can create a single alert to handle multiple events, which include:
Deal Start
Deal Close
Strategy Results
The default settings are designed to define a "loose" price change settings to ensure that the indicator will render chart elements when first loaded as well as to allow the backtester to gather order executions and display performance summary. The strategy version is using $10,000 initial capital, a commission rate of 0.1% for both entries and exits, and a 1 tick slippage setting. It is also using 3.4881% of the equity for the Base Order Size, 4.7097% of equity for the first Safety Order Size. The Maximum Safety Trade Count is 7 with a Safety Order Volume Scale of 1.33, and a take profit of 2% with no stop loss. All other settings are defaults.
It is recommended that the indicator be "tuned" for your specific market to best implement the price change strategy and obtain better desirable results. You do so by scrolling through the chart's history and observing moments when prices tend to move rapidly. Measure the number or bars it typically takes for the price to change at a specific rate. Using this information, you can adjust the Price Change Settings accordingly to configure the indicator for the chart.
Always keep in mind that past performance may not be indicative of future results. Settings that seem favorable for one market may be found to be disastrous in another. Therefore, do take the time needed to understand how the settings will behave with the given chart symbol.
Enjoy! 😊👍
How to obtain access to the script?
You have two choices:
Use the "Website" link below to obtain access to this indicator, or
Send us a private message (PM) in TradingView itself.

Price Change Scalping Indicator v1.0Introduction
This indicator uses a price rate of change (ROC) momentum calculation to determine the percent change in price between a defined range of bars. The calculated ROC value is then compared to the Upper Threshold and Lower Threshold values to determine if a trade setup is to be activated. If the threshold is crossed, a trade setup will occur based on the indicator settings. Entry, Take Profit, and Stop Loss prices are calculated and displayed on the chart. Once the Entry Price is crossed, a long or short position is created (depending on the direction) and once the Take Profit price is crossed, the position is closed. If the Entry Price is not crossed within a specific number of bars, the trade setup is canceled, and it will proceed to monitor price changes for the next set up.
How is it original and useful?
This indicator is unique in that the strategy version fully supports the TradingView backtester, which will enable you to perform experiments with various settings to evaluate performance using the historical chart data. The study version implements numerous custom alerts for you to build TradingView notifications around specific price action events and stay informed with market activity in real-time. Both script versions will provide the same configuration abilities where you can define:
Define a short or long trading strategy.
Price change data source and offset settings.
Your layering placement relative to the entry price.
Your trading parameters like take profit and stop loss offsets, exchange commission rates, trading start time, and order size multiplication for each layer.
Flexible trade eligibility rules that can use other chart indicators, like RSI or EMA, to exclude the selection of entry prices for trading.
The visibility of detailed statistics from the chart history pertaining to trading sessions started and closed, session durations, win rate, price action drops and bounces, as well as layer utilization.
How does it compare to other scripts in the Public Library?
The indicator offers a very detailed, comprehensive settings to address all types of markets found on TradingView where you can implement the price change scalping strategy. The strategy version can be considered the first of its kind on TradingView to leverage the backtester to provide informative, detailed performance measurements surrounding this unique trading strategy. The study version will contain numerous custom alerts to aid in your notification preferences and stay informed on the indicator's activities:
Price Crossed Above Threshold
Price Crossed Below Threshold
Enter Long Position
Exit Long Position
Enter Short Position
Exit Short Position
Price Crossed DCA Layer 1 (Long)
Price Crossed DCA Layer 2 (Long)
Price Crossed DCA Layer 3 (Long)
Price Crossed DCA Layer 4 (Long)
Price Crossed DCA Layer 5 (Long)
Price Crossed DCA Layer 6 (Long)
Price Crossed DCA Layer 7 (Long)
Price Crossed DCA Layer 8 (Long)
Price Crossed DCA Layer 1 (Short)
Price Crossed DCA Layer 2 (Short)
Price Crossed DCA Layer 3 (Short)
Price Crossed DCA Layer 4 (Short)
Price Crossed DCA Layer 5 (Short)
Price Crossed DCA Layer 6 (Short)
Price Crossed DCA Layer 7 (Short)
Price Crossed DCA Layer 8 (Short)
Strategy Results
The default settings are designed to define a "loose" price change settings to ensure that the indicator will render chart elements when first loaded as well as to allow the backtester to gather order executions and display performance summary. The strategy version is using $10,000 initial capital, a commission rate of 0.1% for both entries and exits, and a 1 tick slippage setting. It is also using 2.74506% of the equity with a Order Size Multiplier of 1.33, using 8 total DCA layers, and a take profit of 2% with no stop loss. All other settings are defaults.
It is recommended that the indicator be "tuned" for your specific market in order to best implement the price change strategy and obtain better desirable results. You do so by scrolling through the chart's history and observing moments when prices tend to move rapidly. Measure the number or bars it typcially takes for the price to change at a specific rate. Using this information, you can adjust the Price Change Settings accordingly to configure the indicator for the chart.
Always keep in mind that past performance may not be indicative of future results. Settings that seem favorable for one market may be found to be disastrous in another. Therefore, do take the time needed to understand how the settings will behave with the given chart symbol.
Enjoy! 😊👍
How to obtain access to the script?
You have two choices:
Use the "Website" link below to obtain access to this indicator, or
Send us a private message (PM) in TradingView itself.
Zendog Bar PercentageThis script will add text to bars showing the price change of the bar as a percentage, both for open/close and high/low.
It can be used together with Rate of Change to better get an idea of how the price moved at a previous point in time.
Script uses labels for text, as there is a maximum limit of 500 labels if you want to study price movement for a specific timeframe, you can limit the timeframe from the script settings. Keep in mind that labels are applied to the last 500 candles of any timeframe.
Script also displays statistics for max changes in the selected time period, for both green and red candles both as percentage and base currency absolute value.
Uses:
- Study the behavior of an asset under previous market conditions, black swan events a.s.o.
- Calculate leverage position risk versus extreme price movements
Example: ZENUSDT pumped ~35% on 15 Sep 2021 in the first seconds after the news on getting listed on Coinbase so shorts with 3x leverage would have been liquidated.

Rate Of Change ATRThis is a very basic, but powerful script.
It gives you the ratio between the rate of change of the last x days and the average true range of the last y days.
---> ROC-ATR Ratio = ROC/ATR
Therefore, you can see how much the price has moved relative to the prices in the past.
This is important because (in my opinion) the basic ROC indicator is not very meaningful if you don't look at the average volatility of recent history.
For example, a ROC of 5% over the last 3 days might be very high for Forex but very small for some crypto.
Consequently, this indicator makes it possible to compare (and be used on) every instrument in every industry the same way.
Generally speaking, it makes more sense if the ATR length is larger than the ROC length.
Roc Mean Reversion (ValueRay)This Indicator shows the Absolute Rate of Change in correlation to its Moving Average.
Values over 3 (gray dotted line) can savely be considered as a breakout; values over 4.5 got a high mean-reverting chance (red dotted line).
This Indicator can be used in all timeframes, however, i recommend to use it <30m, when you want search for meaningful Mean-Reverting Signals.
Please like, share and subscribe. With your love, im encouraged to write and publish more Indicators.

+ Rate of Change (and OBV)The Rate of Change, or RoC, is a momentum indicator that measures the percentage change in price between the current period and the price n periods ago. It oscillates above and below a zeroline, basically showing positive or negative momentum. I applied the OBV's calculation to it, but without the inclusion of volume (also added a lookback period) to see what would happen.
Actually what happened was I was looking at hot-rodding the OBV indicator, but then wondered if I could apply the cumulative calculation to another indicator to see what would happen. Not sure why I chose the Rate of Change, but it seemed a neat idea. And it worked! And so I called it the "Cumulative Rate of Change." I only recently realized that this is actually just the OBV without volume, HOWEVER the OBV does not have a lookback period, and its source is the close of each period. Basically, when you look at the calculation for the OBV you'll notice that it's a cumulative measure of the "change" of the closing price against the previous close times the volume. The Rate of Change is basically that measurement over more than one period, excluding the volume, and is not cumulative. Thus the "Cumulative Rate of Change" is basically an OBV without the volume but with the capability to adjust the lookback period.
Anyway, after days and weeks of playing with the indicator pretty infrequently I did decide that I actually really liked it, especially with the addition of moving averages and bollinger bands. So I decided to play with it a bit more.
I added a drop-down menu to include the standard Rate of Change indicator, and then thought I may as well add the OBV too, in case someone might like to compare that to the C-RoC, or just wants an OBV with myriad moving averages and bollinger bands.
By default I have the indicator set to the "C-RoC" and the lookback is set to 1, but play with longer settings (this is pretty much necessary if using the traditional RoC, which is by default set to 10 in TradingView, and is nigh on useless at 1).
I also recommend playing with the source. 'Close' is nice, but 'ohlc4' provides some very nice signals as well, as it follows the price flow for each period completely, filtering the noisiness of 'close' as source.
Hope you guys like this. With the bollinger bands and your preferred moving average settings this can be a powerful tool for re-entering trades in trend, taking profits, determining momentum swings.
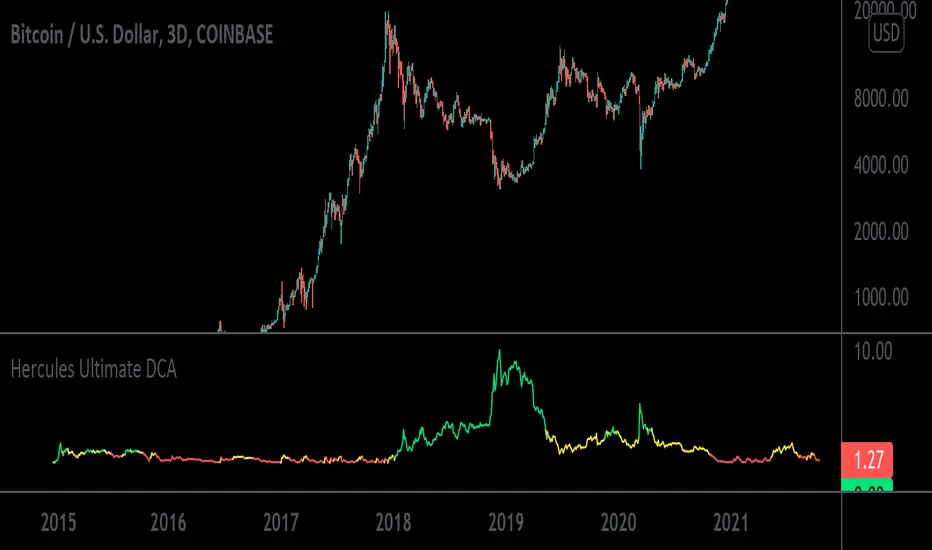
Hercules Ultimate DCA™The Problem Most People Face When Trading & Investing:
If anyone tells you they know where the market is going, they’re either lying or they’re time travelers.
The truth is NOBODY knows whether the markets will move up or down tomorrow, next week, next year, or over any period of time.
If we all knew, we’d all be rich. What would suit most Investors is to Invest consistently over long periods of time into sound financial products.
When Creating This Investing Tool We Had 5 Requirements in Mind:
1. To create a tool that ANYONE with little to no experience could use to outperform 95% of traders and speculators.
2. To ignore the Charts, Candlesticks, Indicators, and Volatility in any market so you can rest easy at night, never having to look at the price of your asset and still remain profitable.
3. To create a tool that tells you exactly HOW MUCH to invest every day or week which takes the stress away in guessing which direction the market will go.
3. To minimize your risk and and exposure to downside even if you started buying a crypto at or near the top of a market.
4. To buy a crypto at or near the bottom of every single major swing or trend.
5. To make Investing Easy, Simple, and Fun for the average joe.
We achieved that goal with the Hercules Ultimate DCA™ Tool!
WHO Created it & HOW was it Created?
This tool uses complex math and an algorithm designed by a Quantitative Military Mathematician (who wishes to remain anonymous, so we’ll call him Satoshi) over a period of 5 and a half months.
To start, we wanted to keep things simple, and extensively researched 6 of the top investing strategies of all time:
1. Buy and Hold
2. Active Investing
3. Dollar Cost Averaging
4. Index Investing
5. Growth Investing
6. Value Investing
Most of the strategies above work well depending on your goals or how risk adverse you are, however most DO NOT check off all of the requirements we mentioned above. Comprehensive home-work and price-action history in Cryptocurrency Markets led us to the Dollar Cost Averaging (DCA) Strategy.
According to Fidelity,
“Dollar Cost Averaging is a strategy where you invest your money in equal portions, at regular intervals, regardless of which direction the market or a particular investment is going. In other words, your purchases occur regardless of the changes in price for the stock or other investment, potentially helping reduce the impact of volatility on the overall purchase.”
With this in mind our High IQ math friend got to work and formulated over 17 Different Variable Algorithms on the DCA Strategy before arriving to the one we named Hercules Ultimate DCA™.
WHY the Hercules Ultimate DCA™ Works BETTER Than Anything Else.
Rigorous backtesting & forward-testing led us to create what we believe is the most effective and efficient strategy to extract the most money from the markets while at the same time minimizing nearly all the risk when investing your hard earned money in small increments in a truly effortless way.
The Hercules Ultimate DCA™ is essentially a DCA strategy put on steroids because no two investments are alike.
As we mentioned above, a traditional DCA approach assumes you purchase the same dollar amount of any asset at scheduled times, no matter where the price of your purchased asset is.
Example: If you have $1,000 dollars and decided to invest 50 dollars per week into Bitcoin, you would invest over a period of 20 weeks before you run out of money. Now, let’s assume the price of bitcoin is 50k during your first week, you would invest $50 dollars. Then next week the price rises to 60k, you would still invest $50 Dollars. The third week, if the Price of BTC rose to 70k, you would invest $50 dollars, so on and so forth. This approach is flawed because although you would still do better than many speculators and traders over a long period of time, it essentially leaves you penniless at the end of twenty weeks with no gunpowder left to buy BTC if it drops to all-time lows.
The Hercules Ultimate DCA™ works so well because it tells you to invest less as the price goes up and far more if the prices drops. What feels counterintuitive to most investors is typically what provides the most returns. Take the example above. If you have $1,000 dollars to invest weekly and Bitcoin currently sits at 50k, you would start by investing $50 dollars. Then next week, let’s say BTC rises to 60k, you would now invest $30 dollars. And your third week, BTC reaches 70k, you would now invest $10 dollars. Not only does strategy preserve your capital but it tells you to invest less into an asset at all time highs and far more into an asset at lows.
Now obviously the math in this tool is more complex, but it’s also more cost effective. At the time of writing this, the current Crypto Market has tanked from all-time-highs. Bitcoin currently sits at a price of $32,000 and is 51% down from its high of $64,900 dollars.
Just using this tool over the last 6 years, you would have invested a total of $5758.71 dollars and accumulated 4.328 Bitcoins for an average purchase of $1330.34 dollars. Your current Portfolio value would be $138,519.77 for a whopping percentage gain total of 2305%.
In other words, even with this massive crypto dump, you’d be rolling handsomely in your profits and you’d feel pretty smart too.
What’s more unique is that the Hercules Ultimate DCA™ will ALWAYS tell you to Invest More Dollars at the Literal Bottom of ANY market.
Dips in a market you believe in are far more exciting and will provide far more returns. The only way this tool fails is if the user (you) choose a market that goes to zero or is a rugpull.
How Do You Use the The Hercules Ultimate DCA™?
Step 1: Scroll to your “Invite-Only Scripts” in your indicators tab on Tradingview, then click on the indicator titled, “Hercules Ultimate DCA.”
Step 2: You should see the Indicator Populate at the Bottom of your chart with two lines, the Green line indicating how much you should buy that day, and the Blue line indicating how much of the asset you’ve purchased.
Step 3: (If you haven’t already) Make sure you turn on the Indicator Label. Navigate to the top right of the Crypto Product you would like to purchase and you will see a small settings gear. Once open, navigate on the left-hand side to the “Scales” tab and find the “Indicator Last Value Label.” Make sure it’s turned on and you will see the direct price.
Step 4: The amount you invest will now populate on the right hand side of the indicator with a number. That’s the exact dollar amount you invest in a disciplined manner no matter how large or small the number may seem.
Step 5: Get familiar with the indicator by opening the settings on the indicator itself. You will notice on the first tab it has a multiplier. If you increase it to 2, then the indicator will tell you to invest double the amount. If you input 10, then it will tell you to invest 10x the amount.
Step 6: Choose a Chart Timeframe and time of day to invest. If you choose to go with a once weekly investment then we recommend you increase your multiplier. If you choose a daily investment (and lack the necessary capital to invest large amounts daily) then we recommend keeping your multiplier down to lower numbers incase we see a lot of volatility. For most folks, once weekly on a 10x multiplier is most convenient. Set your chart to a weekly time-frame and increase your multiplier to 10. Then each week around the same time, you must invest.
Step 7: STAY DISCIPLINED. This method and tool only works if you invest the exact amount it tells you to invest over sustained periods of time.
Step 8: Enjoy Investing Made Easy 🙂
MA+ ROC MTF DashboardThis is a Multi Timeframe moving average ROC (percent of change) dashboard.
This dashboard shows percent of change of current price to a moving averages on different time frames.
Most left value in the dashboard always represents your chart time frame, while the next 3 represent other time frames which you can set in 'MA+ ROC' settings.
Support User Defined time frames or automatic time frames based on a multiplier value.
Better define same or higher time frames than your chart time frame to get accurate results.
Can work in conjunction with MA+ to display the moving average line, click here:
Like if you Like and follow-up for up coming new indicators: www.tradingview.com

ROC Between SymbolsThis script is a simple Rate Of Change (ROC) closing price comparison between a "compare" symbol and a "base" symbol over a user-specified period (maximum 200).
When the ROC is greater than zero, >0 (positive), the compare symbol is increasing faster than the base symbol -- the compare symbol has positive comparative momentum. Of course, your compare symbol could be flat and your base symbol could be decreasing, but math-wise these scenarios are equivalent and the compare symbol has positive comparative momentum.
When the ROC is less than zero, <0 (negative), the compare symbol has negative comparative momentum. Again, the base symbol could be increasing and the compare symbol could be flat, but math-wise this is the same scenario and the compare symbol has negative comparative momentum.
This ROC comparison tactic was documented and described on YouTube channel "Figuring Out Money" in an interesting study between Bitcoin and Gold prices on a weekly timeframe.
Rate Of Change Bands [CC]The Rate Of Change Bands were created by Vitali Apirine (Stocks and Commodities March 2021 pg 14) and this indicator is a great method to not only check the momentum but also check the trend strength as well. I have color coded the lines so buy when the line turns green and sell when it turns red.
Let me know if there are any other indicators you want me to publish!

ROC of Majors against the USD (Label)Version 2 of the ROC study that now puts them as a label on the same chart.
ROC of Majors against the USDA simple study that shows the majors against the USD Rate of Change.
Allows you to pick opposing strength pairs to trade.
There are different ROC calculations for people to play with as I am not sure which way the ( ) should be so feedback is welcome.
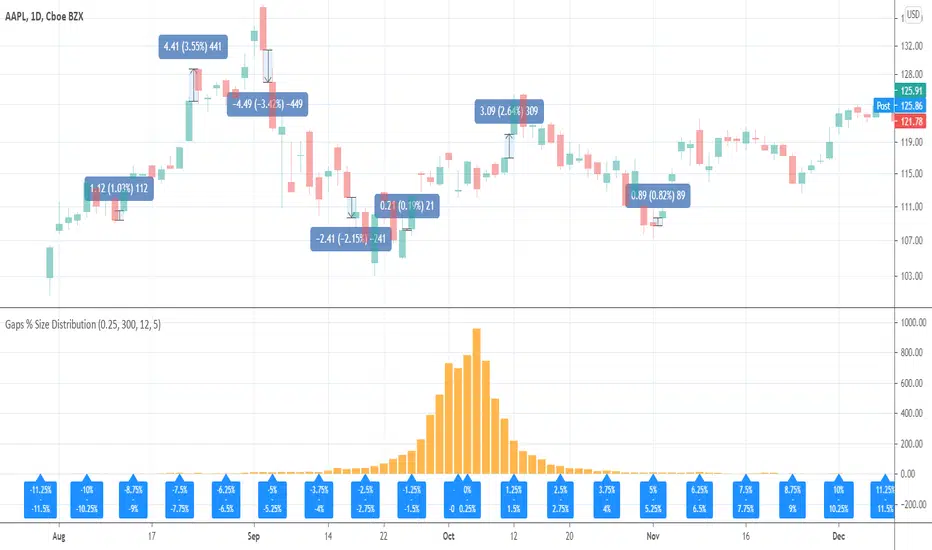
Gaps % Size DistributionThis tool is to visualize the distribution of gap % sizes, i.e. those things that I marked on the main chart. The tool uses the entire history of an instrument.
The detalization depends on the Binning Step parameter. The lower chart timeframe the lower that step should be.
Good luck.
Combo Month-to-Month % ReturnA combined version of two already published indicators:
Combo Month-to-Month % Return (January - June)
Combo Month-to-Month % Return (July - December)
Allows to compare an asset's monthly returns over years.
Includes:
Customizable columns
Up to 20 columns per each chart
Customizable Min, Max, Mean, Median and Standard Deviation lines
Customizable labels

Fractals ROC AlertI am playing William's Fractals and got an idea to calculate each fractal's strength by these rules:
- downFractal. FractalROC = (close - lowest(n+1))/(open【2*n】-lowest(n+1))
- upFractal FractalROC = (highest(n+1)-close)/(highest(n+1)-open【2*n】)
And set up a level to filter small fractals.
Bigger FractalROC, Stronger trend

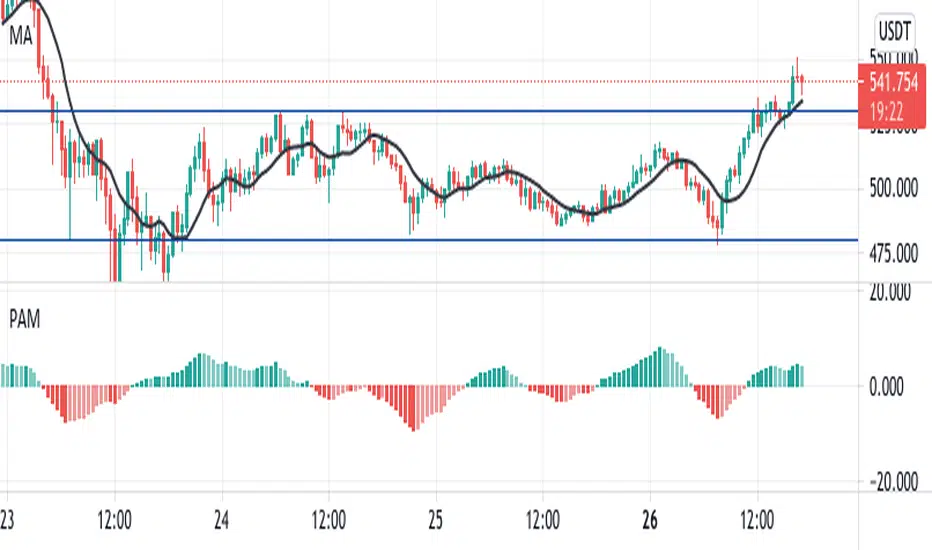
Price Acceleration Momentum [PAM]this indicator plots the acceleration of the price using the derivatives of RSI.
you can use it just like a momentum oscillator to catch divergences, trend direction, breakout direction, etc
RSI/Momentum derivativesthis indicator plots the derivatives of the RSI to get more leading sense of direction of the price
we know that the rsi shows us the momentum of the price, so the easiest/logical way to interpret this indicator and benefit from it is as follows:
- see the price as 'distance'
- see the rsi as 'speed'
- see the rsi/momentum of the above/'speed' as 'velocity'
- see the rsi/momentum of the above/'velocity' as 'acceleration'
once you understand this you can analyse and interpret this indicator to give you a more leading analysis and more accurate entry and exit points.
- also includes the RMA for each RSI derivative which can help for identifying breakouts, direction of price, pivot points and more.
in the above chart
- black is the standard rsi/speed
- orange is the momentum of the rsi/velocity
- green is the momentum of the velocity
