Reticulata - StrategyThis is the backtesting script for Reticulata
Reticulata is the first of many scripts to come from Bull Bear Bots. It is an early release version and supports multiple trade logics.
The script works across various markets including Forex and Cryptocurrencies.
All of our scripts are designed for manual traders but are ready to use with automated trading bots.
www.bullbearbots.com
相対力指数 (RSI)

ANN RSI SUPER TREND STRATEGY BY che_traderCreate a strategy for the good indicator created by @RafaelZioni
Which is composed of ANN data taken from
and the super trend shared by www.tradingview.com
Feel free to share and copy this script!
Enjoy!

BUY SELL Based on Average RSIThis Script generates buy sell signal based on RSI Average Calculation.
Best to use in one hour time frame.

JARVIS_SWING_STRATEGYJARVIS_SWING_STRATEGY
Indicator is to be used as lagging, long/short after confirmation only.
Works in all timeFrames but best to use for day. WAIT FOR CANDLE TO FINISH
Use HK candle, no slippage required really. If you use on Day chart, just buy it after 4:00. You will get close to the price or just buy next at open ( which you see in list of trades).
len_rsi => Length of the rsi
smooth_1 = smooth the indicator with length
smooth_2 = smooth the indicator again with length
ignore_error = ignore if error is below value
indicator only => Shows the indicator only, not show trades
plot_indicator_at => plot indicator at value =0 ( Still trying to scale it automatically, but for now you can adjust it)
back_test_year >= enter the year for you want to backtest.
Long_only=> strategy will not short. Just exit long position based on signal

VRSI-MARSI StrategyI wanted to create an indicator which resembles price movement, aside to volume movement.
The "yellow-blue" line is the MA(5) of the RSI (9) of closing price.
The "orange" line is the MA(5) of the RSI (9) of Volume .
(Default plot of RSI and VRSI is not visible but can be made visible ("Settings" > "Style" > set "Opacity" of "RSI & VRSI"))
The Long (Buy) condition is triggered when the MA(5) of the RSI (9, close) goes up.
The Short (Sell) condition is triggered when the MA(5) of the RSI (9, close) goes down.
Comparing the price movement with the "orange" Volume line helps to spot a possible trend change,
for example when price goes up and an ascending Volume line starts to flatten or starts descending,
this could be a sign that the Bullish trend is weakening, predicting a possible trend change.
Or, when for example a downwards price movement is accompanied with a rising Volume line, this can be a sign of large Bearish power.
Because it still is a RSI indicator, the midline (50), and Oversold/Overbought area's (20-30 & 70-80) are important to watch, especially the MARSI!
A second strategy is made (VRSI-MARSI Strategy 2) where the Long/Short condition is triggered when "MA RSI (close) - MA RSI ( Volume )" crosses.
-------------------------------------------------------------------------------------------------------------------------------------------------------------------------
The Long & Short entries, as well as the Entry Close are visible 1 bar after the trigger.
When the blue line changes in a yellow line (and vice versa) it will show a candle earlier (see yellow dashed lines = (1)).
Also, the condition is fulfilled when the candle closes (2), but the order doesn't take place in the same bar, but the next (3).
Because this is a strategy the "actual Order" will not take place at the "Close" of the candle (2), but at the "Open" at the NEXT candle (3).
I also have this strategy as a study (A+B), where the "Buy" & "Sell" shows a candle earlier.
-------------------------------------------------------------------------------------------------------------------------------------------------------------------------
The entries are default 5% of equity, without pyramiding, which already gives large profits.
A large part of the profit is because of the Entry Close of the Long & Short entries.
You can easily turn these off (Settings > Inputs) to see what profit the strategy gives without Entry Close.
Here they are disabled:
-------------------------------------------------------------------------------------------------------------------------------------------------------------------------
More information available in the script ;-)

[astropark] Super RSI [strategy]Dear Followers,
today a new Scalper Tool , which works great on 3 minutes and 5 minutes timeframes , but also down to 1m and up to 30m!
I called it " Super RSI ", as it is based on RSI and inherits some basic functionality from it.
If you check its settings, you will see that you can have 3 different buy-sell sources (first two are active by default):
STRONG BUY/SELL : buy when white area deeply falls into oversold-red zone and sell when white area gets into overbought-green zone (you can set and edit at which level oversold and overbought zones start);
CROSSES : buy when the black RSI line in the middle between red and green area cross under the buy cross limit value and sell when it crosso over the sell cross limit value (you can set and edit specific cross ranges for both buy and sell);
WEAK BUY/SELL : buy when green area at least go below 50 level and sell when red area at least goes above 50 level (you can edit both levels); these conditions are highlighted as background color and are very useful for taking (at least partial) profits in trades.
By default the script will be placed as oscillator on a specific pane below the chart, but
> you can disable the oscillator plot by enabling the "hide all plot" option
> and place it as overlay on chart by clicking on the black arrow at then end on the indicator name in chart and selecting "move to -> existing pane above"
This strategy can trigger till 10 buy or 10 sell signals in a row before reverting, so use a proper money management .
Strategy results are calculated on 20 trading days using 1000$ as initial capital and working at 10x leverage.
The user who wants to use this strategy, especially via an automated bot, must always set a stoploss at 3-5% from entry point or use a proper risk management strategy .
This is not the "Holy Grail", so use it with caution.
This script will let you backtest the strategy and find best settings for your preferred market.
The alarms script version of this indicator, which will let you set all notifications you may need in order to be alerted on each triggered signals, can be found by searching for " Super RSI".
This is a premium indicator , so send me a private message in order to get access to this script .

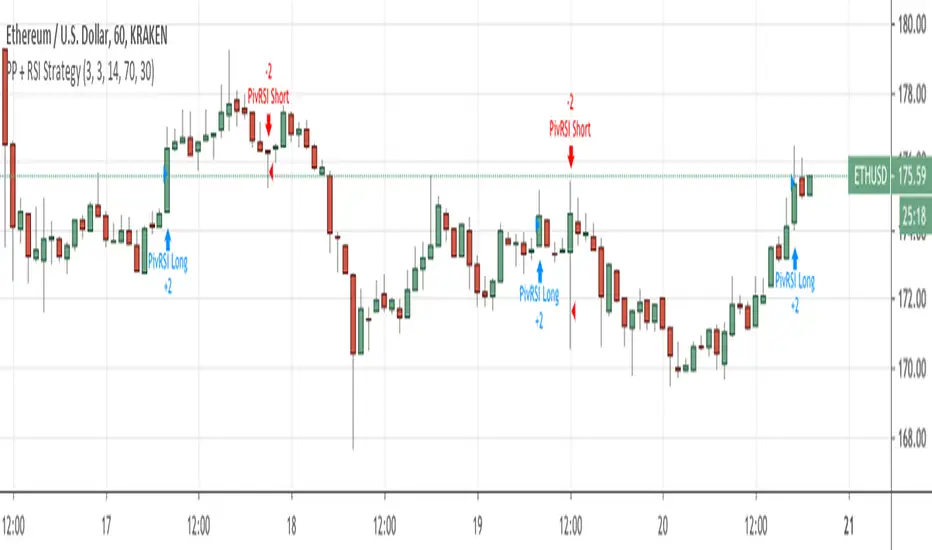
Pivot Point Reversal + RSI StrategyThis strategy joins the Pivot Reversal strategy with the RSI indicator.
We check RSI level at the pivot point level and only if RSI condition is satisfied we update levels for stop orders.
The strategy works pretty good for crypto, 30m, 1h, 2h timeframes.
Easy to Use Stochastic + RSI StrategyA simple strategy that yields some great results.
CODE VARIABLES
LINE 2 - Here you can change your currency and amount you want to invest on each entry.
LINE 10/11/12 - Here we establish what date we want to start backtesting from. Simply change the defval on each line to change the date (In the code below we start on Jan 1st, 2014).
LINES 19 through 27 - Here we set our Stochastic and RSI sensitivity (Currently %K = 14, %D = 3, RSI = 14). Change these to your preference.
LINE 39/41 - Here we execute our orders (Currently set when %K crosses %D under the 20 value and RSI is less than 50 to BUY, %K crosses %D above the 80 value and RSI is greater than 60 to SELL). Change these to your preference.
NOTE: As a beginner you may not want to short stock, therefore LINE 6 was added to only allow long positions.
I didn't overlay the RSI value over the Stochastics because it was too cluttered. Just add the RSI indictor seperately to your layout.
As always, couple this with trend following and exit/entry rules to make the profitability even higher!
Cheers!

[astropark] Super Stochastic RSI [strategy]Dear Followers,
today a new Scalper Tool , which works great on 3 minutes and 5 minutes timeframes !
I called it " Super Stochastic RSI ", as it is based on StochRSI and inherits some basic functionality from it.
If you check its settings, you will see that you can have 3 different buy-sell sources (first two are active by default):
STRONG BUY/SELL : buy when green area deeply falls into oversold zone and sell when red area gets into overbought zone (you can set and edit at which level oversold and overbought zones start);
K/D CROSSES : buy when k-line cross above d-line and sell viceversa (you can set and edit specific cross ranges for both buy and sell);
WEAK BUY/SELL : buy when green area at least go below 50 level and sell when red area at least goes above 50 level (you can edit both levels); these conditions are highlighted as background color and are very useful for taking (at least partial) profits in trades.
By default the script will be placed as oscillator on a specific pane below the chart, but
> you can disable the oscillator plot by enabling the "hide all plot" option
> and place it as overlay on chart by clicking on the black arrow at then end on the indicator name in chart and selecting "move to -> existing pane above"
This strategy can trigger till 10 buy or 10 sell signals in a row before reverting, so use a proper money management .
Strategy results are calculated on 20 trading days using 1000$ as initial capital and working at 10x leverage.
The user who wants to use this strategy, especially via an automated bot, must always set a stoploss at 3-5% from entry point or use a proper risk management strategy .
This is not the "Holy Grail", so use it with caution.
This script will let you backtest the strategy and find best settings for your preferred market.
The alarms script version of this indicator, which will let you set all notifications you may need in order to be alerted on each triggered signals, can be found here below:
This is a premium indicator , so send me a private message in order to get access to this script .

[BERA] POWER STRATEGYHey below my new strategy test, hope you like.
Work better with BTC
H1 and H4 timeframe.
How this work?
RSI based script.
-Modified length and different metrics for long and short.
Moving Averages.
-RSI panel below with color labels to identify the rsi levels.
-Simple trailing stop included.
Entry orders and exit orders for both -long and -short.
The default setup is the best perfomance i've find testing it.
If you are interest in the script contact me.


Easy to Use MACD+RSI Strategy
BEGINNERS REJOICE!
Easy to use strategy test using MACD with RSI as a confirming indicator. The code is structured to make it easy to manipulate the variables to your choosing.
EASY TO CHANGE CODE VARIABLES
LINE 2 = Change the amount you invest every trade and the currency
LINE 8/9/10 = Change the defval of each of these lines to backtest from a certain date
LINE 16/17/18 = Change the MACD sensitivity by changing the defval on each line
LINE 21 = Change the value after close toadjust the sensitivity of the RSI
LINE 37/39 = Change/remove the < and > variables for macdLine and rsivalue after the crossover/crossunder to adjust your buying point further.
As a beginner you may not feel comfortable with shorting stocks, therefore LINE 5 was added to only allows long positions.
Funny how a simple indicator can return such a high profitability. Couple this with some trend/exit strategies and you'll have something really special!
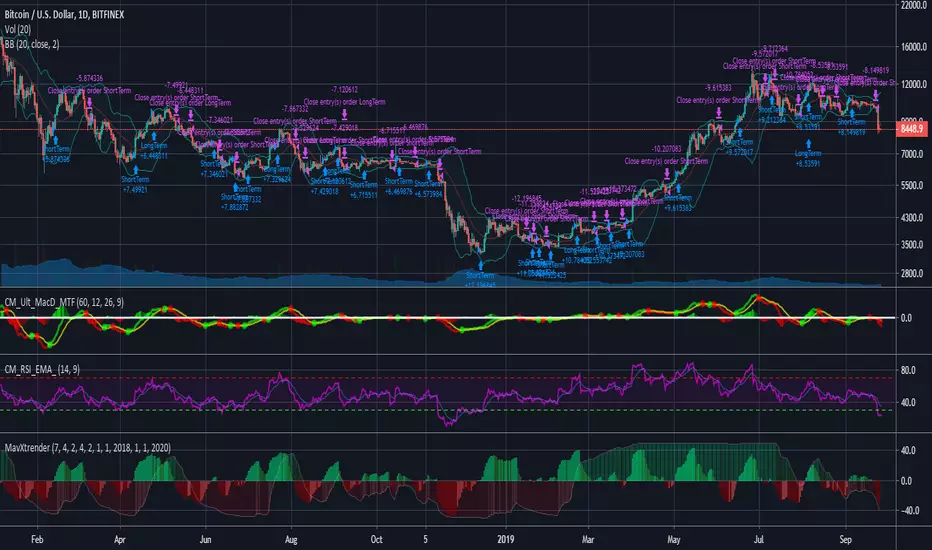
REAL STRATEGY : Dow_Factor_MFI/RSI_DVOG_StrategyI'm actually one of those who think it's more important to extract clues from indicators than strategy, but I wanted to test the data about the probability and dow factor I've shared for a long time.
Usually, Bitcoin is used as an eye stain for strategy success, since the graph has increased significantly from the beginning.
To prevent this, I used a commission and in the last lines of document I shared Bitmex's Bitcoin and Ethereum 1W test results.
I don't think there's a factor to repaint. ( Warn me if u see or observe )
I considered Bitcoin because I found working with liquid parities much more realistic.
Ethereum and Bitmex have been featured as a spot and may soon find a place at the CME , so I've evaluated the Ethereum .
But since the Ethereum Bitmex was also spot new, I deleted results that were less than 10 closed trades.
Since the Dow Theory also looks at the harmony in the indices, just try it in the Cryptocurrency market.
Use as indicator in other markets. Support with channels, trend lines with big periods and other supportive indicators.
And my personal suggestion : Use this script and indicator TF : 4H and above.
Specifications :
Commission. ( % 0.125 )
Switchable Methods ( Relative Strength Index / Money Flow Index )
Alarms. (Buy / Sell )
Position closure when horizontal market rates weighs.
Progressive gradual buy/sell alarms.
Clean code layout that will not cause repaint. (Caution : source = close )
Switchable barcolor option (I / 0 )
*****Test results :*****
drive.google.com
Summary:
It was a realistic test.
It has achieved great success in some markets, but as I mentioned earlier, use it only to gain insight into the price movements of cryptos.
Use as indicator in other markets.
This code is open source under the MIT license. If you have any improvements or corrections to suggest, please send me a pull request via the github repository : github.com
Stay tuned ! Noldo.

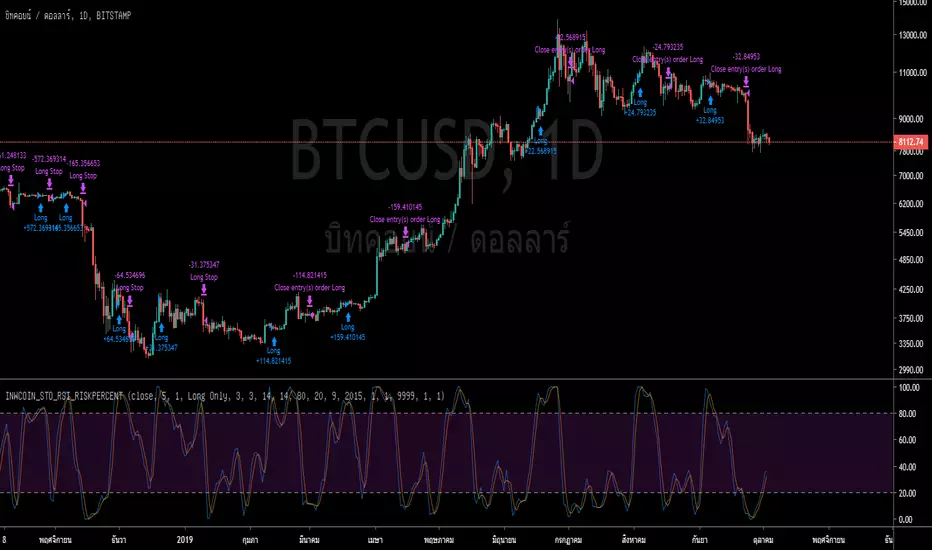
inwCoin Simple RSI OB/OS Risk% Strategy=========================
English
=========================
Just simple RSI overbought/oversold strategy.
To prove of concept that if we buy when RSI reach oversold and sell when RSI reach overbought, will it work or not. ( And yes, it's not working! )
==========================
Thai
==========================
ลองเขียน strategy ที่ใช้ RSI ง่ายๆ ขึ้นมาดู พบว่า ผล backtest ใช้ได้ดีกับช่วง sideway ตลอดเดือน 7-8-9 2019 ที่ผ่านมา
แต่ปัญหาคือ กว่าจะปรับให้ได้กำไร มันก็ไม่ได้ใช้ค่ามาตรฐาน .. คือเหมือนเราปรับเพื่อให้ผลลัพธ์มันออกมาดีมีกำไร แต่ไปใช้จริงๆ หลายๆ ช่วงก็ไม่มีกำไรนะ
ยิ่งถ้าช่วง รันเทรน จากเดือน 4 ยาวมาสิ้นเดือน 6 นี่ ไปใช้กลยุทธนี้มีแต่ขาดทุน
ส่วนช่วง sideway ต้นปี ก็ดันใช้กลยุทธนี้ไม่ได้อีก ต้อองไปปรับแก้ระดับ ob / os ถึงจะได้กำไร
ผมก็เลยเห็นว่าไม่เวิร์คแฮะ 555 แต่ก็แชร์มาไว้ก่อน ยังไงก็เขียนมาจนเสร็จละ จะดองไว้ก็เสียดาย

inwCoin Stochastic RSI Risk% Strategy.=========================
English
=========================
Just STO RSI proof of concept strategy.
Buy = k & d cross over 80
Sell = k & d cross down 20
tried k & d cross but it's not working ( still not profit enough )
==========================
Thai
==========================
ที่คนเขาสอนๆ กันคือ ถ้า sto rsi ตัดกันที่ข้างล่าง ให้เข้า buy พอไปตัดกันข้างบนก็ค่อย sell
กลายเป็นว่าพอมา backtest จริงๆ logic นี้กลับไม่เวิร์คขึ้นมาซะงั้น
ตัวที่ work ดันเป็น เส้น k และ d ตัดเส้นบน ( 80 )ขึ้นไปค่อยเข้า buy
ส่วนถ้าสองเส้น k และ d ตัดเส้นล่างลง ( 20 ) ก็ค่อย sell
วิธีนี้เราจะค่อนข้างมั่นใจว่าถ้าเข้าแล้ว ราคามันจะไปต่อจริง
เออ ประหลาดดีมากครับ
ลองดูนะ ว่าวิธีนี้เวิร์คไหม
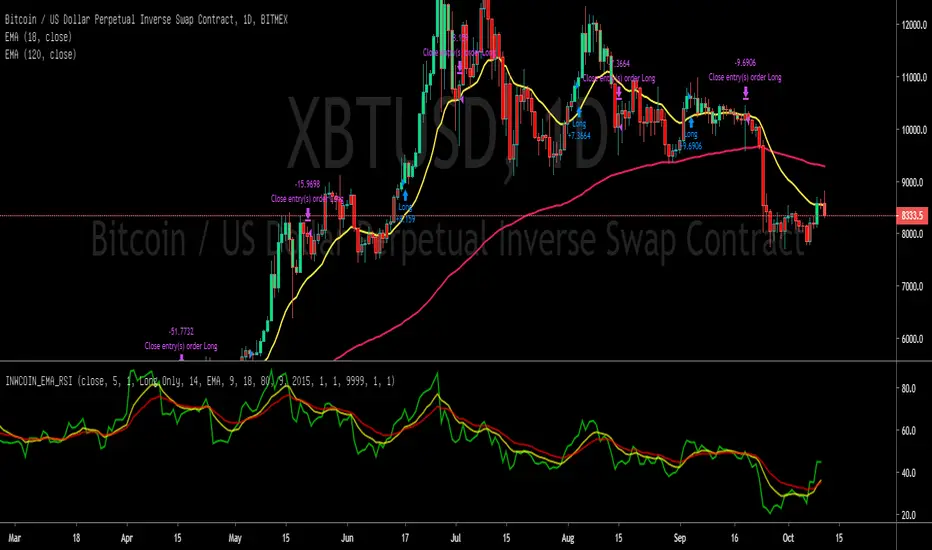
inwCoin EMA of RSI Risk% Strategy=========================
English
=========================
Just simple strategy idea using EMA of RSI crossing to define entry and exit.
Looking good for backtest result but I'm not sure will it ok if live trade.
Please make sure to paper trade ( forward test ) for few month if you want to use this strategy.
Also, this is for education purpose and not the investing advise.
Use it as your own risk.
-----------
Concept
-----------
Making slow and fast EMA of RSI and decide when to enter/exit trade
If fast crossover slow = Buy
If fast crossunder slow = Sell
You can using trend filter to filter out downtrend
Recommend value is 80 for Daily TF
This strategy is no good for small TF because EMA of RSI will cross up and down like crazy and I'm sure you'll losing money if you follow this strategy in real trade lol.
==========================
Thai
==========================
มีคนถามในห้อง Bitcoin Thai Club ว่า ถ้าใช้ EMA of RSI แล้วหาจุดเข้าออกจากตรงนั้นจะเป็นไง
ก็เลยลองทำ proof of concept strategy ออกมาดู
กลายเป็นว่า... ให้ผลค่อนข้างดีกว่าไอ้ตัวที่เคยมีซะอีก โว๊ะ!! 555
เท่าที่ไล่กดดูหลายๆ Timeframe พบว่า ยิ่ง TF เล็ก noise ยิ่งเยอะ ทำให้การตัดกันของเส้น EMA ค่อนข้างพันกันไปมา ทำให้มีการเข้าๆ ออกๆ แบบเสียเปล่าเยอะไปหน่อย
ถ้าใครจะใช้ แนะนำให้ใช้ TF daily กับ weekly ขึ้นไปน่าจะให้ผลที่พอเชื่อถือได้
===========
หลักการ
===========
ใช้ EMA สองเส้น คือ EMA fast กับ EMA slow โดยไปหาค่า ema ของ rsi แล้วหาจุดตัดของสอง ema นั้นๆ
ema fast ตัด ema slow ขึ้น = ซื้อ
ema fast ตัด ema slow ลง = ขาย
ง่ายๆ แค่นี้เอง
เท่าที่ไล่ดูด้วยตา มันสามารถออกที่ยอดได้ค่อนข้างสวยอยู่พอสมควร ( ถ้าใช้ TF daily หรือ weekly นะ )
ใครจะเอาไปเล่น ก็อย่าลืม forward test กันก่อนจะไปลงเงินจริงนะ
ตรงนี้เป็นแค่ concept แต่เวลาเทรดจริงมันอีกเรื่องนึงเลย

AlgoNinja RSI/MACDAlgoNinja buy/sell signal based on MADC/RSI/StochRSI data. BETA - Use at your own risk!

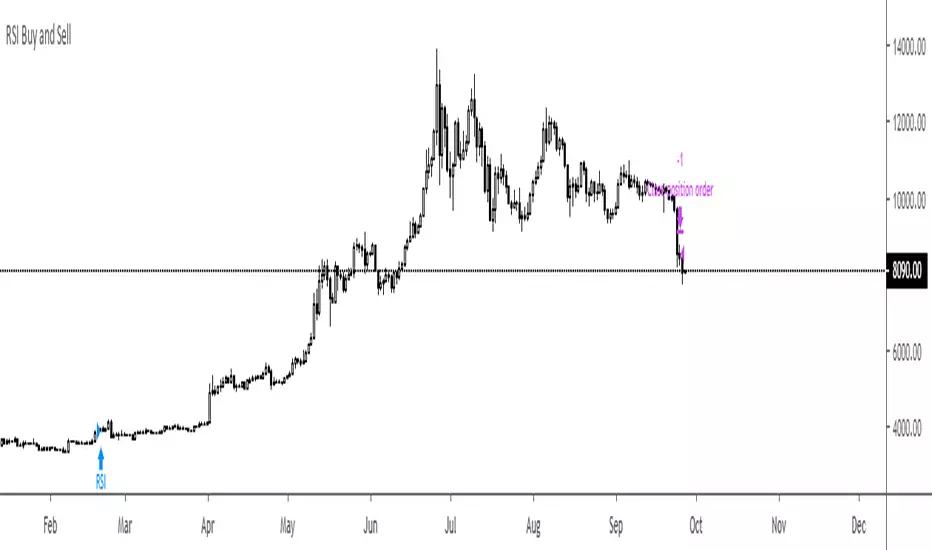
RSI Buy and SellThis is sooooooooo simple.
Buy when RSI is above 70 and don't sell til it'sunder 30.
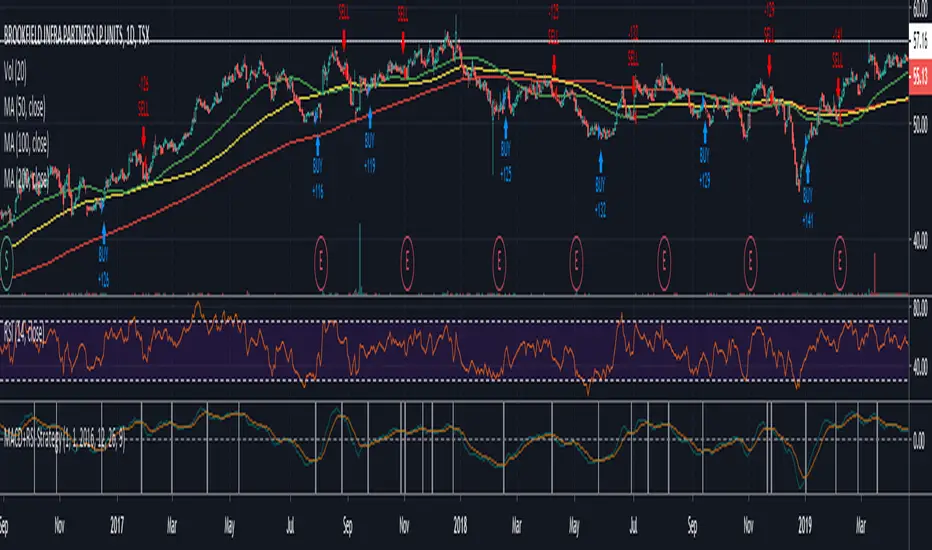
BTC Daily Strategy BFStrategy based on code by @CredibleHulk so thanks for that.
This is a strategy for the Daily Bitcoin chart which uses the MACD, RSI, Stochastic RSI and a moving average.
The conditions for long or short signals depend on the indicators above crossing user-defined thresholds.
Long signal = (Stochastic RSI k value is below Stochastic Sell Threshold) AND EITHER (MACD delta crosses above MACD Threshold OR RSI crosses above RSI Threshold)
Short signal = (MACD delta crosses below 0) AND EITHER (Close Price - an SMA of the ohlc4 values crosses below the DMA threshold OR Stochastic RSI k value is above Stochastic Sell Threshold)
INSTRUCTIONS
Green background = go long
Red background = go short
You can adjust stop loss values for long or short signals in settings as well as all parameters for the indicators.

MavXtrenderConverted the B-Xtrender script from Puppytherapy into a strategy script.
B-Xtrender was created by Bharat Jhunjhunwal and published in this IFTA Journal .
I've added the following features:
Ability to use factors instead of individual values for each parameter. This will allow you to quickly check different averages (5 vs 7 for example).
Defaults adjusted for crypto trading (7 days/week).
Switches to use either the short or long term indicator, or both.
Time window
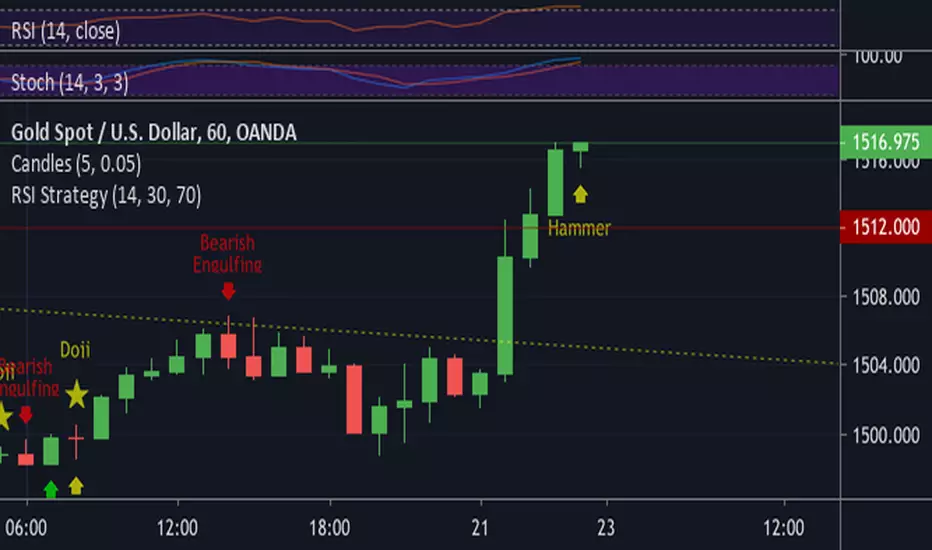
RSI StrategyNothing special in this strategy its just purely and application of RSI in 1hour chart of XAUUSD.
Buy and Sell Indicator - OnePunchOne of the Top Class Breakout, Buy and Sell Strategy for Long Term, Day Traders and Short Term Holder.
With This Script;
You Can Get Breakout Signals
You Can Get Buying Points
You Can Get Selling Points
You Can Find Out If a Stock Over Sold
You Can Find Out If a Stock Over Bought
